

Key Points
The large PETHEMA registry shows that secondary AML represents 27% of AML cases and confirms its independent adverse prognostic value.
Subcategories of secondary AML were analyzed, including MSD/MPN and therapy-related cases, with different features and outcomes.

Abstract
Secondary acute myeloid leukemia (sAML) comprises a heterogeneous group of patients and is associated with poor overall survival (OS). We analyze the characteristics, treatment patterns, and outcomes of adult patients with sAML in the Programa Español de Tratamientos en Hematología (PETHEMA) registry. Overall, 6211 (72.9%) were de novo and 2310 (27.1%) had sAML, divided into myelodysplastic syndrome AML (MDS-AML, 44%), MDS/myeloproliferative AML (MDS/MPN-AML, 10%), MPN-AML (11%), therapy-related AML (t-AML, 25%), and antecedent neoplasia without prior chemotherapy/radiotherapy (neo-AML, 9%). Compared with de novo, patients with sAML were older (median age, 69 years), had more Eastern Cooperative Oncology Group ≥2 (35%) or high-risk cytogenetics (40%), less FMS-like tyrosine kinase 3 internal tandem duplication (11%), and nucleophosmin 1 (NPM1) mutations (21%) and received less intensive chemotherapy regimens (38%) (all P < .001). Median OS was higher for de novo than sAML (10.9 vs 5.6 months; P < .001) and shorter in sAML after hematologic disorder (MDS, MDS/MPN, or MPN) compared with t-AML and neo-AML (5.3 vs 6.1 vs 5.7 months, respectively; P = .04). After intensive chemotherapy, median OS was better among patients with de novo and neo-AML (17.2 and 14.6 months, respectively). No OS differences were observed after hypomethylating agents according to type of AML. sAML was an independent adverse prognostic factor for OS. We confirmed high prevalence and adverse features of sAML and established its independent adverse prognostic value. This trial was registered at www.clinicaltrials.gov as #NCT02607059.
Introduction
Secondary acute myeloid leukemia (sAML) includes therapy-related AML (t-AML) and antecedent hematologic disorders.1,2 The reported incidence of sAML ranges from 18% to 28% of all AML cases and is associated with poor outcomes, including lower complete remission (CR), overall survival (OS), and relapse-free survival rates than de novo AML.1,3-6 Consequently, the diagnosis of sAML has been considered a risk factor for early death and OS in some predictive models.7,8 Nevertheless, its independent prognostic value has been questioned due to its association with older age, frequent comorbidities/organ dysfunction, and unfavorable cytogenetic and molecular profile.9 On the other hand, whether patients with AML with antecedent neoplasia who did not receive chemotherapy or radiotherapy for the first malignancy (neo-AML) should be considered as having sAML remains an unresolved issue. To our knowledge, it is unknown if these patients have differential characteristics and outcomes compared with other sAMLs.
This study aims to analyze the incidence, clinical and biological characteristics, and outcome in a large series of patients with sAML reported to the Programa Español de Tratamientos en Hematología (PETHEMA) registry. These characteristics and outcomes will be compared with those of patients with de novo AML as well as between the different types of sAML and according to therapeutic approaches.
Methods
PETHEMA registry
The PETHEMA AML registry (NCT02607059) includes patients diagnosed with AML, regardless of the treatment administered. Patient and disease characteristics, in addition to treatment approaches and outcomes, were collected retrospectively, including demographics (age and gender), cytomorphological subtype of AML, cytogenetics, details on treatment schedule, response assessment, and disease follow-up (relapse or death). Optional forms were also collected, including baseline physical and laboratory examination; prior neoplastic/hematologic diseases or exposure to radiation, chemotherapy, or immunosuppressive drugs; molecular assessment (according to the site’s routine practice); treatment-related toxicities; and consolidation and post-consolidation schedules (eg, transplant and maintenance). Patient and disease baseline characteristics were captured at the time of diagnosis (before starting treatment).
Eligibility
Adult patients (age ≥ 18 years) reported to the multinational PETHEMA AML registry and diagnosed in Spanish and Portuguese institutions from 1 January 1990 until 31 December 2019 were included in the study. Patients with acute promyelocytic leukemia were excluded, just like those without information related to antecedents of prior malignancies, preleukemic hematological disorders, and leukemogenic or immunosuppressive therapies. The study was approved by Hospital Universitari i Politècnic La Fe’s Research Ethics Board according to the Declaration of Helsinki, and informed consent was a requisite for patients alive at the time of the analyses (15 September 2020).
Treatment schedules
Patients were classified into five groups according to intensity of therapy: intensive chemotherapy (IC), nonintensive chemotherapy (non-IC), hypomethylating agents (HMA), clinical trial, and best supportive care (BSC). IC schedules included the following regimens: 3 + 7 (idarubicin or daunorubicin and Ara-C), mitoxantrone plus Ara-C, FLAG-Ida (fludarabine, idarubicin, and Ara-C), FLAT (fludarabine, Ara-C, and topotecan), or ICE (idarubicin, Ara-C, and etoposide). HMA comprised decitabine or azacitidine at low doses. The non-IC group included FLUGA (fludarabine and Ara-C), FLAGIDA-Lite (fludarabine, Ara-C, and idarubicin), or LDAC. Regardless of the regimen intensity, all clinical trials were grouped in a separate treatment category. BSC included patients receiving transfusions and other supportive measures, including oral agents to control the white blood cell (WBC) counts (ie, hydroxyurea, melphalan, mercaptopurine, or thioguanine). Treatment schedules are detailed in supplemental Table 1.
Study definitions and endpoints
sAML comprised patients derived from myelodysplastic syndrome (MDS-AML), myeloproliferative neoplasm (MPN-AML), myelodysplastic/myeloproliferative neoplasm (MDS/MPN-AML), and t-AML. For the purposes of this study, we also included the aforementioned patients with neo-AML. The remaining patients were classified as de novo AML. Latency period was the time between diagnosis of the primary disease or previous cytotoxic therapy and sAML. Cytogenetics was classified according to the Medical Research Council (MRC) classification.10
According to the revised criteria by Cheson et al,11 CR required <5% of blast cells in bone marrow (BM) and absence of them in peripheral blood (PB), with neutrophil and platelet counts >1 × 10⁹/L and >100 × 109/L, respectively. If patients did not achieve these values of neutrophil and platelet counts in PB, response was classified as CR with incomplete recovery (CRi). Both CR and CRi had to be lacking in extramedullary disease. BM blasts between 5% and 25% and reduction >50% compared with the basal value was considered partial remission (PR). Independent of the therapeutic approach, response in patients who died before having been assessed was classified as induction death. Patients not meeting the previous criteria were considered resistant. After achieving CR/CRi, reappearance of disease in PB, blast cells in BM ≥ 5%, and development of extramedullary disease were criteria for relapse.
The primary end point was to compare baseline characteristics, CR/CRi, OS, and event-free survival (EFS) in all patients with reported sAML and according to therapeutic approaches. Other secondary end points were to analyze the differences in baseline characteristics and OS between patients with AML de novo and sAML and between different sAML subsets.
Statistical analysis
To analyze the relationship between the characteristics of the patients’ subgroups, χ-square with Yates’ correction, analysis of variance, Wilcoxon test, Student t test, and Kruskal-Wallis test were performed depending on the variable.
The Kaplan-Meier estimator12 was used to calculate unadjusted time-to-event variables and log-rank test13 to compare them. The corrected method of Kalbfleisch and Prentice was used for the estimation of medians and 95% confidence intervals (CI).14 OS was analyzed from the date of diagnosis of sAML until death and EFS from the date of diagnosis to death due to any cause, treatment failure, or relapse, whichever occurred first. Multivariate analysis for OS was performed through a Cox proportional hazards model and through multinomial logistic regression for CR/CRi. Characteristics with significant association in univariate analysis (P < .1) and those available variables with a possible relationship in previous studies were included in the multivariate analysis. Living patients at the time of the analysis were censored at the last known living day. Patient follow-up was updated on 31 December 2019. All P values reported are 2-sided. Computations were executed using the R 2.14.0 software package.
Results
Characteristics and treatment (sAML vs de novo AML)
Between January 1990 and December 2019, 11 224 patients with AML were registered from several institutions in Spain and Portugal. Of these patients, 8521 (75.9%) could be classified as de novo AML (n = 6211, 72.9%) or sAML (n = 2310, 27.1%). A Consolidated Standards of Reporting Trials (CONSORT) diagram is shown in Figure 1. Characteristics and treatment patterns of de novo vs sAML patients are shown in Table 1. Compared with patients with de novo AML, patients with sAML were older (median age in years, 69 vs 64; P < .001), were more frequently male (60% vs 53%; P < .001), had performance status Eastern Cooperative Oncology Group (ECOG) ≥2 (35% vs 28%; P < .001), had lower median WBC count in PB and blast cells percentage in BM (6.6 × 10⁹/L and 42% vs 10.4 × 10⁹/L and 64%, respectively, both P < .001), were more often classified with high-risk cytogenetics according to MRC (40% vs 24%; P < .001), and had less FMS-like tyrosine kinase 3 (FLT3) internal tandem duplication (ITD) and nucleophosmin 1 (NPM1) mutations (11% and 16% vs 21% and 33%, respectively; P < .001). Patients with sAML were less commonly treated up front with IC (P < .001).
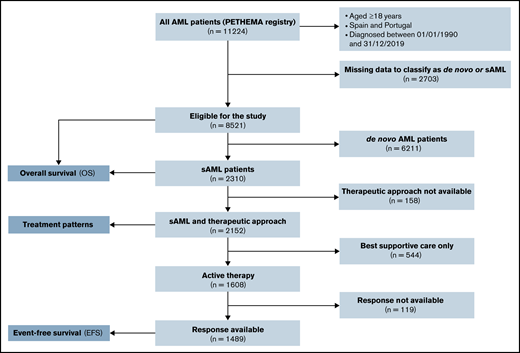
Consolidated Standards of Reporting Trials (CONSORT) diagram for secondary AML adult patients.
Consolidated Standards of Reporting Trials (CONSORT) diagram for secondary AML adult patients.
Demographic and baseline characteristics of the study population (de novo vs sAML, n = 8521)
| Characteristic | Overall | De novo | Secondary AML | P value | |||
|---|---|---|---|---|---|---|---|
| Median (range) | n (%) | Median (range) | n (%) | Median (range) | n (%) | ||
| Total | 8521 (100) | 6211 (100) | 2310 (100) | ||||
| Age, y | 66 (18-104) | 8507 (100) | 64 (18-99) | 6201 (100) | 69 (18-104) | 2306 (100) | <.001* |
| 18-29 | 389 (5) | 359 (6) | 30 (1) | <.001 | |||
| 30-39 | 549 (6) | 480 (8) | 69 (3) | ||||
| 40-49 | 823 (10) | 706 (11) | 117 (5) | ||||
| 50-59 | 1285 (15) | 998 (16) | 287 (12) | ||||
| 60-69 | 2087 (25) | 1421 (23) | 666 (29) | ||||
| 70-79 | 2333 (27) | 1535 (25) | 798 (35) | ||||
| 80-89 | 967 (11) | 649 (10) | 318 (14) | ||||
| ≥90 | 74 (1) | 53 (1) | 21 (1) | ||||
| Gender | 8432 (100) | 6127 (100) | 2304 (100) | ||||
| Male | 4643 (55) | 3266 (53) | 1377 (60) | <.001 | |||
| Female | 3788 (45) | 2861 (47) | 927 (40) | ||||
| ECOG | 1 (0-4) | 6640 (100) | 1 (0-4) | 4819 (100) | 1 (0-4) | 1821 (100) | <.001* |
| 0 | 1949 (29) | 1481 (31) | 468 (26) | <.001 | |||
| 1 | 2740 (41) | 2028 (42) | 712 (39) | ||||
| 2 | 1239 (19) | 852 (18) | 387 (21) | ||||
| 3 | 538 (8) | 336 (7) | 202 (11) | ||||
| 4 | 174 (3) | 122 (3) | 52 (3) | ||||
| FAB subtype | 8521 (100) | 6211 (100) | 2310 (100) | ||||
| M0/M6/M7 | 872 (10) | 638 (10) | 234 (10) | <.001 | |||
| M1/M2 | 2301 (27) | 1814 (29) | 487 (21) | ||||
| M4/M5 | 2156 (37) | 1764 (28) | 392 (17) | ||||
| Not available | 3192 (37) | 1995 (32) | 1197 (52) | ||||
| Hepatosplenomegaly | 4380 (100) | 3263 (100) | 1117 (100) | .63 | |||
| Yes | 962 (22) | 723 (22) | 239 (21) | ||||
| No | 3418 (78) | 2540 (78) | 878 (79) | ||||
| WBC, ×109/L | 9.2 (0-669) | 7801 (100) | 10.4 (0-669) | 5762 (100) | 6.6 (0.1-312) | 2039 (100) | <.001* |
| ≤5 | 3135 (40) | 2199 (38) | 936 (46) | <.001 | |||
| 5-10 | 883 (11) | 651 (11) | 232 (11) | ||||
| 10-50 | 2137 (27) | 1574 (27) | 563 (28) | ||||
| >50 | 1646 (21) | 1338 (23) | 308 (15) | ||||
| Hemoglobin, g/dL | 9 (1.3-18.7) | 7204 (100) | 9 (1.3-18.7) | 5353 (100) | 9 (3.3-17.2) | 1851 (100) | .71* |
| Platelet count, ×109/L | 56 (0-1645) | 7225 (100) | 57 (0-1419) | 5368 (100) | 51 (1-1645) | 1857 (100) | <.001* |
| BM blasts, % | 60 (0-100) | 6612 (100) | 64 (0-100) | 4937 (100) | 42 (0-100) | 1675 (100) | <.001* |
| Creatinine, mg/dL | 0.9 (0.1-10) | 4439 (100) | 0.88 (0.1-10) | 3022 (100) | 0.94 (0.1-9.2) | 1417 (100) | <.001* |
| Urea, mg/dL | 34 (2-267) | 3931 (100) | 33 (4-241) | 2650 (100) | 38 (2-267) | 1281 (100) | <.001* |
| Uric acid, mg/dL | 4.9 (0-45) | 3649 (100) | 4.8 (0-45) | 2443 (100) | 5.3 (0-21) | 1206 (100) | <.001* |
| Bilirubin, mg/dL | 0.6 (0.07-21) | 4011 (100) | 0.6 (0.1-21) | 2692 (100) | 0.67 (0.07-9.94) | 1319 (100) | <.001* |
| AST, U/L | 22 (2-1085) | 3869 (100) | 22 (2-1085) | 2599 (100) | 22 (5-496) | 1270 (100) | .61* |
| ALT, U/L | 20 (1-743) | 3987 (100) | 20 (1-743) | 2682 (100) | 19 (2-623) | 1305 (100) | .004* |
| AP, U/L | 73 (2-3571) | 3570 (100) | 71 (4-1474) | 2385 (100) | 78 (2-3571) | 1185 (100) | <.001 |
| Albumin, g/dL | 3.6 (0.5-8.5) | 3520 (100) | 3.6 (0.5-8.5) | 2388 (100) | 3.7 (1.7-7) | 1132 (100) | .03* |
| LDH, U/L | 480 (12-42 630) | 4827 (100) | 486 (16-42 630) | 3342 (100) | 460 (12-13 420) | 1485 (100) | .38* |
| Fibrinogen, mg/dL | 426 (1-1500) | 3686 (100) | 423 (1-1150) | 2610 (100) | 430 (1-1500) | 1076 (100) | .22* |
| Cytogenetics | 8521 (100) | 6211 (100) | 2310 (100) | ||||
| Normal | 2892 (34) | 2299 (37) | 593 (26) | <.001 | |||
| Abnormal | 3192 (37) | 2201 (35) | 991 (43) | ||||
| No metaphases | 592 (7) | 436 (7) | 156 (7) | ||||
| Not available | 1845 (22) | 1275 (21) | 570 (22) | ||||
| MRC cytogenetic risk | 6099 (100) | 4501 (100) | 1598 (100) | ||||
| Favorable | 474 (8) | 420 (9) | 54 (3) | <.001 | |||
| Intermediate | 3919 (64) | 3014 (67) | 905 (57) | ||||
| Adverse | 1706 (28) | 1067 (24) | 639 (40) | ||||
| FLT3-ITD | 4291 (100) | 3301 (100) | 990 (100) | ||||
| Positive | 789 (18) | 677 (21) | 112 (11) | <.001 | |||
| Negative | 3502 (82) | 2624 (79) | 878 (89) | ||||
| NPM1 | 4024 (100) | 3097 (100) | 927 (100) | ||||
| Positive | 1173 (29) | 1023 (33) | 150 (16) | <.001 | |||
| Negative | 2851 (71) | 2074 (67) | 777 (84) | ||||
| Therapeutic approach | 8520 (100) | 6210 (100) | 2310 (100) | ||||
| Intensive | 4620 (54) | 3744 (60) | 876 (38) | <.001 | |||
| Nonintensive | 974 (11) | 649 (10) | 325 (14) | ||||
| HMA | 780 (9) | 452 (7) | 328 (14) | ||||
| Clinical trial | 192 (2) | 113 (2) | 79 (3) | ||||
| BSC | 1467 (17) | 923 (15) | 544 (24) | ||||
| Unknown | 487 (6) | 329 (5) | 158 (7) | ||||
ALT, alanine transaminase; AP, alkaline phosphatase; AST, aspartate transaminase; FAB, French–American–British.
P compare continuous variables.
Characteristics of sAML according to treatment approach
Table 2 shows patient and disease features according to treatment approach in sAML. Among 2152 patients with sAML with available front-line treatment, 876 (38%) received IC, 328 (14%) received HMA, 325 (14%) received non-IC, 79 (3%) were in a clinical trial, and 544 (24%) received BSC. Patients who received BSC were older and had worse ECOG, higher uric acid, lactate dehydrogenase (LDH), creatinine, and alkaline phosphatase serum levels, lower albumin levels, and higher WBC in PB and BM blast percentage. Patients who received IC were younger, with more frequent t-AML or neo-AML, higher BM blast cells percentage, and more favorable cytogenetics, and they showed a trend to have more NPM1 mutations.
Characteristics of patients with sAML as per front-line treatment (n = 2152)
| Characteristic | IC | Non-IC | HMA | Clinical trial | BSC | P value | |||||
|---|---|---|---|---|---|---|---|---|---|---|---|
| Median (range) | n (%) | Median (range) | n (%) | Median (range) | n (%) | Median (range) | n (%) | Median (range) | n (%) | ||
| Total | 876 (100) | 325 (100) | 328 (100) | 79 (100) | 544 (100) | ||||||
| Age, y | 61 (18-85) | 875 (100) | 72 (24-91) | 325 (100) | 73 (29-88) | 327 (100) | 72 (31-89) | 79 (100) | 77 (23-104) | 542 (100) | <.001* |
| Gender | 870 (100) | 325 (100) | 328 (100) | 79 (100) | 544 (100) | ||||||
| Male | 518 (59) | 199 (61) | 209 (64) | 52 (66) | 305 (56) | .15 | |||||
| Female | 352 (41) | 126 (39) | 119 (36) | 27 (34) | 239 (44) | ||||||
| ECOG | 1 (0-4) | 726 (100) | 1 (0-4) | 256 (100) | 1 (0-4) | 273 (100) | 1 (0-3) | 75 (100) | 2 (0-4) | 433 (100) | <.001* |
| 0 | 252 (34) | 62 (24) | 50 (18) | 26 (35) | 57 (13) | <.001 | |||||
| 1 | 320 (44) | 101 (40) | 134 (49) | 38 (51) | 99 (23) | ||||||
| 2 | 113 (16) | 59 (23) | 70 (26) | 10 (13) | 126 (29) | ||||||
| 3 | 35 (5) | 26 (10) | 17 (6) | 1 (1) | 115 (27) | ||||||
| 4 | 6 (1) | 8 (3) | 2 (1) | 0 (0) | 36 (8) | ||||||
| Type of sAML | 764 (100) | 302 (100) | 258 (100) | 76 (100) | 481 (100) | ||||||
| MDS-AML, MDS/ MPN, and MPN-AML | 429 (56) | 209 (69) | 189 (73) | 55 (72) | 354 (74) | <.001 | |||||
| t-AML | 261 (34) | 68 (23) | 51 (20) | 14 (19) | 83 (17) | ||||||
| Neo-AML | 74 (10) | 25 (8) | 18 (7) | 7 (9) | 44 (9) | ||||||
| FAB subtype | 658 (100) | 252 (100) | 189 (100) | 50 (100) | 341 (100) | ||||||
| M0/M6/M7 | 100 (15) | 37 (15) | 26 (14) | 6 (12) | 59 (17) | <.001 | |||||
| M1/M2 | 233 (35) | 86 (34) | 40 (21) | 18 (36) | 103 (30) | ||||||
| M4/M5 | 196 (30) | 56 (22) | 28 (15) | 11 (22) | 92 (27) | ||||||
| Not available | 129 (20) | 73 (29) | 95 (50) | 15 (30) | 87 (26) | ||||||
| WBC, ×109/L | 6.7 (0.1-289) | 800 (100) | 6.3 (0.4-312) | 296 (100) | 4.3 (0.5-214) | 300 (100) | 4.7 (0.5-158) | 78 (100) | 10.2 (0.2-310) | 484 (100) | <.001* |
| Hemoglobin, g/dL | 9.1 (3.3-17.2) | 730 (100) | 8.8 (4.1-13.9) | 287 (100) | 8.9 (4.8-14.9) | 293 (100) | 9.0 (3.2-14.3) | 76 (100) | 8.9 (3.4-16.4) | 393 (100) | .02* |
| Platelet count, ×109/L | 49 (2-1442) | 731 (100) | 50 (1-1645) | 287 (100) | 59 (3-870) | 294 (100) | 40 (7-350) | 76 (100) | 58 (1-1372) | 396 (100) | .15* |
| BM blasts, % | 50 (0-100) | 676 (100) | 39 (3-100) | 270 (100) | 32 (0-100) | 286 (100) | 34 (16-94) | 74 (100) | 47 (3-100) | 324 (100) | <.001* |
| Creatinine, mg/dL | 0.87 (0.07-7.2) | 613 (100) | 0.99 (0.39-3.63) | 220 (100) | 0.99 (0.47-7) | 185 (100) | 0.96 (0.42-1.84) | 69 (100) | 1.12 (0.25-9.2) | 281 (100) | <.001* |
| ≤1.3 | 534 (87) | 172 (78) | 149 (81) | 59 (86) | 182 (65) | <.001 | |||||
| >1.3 | 79 (13) | 48 (22) | 36 (19) | 10 (14) | 99 (35) | ||||||
| Urea, mg/dL | 32 (4-255) | 547 (100) | 42 (1.9-162) | 205 (100) | 41 (12-195) | 170 (100) | 38 (12-117) | 68 (100) | 47 (10-267) | 246 (100) | <.001* |
| Uric acid, mg/dL | 4.7 (0-14.4) | 540 (100) | 5.6 (0-17.1) | 187 (100) | 5.7 (1.7-13.6) | 158 (100) | 5.3 (0.1-11) | 61 (100) | 6.1 (0.6-21) | 218 (100) | <.001* |
| Bilirubin, mg/dL | 0.6 (0.1-8.1) | 582 (100) | 0.7 (0.1-9.9) | 207 (100) | 0.7 (0.2-5.3) | 172 (100) | 0.7 (0.2-3.9) | 65 (100) | 0.7 (0.2-8.1) | 248 (100) | .01* |
| AST, U/L | 22 (5-213) | 565 (100) | 22 (8-154) | 204 (100) | 20 (7-88) | 163 (100) | 22 (11-99) | 56 (100) | 23 (7-141) | 238 (100) | .18* |
| ALT, U/L | 20 (3-498) | 577 (100) | 19 (2-233) | 206 (100) | 16 (3-91) | 170 (100) | 18 (4-623) | 59 (100) | 19 (3-168) | 247 (100) | .02* |
| AP, U/L | 76 (2-1252) | 533 (100) | 75 (18-812) | 186 (100) | 73 (19-894) | 159 (100) | 75 (42-416) | 55 (100) | 95 (23-3571) | 208 (100) | <.001* |
| Albumin, g/dL | 3.7 (2-5.8) | 508 (100) | 3.7 (2-5.2) | 187 (100) | 3.8 (2.7-5.9) | 143 (100) | 4.1 (2-5) | 61 (100) | 3.4 (1.7-7) | 197 (100) | <.001* |
| ≤3.5 | 212 (42) | 86 (46) | 53 (37) | 18 (30) | 107 (54) | .001 | |||||
| > 3.5 | 296 (58) | 101 (54) | 90 (63) | 43 (70) | 90 (46) | ||||||
| LDH, U/L | 471 (12-9540) | 602 (100) | 437 (57-12 460) | 253 (100) | 385 (61-4266) | 220 (100) | 390 (144-3557) | 63 (100) | 617 (102-13 420) | 302 (100) | <.001* |
| Cytogenetics | 876 (100) | 325 (100) | 328 (100) | 79 (100) | 544 (100) | ||||||
| Normal | 255 (29) | 93 (29) | 107 (33) | 29 (37) | 90 (17) | <.001 | |||||
| Abnormal | 422 (48) | 161 (50) | 152 (46) | 41 (52) | 192 (35) | ||||||
| No metaphases | 76 (9) | 27 (8) | 19 (6) | 2 (3) | 31 (6) | ||||||
| Not available | 123 (14) | 44 (14) | 50 (15) | 7 (9) | 231 (42) | ||||||
| MRC cytogenetic risk | 690 (100) | 256 (100) | 263 (100) | 71 (100) | 277 (100) | ||||||
| Favorable | 40 (6) | 8 (3) | 2 (1) | 0 (0) | 4 (2) | <.001 | |||||
| Intermediate | 386 (56) | 147 (57) | 150 (57) | 46 (65) | 148 (53) | ||||||
| Adverse | 264 (38) | 101 (40) | 111 (42) | 25 (35) | 125 (45) | ||||||
| FLT3-ITD | 467 (100) | 174 (100) | 118 (100) | 70 (100) | 122 (100) | ||||||
| Positive | 54 (12) | 20 (11) | 10 (8) | 10 (14) | 12 (10) | .76 | |||||
| Negative | 413 (88) | 154 (89) | 10108 (92) | 60 (85) | 110 (90) | ||||||
| NPM1 | 427 (100) | 169 (100) | 113 (100) | 67 (100) | 113 (100) | ||||||
| Positive | 85 (20) | 25 (15) | 16 (14) | 8 (12) | 11 (10) | .06 | |||||
| Negative | 342 (80) | 144 (85) | 97 (86) | 59 (88) | 102 (90) | ||||||
| Period | 876 (100) | 325 (100) | 328 (100) | 79 (100) | 544 (100) | ||||||
| 1990-1994 | 33 (4) | 7 (2) | 0 (0) | 0 (0) | 13 (2) | <.001 | |||||
| 1995-1999 | 68 (8) | 2 (1) | 0 (0) | 0 (0) | 28 (5) | ||||||
| 2000-2004 | 92 (11) | 2 (1) | 3 (1) | 0 (0) | 66 (12) | ||||||
| 2005-2009 | 168 (19) | 23 (7) | 51 (16) | 0 (0) | 164 (30) | ||||||
| 2010-2014 | 290 (33) | 171 (53) | 132 (40) | 23 (29) | 192 (35) | ||||||
| 2015-2019 | 225 (26) | 120 (37) | 142 (43) | 56 (71) | 81 (15) | ||||||
P compare continuous variables.
Disease characteristics and treatment according to type of sAML
Information related to type of sAML was available in 2000 patients; 884 (44%) had MDS-AML, 209 (10%) had MDS/MPN-AML, 226 (11%) had MPN-AML, 502 (25%) had t-AML, and 179 (9%) had neo-AML. Refractory cytopenia with excess blasts was the most frequent condition preceding MDS-AML (Figure 2A), chronic myelomonocytic leukemia for MDS/MPN-AML (Figure 2B), and essential thrombocythemia for MPN-AML (Figure 2C). Hematologic malignancies and breast cancer were the most frequent conditions preceding t-AML (Figure 2D), and 65% of patients with t-AML were previously treated with chemotherapy with or without radiotherapy (Figure 2E). Lung, prostate, and gynecologic cancer were the most frequent antecedents for patients with neo-AML (Figure 2F). The median latency period in patients with sAML was 34.1 months (range, 0.07-471.7), 71.8 months for MPN-AML (range, 2.2-360.8) , 60.4 months for t-AML (range, 1.5-451.7), 59.2 months for neo-AML (range, 0.1-392.1), 20 months for MDS/MPN-AML (range, 0.1-272.6), and 16.2 months for MDS-AML (range, 0.2-327.6) (P < .001).

Description of disorders diagnosed before AML. (A) Type of previous MDS in patients included in MDS-AML group. Patients with nonspecified and unclassifiable MDS were not included in this figure. (B) Type of previous MDS/MPN in patients included in MDS/MPN-AML group. (C) Type of previous MPN in patients included in MPN-AML group. (D) Type of previous therapy in patients included in t-AML group. (E) Type of previous neoplasm in treated patients included in t-AML group. (F) Type of previous solid neoplasm in patients with cancer antecedents without prior treatment.
Description of disorders diagnosed before AML. (A) Type of previous MDS in patients included in MDS-AML group. Patients with nonspecified and unclassifiable MDS were not included in this figure. (B) Type of previous MDS/MPN in patients included in MDS/MPN-AML group. (C) Type of previous MPN in patients included in MPN-AML group. (D) Type of previous therapy in patients included in t-AML group. (E) Type of previous neoplasm in treated patients included in t-AML group. (F) Type of previous solid neoplasm in patients with cancer antecedents without prior treatment.
Table 3 shows characteristics and treatment according to the type of sAML. Patients with neo-AML were older, and only among t-AML was female gender more frequent. Patients with MDS-AML and t-AML had better ECOG. Patients with MDS/MPN-AML had more frequent hepatosplenomegaly, French–American–British M4/M5, and higher WBC counts in PB, creatinine, uric acid, and urea serum levels. Patients with MPN-AML showed more hepatosplenomegaly and higher LDH and fibrinogen levels. t-AML and neo-AML showed higher blast percentage in BM, and more frequent favorable cytogenetics, NPM1 and FLT3-ITD mutations. An adverse cytogenetic reaction was more frequent among MPN-AML and t-AML subgroups. IC was the main therapeutic choice for patients with t-AML and neo-AML (52% and 41%, respectively), whereas patients with MDS-, MDS/MPN-, and MPN-AML were more commonly treated with non-IC or HMA.
Disease and patient characteristics according to the type of sAML (n = 2000)
| Characteristic | MDS-AML | MDS/MPN-AML | MPN-AML | t-AML | neo-AML | P value | |||||
|---|---|---|---|---|---|---|---|---|---|---|---|
| Median (range) | n (%) | Median (range) | n (%) | Median (range) | n (%) | Median (range) | n (%) | Median (range) | n (%) | ||
| Global | 884 (100) | 209 (100) | 226 (100) | 502 (100) | 179 (100) | ||||||
| Age, y | 70 (19-97) | 883 (100) | 69 (31-92) | 208 (100) | 68 (31-92) | 225 (100) | 67 (18-104) | 502 (100) | 73 (26-93) | 179 (100) | <.001* |
| Gender | 882 (100) | 209 (100) | 226 (100) | 502 (100) | 179 (100) | ||||||
| Male | 548 (62) | 148 (71) | 129 (57) | 248 (49) | 121 (68) | <.001 | |||||
| Female | 334 (38) | 61 (29) | 97 (43) | 254 (51) | 58 (32) | ||||||
| ECOG | 1 (0-4) | 670 (100) | 1 (0-4) | 165 (100) | 1 (0-4) | 188 (100) | 1 (0-4) | 435 (100) | 1 (0-4) | 169 (100) | <.001* |
| 0 | 185 (28) | 34 (21) | 39 (21) | 130 (30) | 40 (24) | <.001 | |||||
| 1 | 268 (40) | 62 (38) | 73 (39) | 178 (41) | 64 (38) | ||||||
| 2 | 139 (21) | 36 (22) | 35 (19) | 80 (18) | 44 (26) | ||||||
| 3 | 67 (10) | 25 (15) | 27 (14) | 38 (9) | 18 (11) | ||||||
| 4 | 11 (2) | 8 (5) | 14 (7) | 9 (2) | 3 (2) | ||||||
| FAB subtype | 884 (100) | 209 (100) | 226 (100) | 502 (100) | 179 (100) | ||||||
| M0/M6/M7 | 80 (9) | 4 (2) | 42 (19) | 65 (13) | 22 (12) | <.001 | |||||
| M1/M2 | 230 (26) | 18 (9) | 30 (13) | 118 (24) | 51 (28) | ||||||
| M4/M5 | 100 (11) | 79 (38) | 15 (7) | 121 (24) | 54 (30) | ||||||
| Not available | 474 (54) | 108 (52) | 139 (61) | 198 (39) | 52 (29) | ||||||
| Hepatosplenomegaly | 419 (100) | 114 (100) | 112 (100) | 290 (100) | 142 (100) | <.001 | |||||
| Yes | 77 (18) | 37 (32) | 44 (39) | 52 (18) | 24 (17) | ||||||
| No | 342 (82) | 77 (68) | 68 (61) | 238 (82) | 118 (83) | ||||||
| WBC, ×109/L | 4.4 (0.1-310.4) | 786 (100) | 23.5 (0.1-300.2) | 169 (100) | 10.8 (0.3-312) | 198 (100) | 5.1 (0.1-289) | 466 (100) | 10.7 (0.-230.7) | 173 (100) | <.001* |
| Hemoglobin, g/dL | 8.9 (3.3-17.2) | 690 (100) | 9.1 (4-15.1) | 154 (100) | 8.7 (4.7-15) | 173 (100) | 9.1 (3.2-15.2) | 452 (100) | 9.1 (4.4-14.4) | 170 (100) | .23* |
| Platelet count, ×109/L | 45 (1-1645) | 691 (100) | 55 (6-459) | 155 (100) | 74 (1-1372) | 173 (100) | 47 (2-1442) | 456 (100) | 58 (5-462) | 171 (100) | <.001* |
| BM blasts, % | 36 (2-100) | 653 (100) | 40 (1-100) | 136 (100) | 35 (0-94) | 148 (100) | 55 (0-100) | 408 (100) | 58 (10-100) | 160 (100) | <.001* |
| Creatinine, mg/dL | 0.97 (0.32-9.2) | 500 (100) | 1.07 (0.29-7.2) | 133 (100) | 0.95 (0.25-5.09) | 141 (100) | 0.9 (0.07-5.48) | 416 (100) | 0.97 (0.4-8.5) | 163 (100) | <.001* |
| Urea, mg/dL | 38 (4-192) | 456 (100) | 44 (11-255) | 121 (100) | 39 (8-242) | 126 (100) | 35 (2-243) | 391 (100) | 41 (11-267) | 146 (100) | <.001* |
| Uric acid, mg/dL | 5 (0.1-19) | 413 (100) | 6.5 (0.1-17.1) | 119 (100) | 5.8 (0-16.2) | 121 (100) | 4.9 (0-14.4) | 366 (100) | 5.3 (0-13) | 143 (100) | <.001* |
| Bilirubin, mg/dL | 0.7 (0.14-7.5) | 449 (100) | 0.75 (0.22-7) | 127 (100) | 0.67 (0.2-5.5) | 137 (100) | 0.64 (0.07-9.94) | 392 (100) | 0.62 (0.1-4.57) | 151 (100) | .06* |
| AST, U/L | 22 (7-171) | 451 (100) | 22 (6-496) | 119 (100) | 23 (8-151) | 124 (100) | 22 (5-213) | 383 (100) | 21 (8-338) | 150 (100) | .81* |
| ALT, U/L | 18 (2-272) | 461 (100) | 16 (3-515) | 121 (100) | 18 (3-160) | 131 (100) | 20 (3-623) | 395 (100) | 19 (5-328) | 152 (100) | .24* |
| AP, U/L | 78 (29-702) | 412 (100) | 82 (14-1158) | 115 (100) | 80 (26-1525) | 120 (100) | 77 (19-3571) | 354 (100) | 75 (2-3402) | 143 (100) | .41* |
| Albumin, g/dL | 3.7 (2.1-7) | 389 (100) | 3.7 (1.7-5.8) | 113 (100) | 3.7 (1.9-5.2) | 117 (100) | 3.7 (1.8-5.8) | 340 (100) | 3.7 (2.6-4.9) | 136 (100) | .95* |
| LDH, U/L | 416 (13-9168) | 571 (100) | 612 (96-11380) | 138 (100) | 768 (102-10560) | 147 (100) | 436 (12-9540) | 398 (100) | 561 (112-13420) | 149 (100) | <.001* |
| Fibrinogen, mg/dL | 423 (1-1033) | 358 (100) | 410 (1-940) | 111 (100) | 467 (3-889) | 115 (100) | 422 (3-983) | 328 (100) | 444 (2-1500) | 137 (100) | .04* |
| Cytogenetics | 884 (100) | 209 (100) | 226 (100) | 502 (100) | 179 (100) | ||||||
| Normal | 247 (28) | 61 (29) | 49 (22) | 107 (21) | 60 (34) | <.001 | |||||
| Abnormal | 361 (41) | 72 (34) | 102 (45) | 266 (53) | 74 (41) | ||||||
| No metaphases | 65 (7) | 10 (5) | 12 (5) | 45 (9) | 14 (8) | ||||||
| Not available | 211 (24) | 66 (32) | 63 (28) | 84 (17) | 31 (17) | ||||||
| MRC cytogenetic risk | 612 (100) | 134 (100) | 152 (100) | 382 (100) | 137 (100) | ||||||
| Favorable | 4 (1) | 1 (1) | 2 (1) | 31 (8) | 11 (8) | <.001 | |||||
| Intermediate | 377 (62) | 94 (70) | 64 (42) | 172 (45) | 88 (64) | ||||||
| Adverse | 231 (38) | 38 (28) | 86 (57) | 179 (47) | 38 (28) | ||||||
| FLT3-ITD | 340 (100) | 104 (100) | 86 (100) | 288 (100) | 114 (100) | ||||||
| Positive | 35 (10) | 11 (11) | 3 (3) | 26 (9) | 24 (21) | <.001 | |||||
| Negative | 305 (90) | 93 (89) | 83 (97) | 262 (91) | 90 (79) | ||||||
| NPM1 | 312 (100) | 103 (100) | 85 (100) | 265 (100) | 105 (100) | ||||||
| Positive | 34 (11) | 13 (13) | 7 (8) | 50 (19) | 28 (27) | <.001 | |||||
| Negative | 278 (89) | 90 (87) | 78 (92) | 215 (81) | 77 (73) | ||||||
| Therapeutic approach | 884 (100) | 209 (100) | 226 (100) | 502 (100) | 179 (100) | ||||||
| IC | 294 (33) | 66 (32) | 69 (31) | 261 (52) | 74 (41) | <.001 | |||||
| Non-IC | 149 (17) | 35 (17) | 25 (11) | 68 (14) | 25 (14) | ||||||
| HMA | 127 (14) | 27 (13) | 35 (15) | 51 (10) | 18 (10) | ||||||
| Clinical trial | 35 (4) | 11 (5) | 9 (4) | 14 (3) | 7 (4) | ||||||
| BSC | 234 (26) | 50 (24) | 70 (31) | 83 (17) | 44 (25) | ||||||
| Not available | 45 (5) | 20 (10) | 18 (8) | 25 (5) | 11 (6) | ||||||
The type of sAML was not available in 310 patients.
P compare continuous variables.
Response after front-line therapy in sAML
Response assessment after front-line therapy was available in 1486 (93%) patients with sAML actively treated (Figure 1). CR/CRi was achieved in 619 (41%) patients, 117 (8%) showed PR, 561 (38%) were resistant, and 189 (13%) died during induction (Table 4). CR/CRi rate was higher after IC (55%) followed by clinical trial (31%), non-IC (30%), and HMA (16%). Lower induction mortality was observed after HMA (9%). Among 619 patients who achieved a first CR/CRi, information about hematopoietic stem cell transplantation (HSCT) was available in 582: 51 (9%) received autologous HSCT (49 after IC and 2 after non-IC), 152 (26%) received an allogeneic HSCT (131 after IC, 18 after non-IC, and 3 after clinical trial), and no HSCT was performed in the remaining 379 (65%) patients.
Response and HSCT rates, OS, and EFS according to therapeutic approach in patients with sAML
| Variable | Overall | IC | Non-IC | HMA | Clinical trial | BSC | P value |
|---|---|---|---|---|---|---|---|
| Response, n (%) | 1489 (100) | 844 (100) | 303 (100) | 274 (100) | 68 (100) | ||
| ORR (CR + CRi) | 620 (41) | 467 (55) | 89 (30) | 43 (16) | 21 (31) | <.001 | |
| CR | 559 (37) | 437 (52) | 71 (23) | 33 (12) | 18 (26) | ||
| Cri | 61 (4) | 30 (4) | 18 (6) | 10 (4) | 3 (4) | ||
| PR | 118 (8) | 54 (6) | 30 (10) | 21 (8) | 13 (19) | ||
| Resistance | 562 (38) | 220 (26) | 138 (46) | 184 (67) | 20 (30) | ||
| Death | 189 (13) | 103 (12) | 46 (15) | 26 (9) | 14 (21) | ||
| HSCT in first CR/CRi, n (%)* | 584 (100) | 439 (100) | 83 (100) | 43 (100) | 19 (100) | ||
| Allogeneic HSCT rate, n (%) | 151 (26) | 130 (30) | 18 (22) | 0 (0) | 3 (16) | <.001 | |
| Autologous HSCT rate, n (%) | 51 (9) | 49 (11) | 2 (2) | 0 (0) | 0 (0) | ||
| No HSCT, n (%) | 382 (65) | 260 (59) | 63 (76) | 43 (100) | 16 (84) | ||
| OS, n (%) | 2310 (100)* | 876 (100) | 325 (100) | 328 (100) | 79 (100) | 544 (100) | |
| Median (CI 95%), mo | 5.6 (5.2-6.3) | 9.9 (8.9-11.4) | 5.5 (4.6-7.4) | 9.0 (7.6-10.6) | 7.7 (6.4-10.6) | 1.2 (1.0-1.5) | <.001 |
| 1 y (CI 95%) | 31.4 (29.3-33.4) | 44.4 (41.1-48.0) | 29.7 (24.9-35.5) | 40.3 (35.0-46.3) | 32.9 (22.8-47.5) | 6.5 (4.7-9.0) | |
| 5 y (CI 95%) | 8.2 (6.8-9.6) | 15.7 (13.0-18.9) | 6.4 (3.7-11.0) | 3.7 (1.8-7.6) | 7.1 (2.1-23.7) | NA (NA-NA) | |
| EFS, n (%) | 1394 (100) | 810 (100) | 288 (100) | 230 (100) | 66 (100) | NA | <.001 |
| Median (CI 95%), mo | 3.6 (3.2-4.0) | 4.1 (3.5-5.7) | 1.7 (1.5-2.1) | 4.8 (4.0-6.0) | 3.3 (1.9-5.9) | NA | |
| 1 y (CI 95%) | 22.2 (20.0-24.5) | 28.3 (25.3-31.7) | 13.7 (10.2-18.4) | 23.0 (18.2-29.2) | 10.3 (4.7-22.6) | NA | |
| 5 y (CI 95%) | 8.4 (6.8-10.0) | 11.3 (9.1-14.1) | 6.0 (3.6-9.7) | 2.5 (1.0-6.1) | 6.2 (2.1-17.9) | NA |
NA, not applicable; ORR, overall response rate;
Data from patients in CR/CRi after front-line therapy. Global OS results includes all patients with sAML (2310 patients), but in 162 patients the therapeutic approach was not available. Including only patients with therapeutic approach available (2148 patients), the median OS was 8.9 mo (8.0-9.6), 1 y OS was 40% (38-43), and 5 y OS was 11% (9-13).
CR/CRi rate after IC was superior among patients with t-AML and neo-AML (64% and 63%, respectively), as compared with MDS- MDS/MPN- and MPN-AML (52%, 44%, and 45%, respectively) (P < .001). Response after other therapies and HSCT rates were similar among all sAML subgroups (supplemental Table 2).
Multivariate analyses for complete remission
When all patients receiving IC were included (de novo and sAML) in a multinomial logistic regression, sAML (P < .001), age (P < .001), ECOG (P < .001), WBC count (P < .001), and creatinine level >1.2 mg/dL (P = .003) were independent adverse prognostic factors for CR/Cri, whereas presence of NPM1 mutation and favorable and intermediate cytogenetic risk were independent favorable prognostic factors for CR/CRi (all P < .001).
Among patients with sAML, age (P < .001), ECOG (P = .004), WBC count (P = .002), and bilirubin level >1.2 mg/dL (P = .03) were independent prognostic factors for CR/CRi. NPM1 mutation (P < .001), favorable and intermediate cytogenetic risk (both P < .001), t-AML (P < .001), and neo-AML (P = .01) were independent favorable prognostic factors for CR/CRi.
OS
The median OS of the 8521 patients included in the study was 9.1 months (95% CI, 8.7-9.6). Median OS was higher in patients with de novo than sAML (10.9 [95% CI, 10.3-11.5] vs 5.6 months [95% CI, 5.2-6.3], respectively; P < .001), with 1- and 5-year OS of 47.8% (95% CI, 46.5-49.1) vs 31.4% (95% CI, 29.3-33.4), and 23.4% (95% CI, 22.2-24.7) vs 8.3% (95% CI, 6.7-9.7), respectively (P < .001) (Figure 3A).
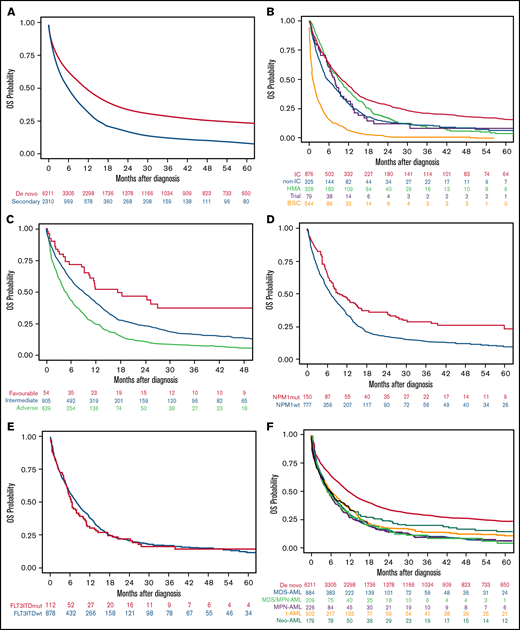
OS of the AML patients included in the study according to different disease characteristics or therapeutic approach. (A) OS in the entire cohort of 8521 patients with AML according to type of AML (P < .001). (B) OS in secondary AML according to therapeutic approach (P < .001). (C) OS in secondary AML according to cytogenetic risk (P < .001). (D) OS in secondary AML according to NPM1 mutation (P < .001). (E) OS in secondary AML according to FLT3-ITD mutation (P = .45). (F) OS in secondary AML according to the different subgroups (P = .04).
OS of the AML patients included in the study according to different disease characteristics or therapeutic approach. (A) OS in the entire cohort of 8521 patients with AML according to type of AML (P < .001). (B) OS in secondary AML according to therapeutic approach (P < .001). (C) OS in secondary AML according to cytogenetic risk (P < .001). (D) OS in secondary AML according to NPM1 mutation (P < .001). (E) OS in secondary AML according to FLT3-ITD mutation (P = .45). (F) OS in secondary AML according to the different subgroups (P = .04).
Patients with sAML who received IC or HMA had better median OS than others (9.9 and 9.0 months, respectively), but the 5-year OS was better among the IC group (15.7%) (Figure 3B; Table 4). Favorable cytogenetic risk (Figure 3C) and NPM1 mutations (Figure 3D) were associated with prolonged OS, whereas FLT3-ITD mutations did not affect OS (Figure 3E). OS was significantly lower in patients with sAML after hematologic disorders (together MDS-AML, MDS/MPN-AML, and MPN-AML) as compared with t-AML and neo-AML (median OS 5.3 [95% CI, 5.0-6.1] vs 6.1 [95% CI, 5.1-7.8] vs 5.7 [95% CI, 4.1-7.8] months, respectively; P = .04) (Figure 3F). Other risk factors for OS were identified in univariate analyses (ie, age, ECOG, WBC count, or alkaline phosphatase) (supplemental Table 3).
Patients who achieved CR/CRi had higher median OS as compared with patients with PR or resistance (19.5 [95% CI, 16.7-23.8], 15.5 [95% CI, 14.6-18.9], 10.8 [95% CI, 7.7-13.3], and 5.8 [95% CI, 5.3-6.5] months, respectively; P < .001). Patients in first CR/CRi allocated to allogeneic HSCT had longer median OS than those assigned to autologous therapy or chemotherapy exclusively (44.9 [95% CI, 30.2-NA] vs 31.5 [95% CI, 23.1-59.8] vs 14.9 [13.7-16.9] months, respectively; P < .001) (supplemental Figure 1A-B).
After IC front-line, median OS was significantly better among patients with neo-AML as compared with other sAML (supplemental Table 4), but no differences were observed between neo-AML and de novo AML (14.6 [95% CI, 10.3-42.4] vs 17.2 [95% CI, 16.0-18.6], respectively; P = .63) (supplemental Figure 2A). No differences were observed among patients treated with HMA (supplemental Figure 2B) or non-IC according to the type of sAML although patients with nonsignificant, neo-AML aged <60 years and those with intermediate cytogenetics had better 5-year OS compared with other sAML subsets (supplemental Table 4).
Among 666 patients with MDS-AML, MDS/MPN-AML, and MPN-AML with available information of prior HMAs exposure, OS was significantly lower among those treated with HMAs before AML transformation (P < .001) (supplemental Figure 3A). We also explored the prognosis of 101 patients with t-AML who received only prior radiotherapy as compared with other sAML types and de novo AML (supplemental Figure 3B). After including this new category in the multivariate analysis, prior administration of radiotherapy exclusively was not an independent prognostic factor: hazard ratio (HR) was 1.06 (95% CI, 0.84-1.35; P = .61).
Multivariate analyses for OS
Among patients with sAML with an age between 30 and 59 years, neo-AML, platelet count >20 × 109/L, albumin >3.5 g/dL, favorable and intermediate cytogenetic risk, and NPM1 mutation had a positive impact on OS. ECOG ≥2, WBC count ≥10 × 109/L, blast cells in BM >70%, creatinine >1.3 mg/dL, and alkaline phosphatase >150 U/L were independent adverse prognostic factors for OS (supplemental Table 5).
When all patients were included (de novo and sAML) in a multivariate Cox regression, sAML was an independent adverse prognostic factor for OS (P = .01; HR 1.08 [95% CI, 1.02-1.15]). Because neo-AML had different prognosis than other sAML types, we performed a multivariate analysis, including neo-AML in the de novo AML category, showing that sAML (without neo-AML) was a significant predictor for OS (P = .008; HR 1.09 [95% CI, 1.02-1.16]). Other independent prognostic factors are detailed in supplemental Table 6. We analyzed the effect of cytogenetics with type of AML interaction, showing that in all MRC risk subgroups, the presence of sAML was accompanied by lower OS (supplemental Figure 4A).
We also analyzed the trend in OS across the study period, showing that OS improved gradually (90s vs 00s vs 10s decade) among patients with de novo AML, but such improvement was not observed among patients with sAML (supplementary Figure 4B).
EFS
The median EFS of 1394 evaluable patients with sAML was 3.6 months (95% CI, 3.2-4.0), with 1- and 5-year EFS of 22.2% (95% CI, 20.0-24.5) and 8.4% (95% CI, 6.8-10.0), respectively (supplemental Figure 5A). Higher median EFS was observed after IC, HMA, and clinical trials compared with non-IC regimens (4.1 months [95% CI, 3.5-5.7], 4.8 months [95% CI, 4.0-6.0], 3.3 months [95% CI, 1.9-5.9], and 1.7 months [95% CI, 1.5-2.1] respectively; P < .001) (supplemental Figure 5B).
Discussion
In this study we reported the largest cohort of patients with sAML to date and dissected their characteristics, treatment patterns, and main outcomes. We showed in a real-life setting that sAML represents roughly 25% of all AML cases, with worse prognosis and different baseline characteristics and patterns of care as compared with de novo AML (especially for those arising after MDS, MDS/MPN, and MPN). Nevertheless, we highlighted that patients with neo-AML have similar outcomes and biology than patients with de novo AML. It should be noted that therapeutic results were equally poor for unfit patients with de novo and sAML; thus, the adverse prognostic impact of sAML is mainly applicable to the eligible for IC setting.
In our registry, 27.1% of patients with AML were classified as sAML, which is superior to a median prevalence of 22.0% (range: 5.7% to 42.1%) previously reported.3-5,10,15-27 However, we have also considered as sAML those patients with AML following prior neoplasia without exposure to leukemogenic agents (namely neo-AML, 2.1%), which is uncommon in prior series.16 Regarding well-recognizedsAML subsets, our frequencies are in line with prior studies showing 13.1% (range: 5.7% to 26.5%) MDS-AML, 7.1% (range:1.6% to 8.3%) MPN-AML, and 6.2% (range: 1.9% to 13.7%) t-AML.3,4,15-31 As expected, we observed shorter median latency in MDS- and MDS/MPN-AML (<2 years),4 whereas leukemic transformation occurred over a 5-year period in t-AML4,25 and even longer in MPN-AML.32 The latency period could depend on the cumulative dose, dose intensity, and type of preceding chemotherapy and/or radiation therapy,33,34 but those factors were not analyzed here.
We confirm that sAML is closely associated with older age, comorbidities (ie, renal and liver dysfunction), worse performance status, and unfavorable genetic features.4,7-9 We also show that male gender was more predominant among patients with sAML compared with de novo AML. The exception was t-AML, as previously reported,25 in which breast cancer history was present in 25%. Surprisingly, 28% of t-AML cases evolved from prior hematological malignancies (eg, lymphoma), highlighting an increased risk of developing sAML in this setting. Another interesting finding was that patients with MDS- and t-AML had less WBC and BM blasts at diagnosis because they are usually less proliferative and can show signs and symptoms of hematopoietic insufficiency due to prior antineoplastic therapies.35 On the contrary, MPN- and MDS/MPN-AML showed signs and symptoms related to the previous disorder, such as increased WBC, M4/M5 morphology, hepatomegaly, and splenomegaly.36 We found that low-risk karyotype was uncommon, especially for MDS-, MDS/MPN-, and MPN-AML,4 whereas high-risk karyotype was frequent, especially in t-AML4,24 and MPN-AML. Regarding molecular findings, we could only analyze NPM1 and FLT3-ITD mutations, confirming previous studies showing that these lesions are less prevalent among sAMLs.37-39 Interestingly, although neo-AML and t-AML shared 8% core-binding factor (CBF) rearrangements, only neo-AML cases showed a prevalence for NPM1 and FLT3-ITD comparable to de novo AML, supporting that they should not be considered sAML.
The optimal treatment options for patients with sAML are not yet established. This quandary comes from the lack of studies in this subset of patients because they are generally excluded from trials and protocols.22,40 As expected, this study shows that few patients with sAML received up-front IC regimens (38%) compared with de novo (60%),3-5,16,21,24,27,28 curative approaches being the preferred option only in a subset of favorable risk sAML subjects (ie, younger, CBF, and NPM1). Only 8 sAML registry studies provided data regarding CR/CRi after IC,3-5,17,22,24,27 obtaining a median of 50.7% (range: 21% to 63%), slightly lower than in our series (55%). As in other series, we found better CR/CRi rates among patients with t-AML (63%) followed by MDS-AML (52%), and the worst rates were obtained among patients with MDS/MPN- and MPN-AML.3,4,41 Of note, 3 + 7 and FLAG-Ida regimens were administered in most IC patients in our historical sAML cohort, whereas only 6 patients received CPX-351. Our CR/CRi rate after IC was >48% in the CPX-351 and 33% in the 3 + 7 arm of a recently published phase 3 study.42 However, we should avoid comparisons because this clinical trial included patients ≥65 years and excluded those with MPN-AML. Scarce studies have analyzed the CR/CRi rates after HMA in sAML, showing 12% to 36% CR/CRi, in line with 16% herein reported.43,44 Interestingly, we show 30% CR/CRi after non-IC for unfit patients (ie, FLUGA regimen or similar), but this was not accompanied by improved survival compared with HMA.45
We reproduced significantly poorer median OS in sAML (5.6 months) as compared with de novo AML (10.9 months).3-5,16,19,21,24 -28 We can affirm that median OS in different studies is affected by the proportion of IC-treated patients in each series. As an example, two registries reported a median OS of 7 and 8.6 months,17,27 with percentage of IC treatment of 56% and 57%, respectively, whereas median OS was 5.8 months in a study with only 28% IC24 (similar to our registry, in which 38% received IC). We confirmed that HMA could lead to comparable median OS than IC strategies, but long-term survival might be improved after IC approaches.44 We hypothesized that sAML patients achieving a CR/CRi should be considered for allogeneic HSCT to prolong survival, but few data have been published comparing patients with or without HSCT after induction therapy in this setting.41 The population-based study in sAML by Nilsson et al reported improved 5-year OS after allogeneic HSCT (18% to 32%) compared with non-HSCT (2% to 10%). Here we show improved median OS in patients undergoing allogeneic or autologous HSCT in first CR/CRi (45 and 31 months, respectively) compared with 65% who did not receive transplant (15 months). We should cautiously interpret these findings, acknowledging the inherent selection bias and the fact that analyses were not time dependent.
The dilemma about considering sAML an independent prognostic factor remains unsolved because published manuscripts revealed discrepant results.5,21,22,46 In this large study, we showed that sAML is an independent risk factor. Nevertheless, in line with a German cohort of patients with t-MN,21 significantly worse OS was observed only among patients receiving IC strategies, as compared with de novo AML, whereas therapeutic outcomes were as bad among all unfit patients. Some studies have shown a different prognosis depending on the type of sAML; patients with MPN who develop a leukemic transformation could have dismal outcomes.43,47 The population-based study by Hulegardh et al reported 1-year OS of 10% in MPN-AML, 20% in t-AML, and 43% in MDS-AML.3 However, in our cohort, we observed lower OS among patients with MDS/MPN-, MDS-, and MPN-AML compared with t-AML. As previously published, patients with sAML with CBF had a longer OS than those with intermediate and adverse genetic risks.48 However, the prognostic impact of some well-established gene mutations in sAML remains unclear (eg, FLT3 and NPM1). Our study supports the favorable OS impact of NPM1 suggested by Stölzel et al,49 but we were unable to demonstrate any prognostic role of FLT3-ITD mutations in sAML. Our multivariable model confirmed previous risk factors for OS in sAML as age, ECOG, adverse cytogenetic risk, and lower platelet count,10,16,21,22,24,49-52 but we also found new independent variables such as higher WBC count and BM blast percentage, low albumin levels, creatinine >1.3 mg/dL, and increased alkaline phosphatase. We were not able to confirm an independent favorable risk of patients with t-AML who received only prior radiotherapy, as suggested by Nardi et al.53
Our study has some limitations: (1) This is a real-life analysis, but our registry was not capturing, by far, most patients with AML in Spain and Portugal. (2) Molecular data (eg, P53 and IDH) were not analyzed. (3) The study period started in 1990, but most cases of sAML were included after 2010 (Table 2). (4) For some variables, the proportion of missing data precluded granular analyses (eg, impact of cumulative doses of cytotoxic agents).
In conclusion, this large study confirms that the frequency of adverse features, such as older age, worse performance status, and adverse karyotype, is by far higher in sAML than in de novo AML. In addition, sAML itself should be considered an independent risk factor, especially for patients treated with IC approaches. Although the best therapeutic results are obtained after IC followed by an allogeneic HSCT, this strategy is only accomplished in a minority of patients. Given the challenging condition that they represent, obtaining improvements in sAML should be a priority, warranting that this field become an active area of basic and clinical research in the forthcoming years.
Acknowledgments
The authors would like to thank María D. García, Carlos Pastorini, Mar Benlloch, and Alba Blázquez for data collection and management.
This study was supported in part by the Jazz Pharmaceuticals and Cooperative Research Thematic Network (RTICC) grant RD12/0036/014 (ISCIII and ERDF).
Authorship
Contribution: D.M.-C. and P.M. conceived the study; D.M.-C., J.E.M.-V., and P.M. analyzed and interpreted the data and wrote the paper; D.M.-C. and P.M. performed the statistical analyses; D.M.-C., J.E.M.-V., J.S., P.M.-S., E.R.-A., C.G., E.A., J.B., J.L.L.-L., T.B., A.E., M.C., C.R.-M., M.L.-P., M.T., L.A., M.L.A., M.J.S., J.L., J.I.R.-G., C.B., L.C.-B., R.G.-B., E.L.-R., S.V., P.H., D.G.-B., M.M.H., G.V.E., M.I.G.-R., A.C., G.B., A.B., J.M., B.B., M.A.S., and P.M. included data of patients treated in their institutions, reviewed the manuscript, and contributed to the final draft.
Conflict-of-interest disclosure: The authors declare no competing financial interests.
A complete list of the institutions and clinicians participating in the PETHEMA epidemiologic registry of acute myeloid leukemia and acute promyelocytic leukemia appears in “Appendix.”
Correspondence: Pau Montesinos, Hematology Department, Hospital Universitari i Politècnic La Fe, Avinguda Fernando Abril Martorell 106, CP 46026 Valencia, Spain; e-mail: montesinos_pau@gva.es.
Appendix
PETHEMA GROUP
Institutions and clinicians participating in the PETHEMA epidemiologic registry of acute myeloid leukemia and acute promyelocytic leukemia.
Argentina (Grupo Argentino para el Tratamiento de la Leucemia Aguda [GATLA])—Hospital de Clínicas, Buenos Aires: F. Rojas; H. Longoni; Fundaleu, Buenos Aires: G. Milone, I. Fernández, Clínica Conciencia, Neuquén: R. Ramirez; Hospital Rossi, La Plata: C. Canepa, S. Saba, G. Balladares, Hospital General San Martin, Parana: G. Milone, C. Ventiurini, R. Mariano, P. Negri; Hospital Italiano de La Plata, La Plata: M.V. Prates, J. Milone; Hospital General San Martín, La Plata: P. Fazio, M. Gelemur; Hospital Clemente Alvarez, Rosario: G. Milone, S. Ciarlo, F. Bezares; Hospital de Córdoba, Córdoba: L. López, Hospital Privado de Córdoba, Córdoba: J.J. García; Instituto Privado Hematología, Paraná: P. Negri, M. Giunta, G. Milone; Hospital Teodoro Alvarez, Buenos Aires: M. Kruss; Hospital Tornú, Buenos Aires: D. Lafalse, G. Milone; Hospital Gobernador Centeno, La Pampa: E. Marquesoni, M.F. Casale; Hospital Italiano de Buenos Aires, Buenos Aires: A. Gimenez, E.B. Brulc, M.A. Perusini; Complejo Médico Policía Federal, La Plata: G. Milone, L. Palmer; Colombia (Asociación Colombian de Hematología y Oncología [ACHO])—Clínica La Estancia, Popayán: M.E. Correa; Fundación Valle del Lili, Cauca: F.J. Jaramillo, J. Rosales; Instituto FOSCAL, Bucaramanga: C. Sossa, J.C. Herrera; Hospital Pablo Tobón Uribe, Antioquia: M. Arango; Poland (Polish Adult Leukemia Group [PALG])—City Hospital Legnica, Baja Silesia: J. Holojda; IHIT Hematology and Transfusiology Institute, Warszawa: A. Golos, A. Ejduk; Wojewódzki Szpital Specjalistyczny w Olsztynie, Olsztyn: B. Ochrem; WIM (Military Institute of Medicine in Warsaw), Warszawa: G. Małgorzata; Poland Medical University of Warsaw Banacha, Warszawa: A. Waszczuk-Gajda, J. Drozd-Sokolowska, M. Czemerska, M. Paluszewska; Medical University School Gdansk, Gdansk: E. Zarzycka; Wojewódzki Szpital Specjalistyczny im. Św. Jadwigi Śląskiej, Opole: A. Masternak; Hospital Brzozow, Brzozow: Dr. Hawrylecka; Medical University Lublin, Lublin: M. Podhoreka, K. Giannopoulos, T. Gromek; Medical University Bialystok, Bialystok: J. Oleksiuk; Silesian Medical University Katowice, Katowice: BA. Armatys, G. Helbig; Universitary Hospital Wroclaw, Wroclaw: M. Sobas; Poznan University of Medical Sciences, Pozna: A. Szczepaniak; Rydigier City Hospital Krakow, Krakow: E. Rzenno, M. Rodzaj; Collegium Medicum Jagiellonian University Krakow, Krakow: B. Piatkowska-Jakubas; City Hospital Rzeszów, Rzeszów: A. Skret; Medical University Lodz, Lodz: A. Pluta, M. Czemerska; Center of Oncology Kielce, Kielce: E. Barańska; Medical University of Warsaw, Warsaw: M. Paluszewska; Portugal—Hospital de Santa Maria-Lisboa, Lisboa: G. Vasconcelos, J. Brioso; IPOFG Lisboa, Lisboa: A. Nunes, I. Bogalho; Centro Hospitalar e Universitário de Coimbra, Coimbra: A. Espadana, M. Coucelo, S. Marini, J. Azevedo, A.I. Crisostomo, L. Ribeiro, V. Pereira; Centro Hospitalar de Lisboa Central E.P.E., Lisboa: A. Botelho; Instituto Português Oncologia do Porto Francisco Gentil, Porto: J.M. Mariz; Centro Hospitalar São João, Porto: J.E. Guimaraes, E. Aguiar; Centro Hospitalar do Porto E.P.E., Porto: J. Coutinho; Spain (Programa Español de Tratamiento de las Hemopatías Malignas [PETHEMA])—Complejo Hospitalario Universitario A Coruña, A Coruña: V. Noriega, L. García, C. Varela, G. Debén, M. R. González; Hospital Clínico Universitario de Santiago, A Coruña: M. Encinas, A. Bendaña, S. González, J.L. Bello, M. Albors; Hospital General de Albacete, Albacete: L. Algarra, J.R. Romero, J.S. Bermon, M.J. Varo; Hospital Vinalopó, Alicante: V. López, E. López; Hospital Virgen de los Lirios, Alcoy: C. Mora, C. Amorós; Hospital General Elche, Alicante: E. López, A. Romero; Hospital Torrevieja Salud, Alicante: A. Jaramillo, N. Valdez, I. Molina, A. Fernández, B. Sánchez; Hospital de la Marina Baixa Villajoyosa, Alicante: A. García; Hospital General de Elda, Alicante: V. Castaño, T. López, J. Bernabeu; Hospital de Denia-Marina Salud, Alicante: M.J. Sánchez; Hospital de la Vega Baja de Orihuela, Alicante: C. Fernández; Hospital General de Alicante, Alicante: C. Gil, C. Botella, P. Fernández, M. Pacheco, F. Tarín; J.J. Verdú; Complejo Hospitalario Torrecardenas, Almeria: M.J. García, A. Mellado, M.C. García, J. González; Hospital Central de Asturias, Asturias: T. Castillo, E. Colado, S. Alonso; Complejo Asistencial Ávila, Ávila: I. Recio, M. Cabezudo, J. Davila, M.J. Rodríguez, A. Barez, B. Díaz; Hospital Don Benito-Villanueva, Badajoz: J. Prieto; Institut Catala d'Oncologia ĹHospitalet, Barcelona: M. Arnan, C. Marín, M. Mansilla; Hospital de Cruces, Bizkaia: A. Balaberdi, M.E. Amutio, R.A. del Orbe, I. Ancin, J.C. Ruíz; Hospital Galdakao-Usansolo, Bizkaia: M. Olivalres, C. Gómez, I. González, M. Celis, K. Atutxa, T. Carrascosa, T. Artola, M. Lizuain; Basurtuko Ospitalea, Bizkaia: J.I. Rodriguez, O. Arce, J.A. Márquez, J. Atuch, F. Marco de Lucas, Z. Díez, B. Dávila; Hospital Santos Reyes, Burgos: R. Cantalejo, M. Díaz; Hospital Universitario de Burgos, Burgos: J. Labrador, F. Serra, G. Hermida, F.J. Díaz, P. de Vicente, R. Álvarez: Hospital Santiago Apóstol, Burgos: C. Alonso, Hospital San Pedro de Alcántara, Cáceres: J.M. Bergua; Hospital Campo Arañuelo, Cáceres: N. Ugalde; Hospital Virgen del Puerto, Cáceres: E. Pardal; Hospital General Jerez de la Frontera, Cádiz: R. Saldaña, F. Rodríguez, E. Martín, L. Hermosín; Hospital Universitario Puerta del Mar, Cádiz: M.P. Garrastazul, I. Marchante, J.A. Raposo, F.J. Capote; Hospital U. Marqués de Valdecilla, Cantabria: M. Colorado, A. Batlle, L. Yañez, S. García, P. González, E.M. Ocio, M. Briz, A. Bermúdez, S. García; Consorcio Hospitalario Provincial de Castellón, Castellón: C. Jiménez, S. Beltrán; Hospital de Vinaroz: M. Montagud; Hospital Universitario de La Plana, Castellón: I. Castillo; Hospital General de Castellón, Castellon: R. García, A. Gascón, J. Clavel, A. Lancharro, L. Lnares; Hospital Santa Bárbara, Ciudad Real: M.M. Herráez, A. Milena; Hospital Virgen de Altagracia, Ciudad Real: M.J. Romero, Hospital General de Ciudad Real, Ciudad Real: B. Hernández, C. Calle, R. Benegas; Hospital Gutierrez Ortega de Valdepeñas, Ciudad Real: Dr. Bolívar; Hospital General La Mancha Centro, Ciudad Real: M.A. Pozas; Hospital Reina Sofia, Córdoba: J. Serrano, F.J. Dorado, J. Sánchez, M.C. Martínez; Hospital Virgen de la Luz, Cuenca: C.J. Cerveró, M.J. Busto; Hospitales HUVN-HC San Cecilio de Ganada, Granada: M. Bernal, E. López, L. Moratalla, Z. Mesa, M. Jurado, A. Romero, P. González; Complejo Hospitalario Universitario Granada, Granada: L. Moratalla, A. Romero, L. López; Hospital Universitario de Guadalajara, Guadalajara: M. Díaz, D. De Miguel, A.B. Santos, J. Arbeteta; Hospital Donostia, Donosti: E. Pérez, N. Caminos, N. Uresandi, N. Argoitiaituart, T. Artola, J. Swen, A. Uranga, I. Olazaba, M. Lizuain, E. Gainza, P. Romero; Hospital Juan Ramón Jimenez Huelva, Huelva: E. Gil, A.J. Palma, K.G. Gómez, M. Solé, J.N. Rodríguez; Hospital San Jorge, Huesca: I.M. Murillo, J. Marco, J. Serena, V. Marco; Hospital de Barbastro, Huesca: M. Perella, L. Costilla; Hospital General Ciudad de Jaen, Jaén: J.A. López, A. Baena, P. Almagro; Hospital San Pedro de Logroño, La Rioja: M. Hermosilla, A. Esteban, B.A. Campeny, M.J. Nájera, P. Herrra; Hospital Insular de Las Palmas, Las Palmas: R. Fernández, J.D. González, L. Torres; Hospital Dr. Negrín, Las Palmas: S. Jiménez; M.T. Gómez, C. Bilbao, C. Rodríguez; Hospital Doctor José Molina Orosa, Las Palmas: A. Hong, Y. Ramos de Laón, V. Afonso; Hospital Universitario de León, León: F. Ramos, M. Fuertes; Hospital Comarcal del Bierzo, León: E. de Cabo, C. Aguilera, M. Megido; Hospital Universitari Arnau de Vilanova de Lleida, Leida: T. García; Hospital Lucus Augusti, Lugo: E. Lavilla, M. Varela, S. Ferrero, M.J. Sánchez, L. López, J. Arias, L. Vizcaya; Hospital Infanta Sofía, Madrid: A. Roldán, A. Vilches, M.J. Penalva, J. Vázquez; Hospital Central de la Defensa Gómez Ulla, Madrid: M.T. Calderón, A. Matilla, C. Serí, M.J. Otero, N. García, E. Sandoval; Hospital de Fuenlabrada, Madrid: C. Franco, R. Flores, P. Bravo, A. López; Hospital Fundación Jiménez Díaz, Madrid: J.L. López, C. Blas, A. Díez, J.M. Alonso, C. Soto, A. Arenas; Hospital U. Príncipe de Asturias, Madrid: J. García, Y. Martín, P.S. Villafuerte, E. Magro; Hospital Puerta de Hierro, Madrid: G. Bautista; A. De Laiglesia; Hospital Gregorio Marañón, Madrid: G. Rodríguez, L. Solán, M. Chicano, P. Balsalobre, S. Monsalvo, P. Font, D. Carbonell, C. Martínez; Hospital U. La Paz, Madrid: K. Humala, A.E. Kerguelen, D. Hernández, M. Gasior, P. Gómez, I. Sánchez; Hospital Madrid Norte Sanchinarro, Madrid: S. Redondo, L. Llorente, M. Bengochea, J. Pérez; Hospital Sanitas Torrejón, Madrid: A. Sebrango, M. Santero, A. Morales; Hospital La Princesa, Madrid: A. Figuera, P. Villafuerte, A. Alegre, E. Fernández; Hospital Ruber Internacional, Madrid: A. Alonso; Hospital 12 de Octubre, Madrid: M.P. Martínez, J. Martínez, M. T. Cedena, L. Moreno; MD Anderson Cancer Center, Madrid: A. De la Fuente; Hospital Sanitas La Zarzuela, Madrid: D. García; Hospital Universitario Quiron, Madrid: C. Chamorro, V. Pradillo, E. Martí, J. M. Sánchez, I. Delgado, A. Alonso; Hospital Rey Juan Carlos, Madrid: B. Rosado, A. Velasco, C. Miranda, G. Salvatierra, J.M. Alonso, J.L. López; Hospital Infanta Leonor, Madrid: M. Foncillas, J.A. Hernández; Hospital Universitario de Getafe, Madrid: C. Escolano, L. García, I. Delgado; Hospital Clínico San Carlos, Madrid: C. Benabente, R. Martínez, M. Polo, E. Anguita; Hospital Universitario Severo Ochoa, Madrid: R. Riaza, G. Amores, M.J. Requena; Hospital Universitario Fundación Alcorcón, Madrid: F. Javier, L. Villaloón; Hospital Universitario Moncloa, Madrid: C. Aláez, V. Pradillo, S. Nistal, B. Navas; Hospital Universitario de Móstoles, Madrid: J. Sánchez, M.A. Andreu; Hospital Ramon y Cajal, Madrid: P. Herrera, J. López; Hospital U. Virgen de la Victoria, Málaga: M. García, M.J. Moreno, A. Fernández, M.P. Queipo; Hospital Quirónsalud Málaga, Málaga: A. Hernández; Hospital Regional de Málaga, Málaga: M. Barrios, A. Heiniger, A. Jiménez, A. Contento, F. López, M. Alcalá; Hospital Vithas Xanit Internacional, Málaga: S. Lorente, M. González, E.M. Morales, J. Gutierrez; Hospital Virgen del Castillo, Murcia: M.J. Serna, V. Beltrán; Hospital Santa Lucía de Cartagena, Murcia: M. Romera, M. Berenguer, A. Martínez, A. Tejedor; Hospital Morales Meseguer, Murcia: M. L. Amigo, F. Ortuño, L. García, A. Jerez, O. López; Hospital U. Virgen de la Arrixaca, Murcia: J.M. Moraleda, P. Rosique, J. Gómez, M.C. Garay; Hospital Los Arcos Mar Menor, Murcia: P. Cerezuela, C. Martínez, A.B. Martínez, A. González; Hospital STa Ma del Rosell, Murcia: J. Ibáñez; Clínica San Miguel, Navarra: M.J. Alfaro; Complejo Hospitalario de Navarra, Navarra: M. Mateos, M.A. Goñi, M.A. Araiz, A. Gorosquieta, M. Zudaire, M. Viguria, A. Zabala, M. Alvarellos, I. Quispe, M.P. Sánchez, G. Hurtado, M. Pérez, Y. Burguete, N. Areizaga, T. Galicia; Clínica Universitaria de Navarra, Navarra: J. Rifón, A. Alfonso, F. Prósper, M. Marcos, L.E. Tamariz, V. Riego. A. Manubens, M.J. Larrayoz, M.J. Calasanz, A. Mañú, B. Paiva, I. Vázquez, L. Burgos; Complejo Hospitalario de Ourense (CHOU), Ourense: M. Pereiro, M. Rodríguez, M.C. Pastoriza, J.A. Mendez, J.L. Sastre, M. Iglesias, C. Ulibarrena, F. Campoy; Hospital Valdeorras, Ourense: D. Jaimes; Hospital Rio Carrión, Palencia: J. M. Alonso, B. Albarrán, J. Solano, A. Silvestre; Complexo Hospitalario Universitario de Vigo, Vigo: C. Albo, S. Suarez, C. Loureiro, I. Figueroa, M. Rodríguez, M.A. Fernández, A. Martínez, C. Poderós, J. Vazquez, L. Iglesias, A. Nieto, T. Torrado, A.M. Martínez; Hospital Provincial de Pontevedra, Pontevedra: M.L. Amador, P. Oubiña, E. Feijó, A. Dios, I. Loyola, R. Roreno; Hospital POVISA, Pontevedra: A. Simiele, L. Álvarez, V. Turcu; Hospital U. Salamanca, Salamanca: B. Vidriales, M. González, R. García, A. Avendaño, C. Chillón, E. Pérez, V. González; Hospital General La Palma, Santa Cruz de Tenerife: J.V. Govantes, S. Rubio, M. Tapia; Hospital General de Segovia, Segovia: C. Olivier, J.A. Queizán; Hospital U. Virgen Macarena, Sevilla: O. Pérez, J.A. Vera, C. Muñoz, A. Rodriguez, N. González; Hospital U. Virgen del Rocio, Sevilla: J.A. Pérez, E. Soria, I. Espigado, J. Falantes, I. Montero, P. García, E. Rodríguez, E. Carrillo, T. Caballero, C. García; Hospital Virgen de Valme, Sevilla: C. Couto, I. Simón, M. Gómez; Hospital Virgen del Mirón de Soria, Soria: C. Aguilar; Hospital Universitario Canarias, Tenerife: B.J. González, S. Lakhwani, A. Bienert, B. González; Hospital Universitario Nuestra Señora de Candelaria, Tenrife: A. Cabello, A.Y. Oliva, H. González; Hospital Obispo Polanco, Teruel: N. González, Hospital de Alcañiz, Teruel: L. Sancho, M. Paricio, L. Perdiguer; Hospital General Nuestra Señora del Prado, Toledo: F. Solano, A. Lerma, M.D. Martínez; Hospital Virgen de la Salud de Toledo, Toledo: M.I. Gómez, A. Yeguas; Hospital U. La Fe, Valencia: P. Montesinos, E. Barragán, C. Sargas, R. Amigo, D. Martinez, B. Boluda, R. Rodríguez, E. Acuña, I. Cano; Hospital de Requena, Valencia: A. Escrivá, M. Pedreño; Hospital de Lluis Alcanyis de Xativa, Valencia: R. Renart; IVO (Instituto Valenciano de Oncología), Valencia: A. Navalón; Hospital de Sagunto, Valencia: I. Castillo, M. Orts; Hospital Dr. Peset, Valencia: M.J. Sayas, M.J. Fernández, M.L. Juan, E. Gómez, M. Gimeno, E. Donato, M. Cejalvo, J. Marco; Hospital Clínico Universitario, Valencia: M. Tormo, M. Calabuig, B. Navarro, I. Martin, E. Villamont, A. Miralles; Hospital de La Ribera, Valencia: R. Lluch; Hospital Casa de la Salud, Valencia: J. García; Hospital de Gandía, Valencia: M. Moragues, M.A. Ruiz; Hospital Arnau de Vilanova, Valencia: A. López, C. Benet, M. Valero; Hospital General de Valencia, Valencia: M. Linares, R. Collado, M. Orero, P. Ibañez, M.J. Lis, P.L. Pérez, M. Roig, M. López, A.V. Mena; Hospital Manises, Valencia: I. Picón, V. Cánovas, A. Palacios, E. Martí; Hospital Clínico de Valladolid, Valladolid: R. Cuello, J. Borrego, M. Burgois; Hospital Rio Hortega, Valladolid: A. Cantalapiedra, O. Norberto, E. Angomas, B. Cidoncha; Hospital Universitario Araba, Victoria: L. Cuevas, D. Robles, A. Mendiazabal, I. Oiartzabal, J.M. Guinea de Castro; Hospital Virgen de la Concha, Zamora: C. Montes, M. Pérez, L. García; Hospital Royo Villanova, Zaragoza: V. Carrasco, A. Pérez, L. López, J.J. Moneva; Hospital Clínico U. Lozano Blesa, Zaragoza: M. Olave, E. Bonafonte, L. Mayor, G. Azaceta, L. Palomera; Hospital Ernest Lluch Martin, Zaragoza: M. Malo, M.J. Escobar; Hospital Quiron Salud Zaragoza, Zaragoza: J.M. Grasa; Hospital Miguel Servet, Zaragoza: B. De Rueda, A. Aulés, C. Salvador, V. Ansó, A. Iborra, P. Delagado, A. Rubio; and Uruguay—Hospital de Clínicas, Montevideo: M. Stevenazzi, I. Alpire, V. Irigoin, L. Díaz, C. Guillermo, R. Guadagna, S. Grille, C. Oliver, M. Boada, V. Vales; Hospital Maciel, Montevideo: A.I. Prado; Cooperativa Medica de Rocha (COMERO), Rocha: A.P. De los Santos.

