

Key Points
TLR4 is overexpressed on MM MSCs, and its activation promotes the crosstalk with MM cells in enhancing protumoral factors.
Specifically targeting TLR4 on MM MSCs strengthens conventional MM therapy and weakens MM development in vivo.

Abstract
Bone marrow (BM) mesenchymal stromal cells (MSCs) are abnormal in multiple myeloma (MM) and play a critical role by promoting growth, survival, and drug resistance of MM cells. We observed higher Toll-like receptor 4 (TLR4) gene expression in MM MSCs than in MSCs from healthy donors. At the clinical level, we highlighted that TLR4 expression in MM MSCs evolves in parallel with the disease stage. Thus, we reasoned that the TLR4 axis is pivotal in MM by increasing the protumor activity of MSCs. Challenging primary MSCs with TLR4 agonists increased the expression of CD54 and interleukin-6 (IL-6), 2 factors directly implicated in MM MSC-MM cell crosstalk. Then, we evaluated the therapeutic efficacy of a TLR4 antagonist combined or not with conventional treatment in vitro with MSC-MM cell coculture and in vivo with the Vk*MYC mouse model. Selective inhibition of TLR4 specifically reduced the MM MSC ability to support the growth of MM cells in an IL-6-dependent manner and delayed the development of MM in the Vk*MYC mouse model by altering the early disease phase in vivo. For the first time, we demonstrate that specific targeting of the pathological BM microenvironment via TLR4 signaling could be an innovative approach to alter MM pathology development.
Introduction
Despite a significant increase in patient survival with multiple myeloma (MM) with the introduction of novel therapies,1 the median overall survival (OS) from diagnosis is 5.2 years.2,3 The bone marrow (BM) microenvironment is pivotal in the establishment and progression of MM.4 Nevertheless, a better understanding of the mechanism by which the environment affects the disease is still required to define new therapeutic targets. Several studies demonstrated that BM-derived mesenchymal stromal cells (MSCs) directly contribute to the growth, survival, and drug resistance of MM cells by expressing adhesion molecules (CD54, CD49e)5 and various cytokines (interleukin-6 [IL-6], growth/differentiation factor-15).6,7 Relying on past studies,8 we demonstrate here that TLR4, a pattern-recognition receptor,9 is significantly upregulated in MM MSCs as compared with healthy donor (HD) MSCs.
In this work, we demonstrate that TLR4 overexpressed by MM MSCs, its expression evolving by disease stage, is a pivotal event in the IL-6-dependent deleterious crosstalk between MSCs and MM cells. Treatment with a TLR4 inhibitor alone and to a greater extent its combination with current MM drugs (melphalan/lenalidomide),10 specifically reduced the MM MSC ability to support the growth of MM cells in vitro. In addition, we report the TLR4 impact in vivo on disease establishment in a Vk*MYC mouse model, thereby confirming TLR4 as an attractive therapeutic target of the pathological microenvironment in MM.
Study design
Cells
Fresh BM aspirates from patients with MM at different stages were collected in the Institut Universitaire du Cancer de Toulouse-Oncopole (France) through the Intergroup Francophone du Myelome network. Human samples, cell lines, and the culture process are described in supplemental Methods and supplemental Table 1.
Mice
Mice were maintained in the specific pathogen-free animal facility of the US006 CREFRE-Inserm/UPS, which is accredited by the French Ministry of Agriculture (accreditation no. A-31 55508). Animal experiments were conducted and approved by the ministère de l'enseignement supérieur, de la recherche et de l'innovation (APAFIS#5614-20 16060815487810 v4) and complied with the French regulations on care and protection of laboratory animals. All mice used in this study were 6-week-old female mice with a C57BL/6 genetic background. Wild-type (WT) mice were purchased from Janvier Laboratories. The transplantable Vk∗MYC MM cell line (Vk12653) was kindly provided by L. Bergsagel and expanded as described.11,12
Results and discussion
TLR4 overexpressed in MM MSCs plays a pivotal role in crosstalk with MM cells
MM is characterized by an inflammatory network in the BM microenvironment.13 Consequently, studying the role of TLR4, a key mediator of inflammation in this microenvironment, is relevant. Transcriptomic analysis revealed consistently higher mRNA level of TLR4 in MM MSCs than in MSCs from HD and from monoclonal gammopathy of undetermined significance (Figure 1A). This observation was confirmed at the protein level (Figure 1B). When analyzing the transcriptomic profile of MSCs from HD and patients at different stages of MM (diagnosis [D], complete remission [CR], or early relapse [ER] from first-line intensive treatment), TLR4 expression level was greatly reduced in MSCs at CR vs at D but was overexpressed at ER vs at D (Figure 1C). In addition, after ex vivo culture, TLR4 was higher in ER than CR MSCs (Figure 1D), which confirms that TLR4 expression in MM MSCs evolves during the disease course and remains as an imprint even after cell culture.
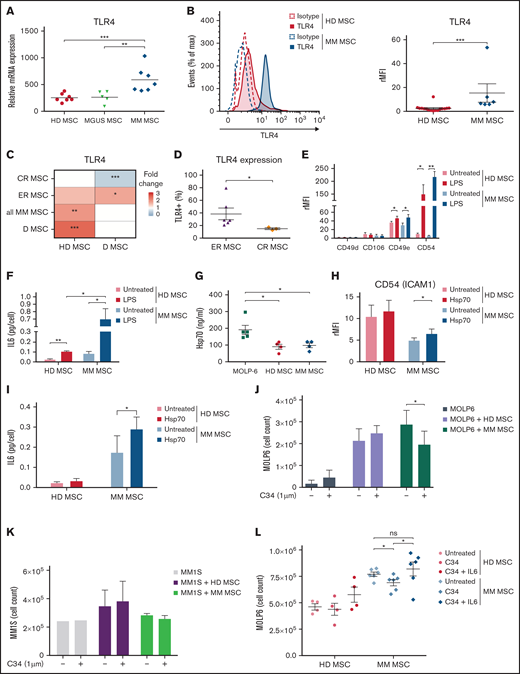
Disease-stage-dependent overexpression of TLR4 on MM MSCs modulated pro-MM factors implicated in crosstalk with MM cells. Fresh BM aspirates from HD MSCs and MM MSCs were analyzed at the stage of monoclonal gammopathy of undetermined significance (MGUS MSC), diagnosis (D MSC), complete remission (CR MSC), or early relapse (ER MSC) in the Institut Universitaire du Cancer de Toulouse-Oncopole (Toulouse). (A) TLR4 mRNA expression in BM MSCs from HD (n = 7), MGUS (n = 5), and MM (n = 7). Data are from U133+ 2.0 microarrays and previously described.8 Each point represents 1 sample; the horizontal bar is the mean. (B) Representative flow cytometry and graph showing the expression of isotype (dotted line) or TLR4 (solid line) in HD (Red) (n = 16) and MM (Blue) (n = 6) MSCs after primoculture (P1). Data are mean±SEM presented as rMFI = ratio of mean fluorescence intensity (MFI) of staining/MFI isotype control. Each point represents 1 sample. (C) Heatmap showing the fold change (pseudocolor scale with red for upregulation and blue for downregulation) of TLR4 expression in MSCs isolated from patients in CR, ER, D, or total MM MSCs (left) in comparison with MSCs isolated from D and HD MSCs, respectively (bottom). (D) Percentage of cells expressing TLR4 from ER (n = 6) and CR (n = 3) MM MSCs after primoculture (P1). Data are mean±SEM. Each point represents 1 sample. (E) CD49d, CD49e, CD54, and CD106 expression in HD (Red) and MM MSCs (Blue) after 1-hour stimulation with 1 µg/mL lipopolysaccharide (LPS) or not (untreated), a wash, and 2-day culture at 37°C 5% CO2. Data are mean±SEM of rMFI from 5 independent experiments. (F) IL-6 secretion by HD (Red, n = 3) and MM (Blue, n = 3) MSCs after 1-hour stimulation with 1 µg/mL LPS or not (untreated), a wash, and 2-day culture at 37°C 5% CO2. Data were analyzed by ELISA with a Varioskan scanning reader and represented as mean±SEM. (G) Heat shock protein 70 (Hsp-70) secretion by MM cell line (Green, MOLP-6), HD (Red), and MM MSCs (Blue) in normal culture condition. Data were analyzed by ELISA and represented as mean±SEM from 5 independent experiments. (H,I) CD54 expression (H) and IL-6 secretion (I) by HD and MM MSCs after 48-hour stimulation with human recombinant Hsp70 (1 µg/mL) or not (untreated) at 37°C 5% CO2. Data are mean±SEM of CD54 rMFI or IL-6 (pg/cell) secretion from 10 independent experiments. (J,K) Stroma-dependent (MOLP-6) (J) or stroma-independent MM cells (MM1S) (K) cell count after 7 days of coculture with HD or MM MSCs or without coculture. MSCs or MM cells (control) were untreated or treated with 1 µM TLR4 antagonist (C34). The number of MM cells was evaluated after staining with trypan blue and evaluated in a Malassez counting chamber on day 7. Data are mean±SEM from 3 independent experiments. (L) Stroma-dependent (MOLP-6) cell count after 7 days of coculture with C34 treated or not treated (untreated) HD or MM MSC, in presence or absence of human recombinant IL-6. Data are mean±SEM from 6 independent experiments. Statistical differences between 2 groups were determined by Mann-Whitney test (A,B,C,D), paired (E,F,H,I,J,K,L), or unpaired (F, G) t test. *P < .05, **P < .01, ***P < .001. ns, not significant. For the Figure 1F, paired t test is used to compare the HD or MM MSC untreated or treated with LPS, and unpaired t test is used for comparison between HD MSC and MM MSC.
Disease-stage-dependent overexpression of TLR4 on MM MSCs modulated pro-MM factors implicated in crosstalk with MM cells. Fresh BM aspirates from HD MSCs and MM MSCs were analyzed at the stage of monoclonal gammopathy of undetermined significance (MGUS MSC), diagnosis (D MSC), complete remission (CR MSC), or early relapse (ER MSC) in the Institut Universitaire du Cancer de Toulouse-Oncopole (Toulouse). (A) TLR4 mRNA expression in BM MSCs from HD (n = 7), MGUS (n = 5), and MM (n = 7). Data are from U133+ 2.0 microarrays and previously described.8 Each point represents 1 sample; the horizontal bar is the mean. (B) Representative flow cytometry and graph showing the expression of isotype (dotted line) or TLR4 (solid line) in HD (Red) (n = 16) and MM (Blue) (n = 6) MSCs after primoculture (P1). Data are mean±SEM presented as rMFI = ratio of mean fluorescence intensity (MFI) of staining/MFI isotype control. Each point represents 1 sample. (C) Heatmap showing the fold change (pseudocolor scale with red for upregulation and blue for downregulation) of TLR4 expression in MSCs isolated from patients in CR, ER, D, or total MM MSCs (left) in comparison with MSCs isolated from D and HD MSCs, respectively (bottom). (D) Percentage of cells expressing TLR4 from ER (n = 6) and CR (n = 3) MM MSCs after primoculture (P1). Data are mean±SEM. Each point represents 1 sample. (E) CD49d, CD49e, CD54, and CD106 expression in HD (Red) and MM MSCs (Blue) after 1-hour stimulation with 1 µg/mL lipopolysaccharide (LPS) or not (untreated), a wash, and 2-day culture at 37°C 5% CO2. Data are mean±SEM of rMFI from 5 independent experiments. (F) IL-6 secretion by HD (Red, n = 3) and MM (Blue, n = 3) MSCs after 1-hour stimulation with 1 µg/mL LPS or not (untreated), a wash, and 2-day culture at 37°C 5% CO2. Data were analyzed by ELISA with a Varioskan scanning reader and represented as mean±SEM. (G) Heat shock protein 70 (Hsp-70) secretion by MM cell line (Green, MOLP-6), HD (Red), and MM MSCs (Blue) in normal culture condition. Data were analyzed by ELISA and represented as mean±SEM from 5 independent experiments. (H,I) CD54 expression (H) and IL-6 secretion (I) by HD and MM MSCs after 48-hour stimulation with human recombinant Hsp70 (1 µg/mL) or not (untreated) at 37°C 5% CO2. Data are mean±SEM of CD54 rMFI or IL-6 (pg/cell) secretion from 10 independent experiments. (J,K) Stroma-dependent (MOLP-6) (J) or stroma-independent MM cells (MM1S) (K) cell count after 7 days of coculture with HD or MM MSCs or without coculture. MSCs or MM cells (control) were untreated or treated with 1 µM TLR4 antagonist (C34). The number of MM cells was evaluated after staining with trypan blue and evaluated in a Malassez counting chamber on day 7. Data are mean±SEM from 3 independent experiments. (L) Stroma-dependent (MOLP-6) cell count after 7 days of coculture with C34 treated or not treated (untreated) HD or MM MSC, in presence or absence of human recombinant IL-6. Data are mean±SEM from 6 independent experiments. Statistical differences between 2 groups were determined by Mann-Whitney test (A,B,C,D), paired (E,F,H,I,J,K,L), or unpaired (F, G) t test. *P < .05, **P < .01, ***P < .001. ns, not significant. For the Figure 1F, paired t test is used to compare the HD or MM MSC untreated or treated with LPS, and unpaired t test is used for comparison between HD MSC and MM MSC.
To explore the biological significance of increased TLR4 level in MM, we challenged MM and HD MSCs with exogenous and endogenous ligands of TLR4. In both HD and MM MSCs, TLR4 stimulation with lipopolysaccharide (LPS) increased the expression of the adhesion molecules CD49e and CD54, which are crucial for the MSC-MM cell interaction14,15 (Figure 1E). After TLR4 activation by LPS, secretion of IL-6, a key factor for survival, growth, and chemoresistance of MM cells,16 was increased in HD MSCs and to a greater extent in MM MSCs (Figure 1F). As demonstrated in supplemental Figure S1A,B with NFkB inhibitor (Bay 11-7082), CD54 and IL-6 upregulation after TLR4 stimulation was mediated by the NFkB signaling pathway.
To further investigate the context of the MM pathology, we evaluated heat shock protein 70 (Hsp70), an endogenous ligand for TLR4 actively released in the MM microenvironment and secreted by the MM cell line (Figure 1G).17 Hsp70 significantly upregulated CD54 expression and IL-6 secretion only in MM MSCs (Figure 1H,I). In pathological BM, MSCs could be permanently primed by TLR4 endogenous ligands such as Hsp70 released from injured cells in bone lesions or by MM cells themselves. In this way, we found that the pS536 NFkB, correlated to NFkB activation, was overexpressed under the basal condition in MM MSCs compared with healthy MSCs and statistically upregulated when MM-MSC were treated by Hsp70 (supplemental Figure S1C,D). In parallel and from another model, TLR4 signaling drives the MSC commitment to a protumoral microenvironment transformation in MM.18
Additive effect of TLR4 antagonist and MM drugs in inhibiting MM cell proliferation
Numerous studies have used stroma-independent MM cell lines (MM1S, RPMI8226) to analyze the efficiency of chemotherapy drugs.19 However, in BM, MM cells strongly adhere to MSC stroma, which increases chemoresistance and survival signals.14 To underline the role of the tumoral microenvironment in MM cell growth, we used the TLR4-negative stroma-dependent myeloma cell line MOLP-6.20 We evaluated the involvement of TLR4 in the ability of primary MSC stroma to support MOLP-6 (stroma-dependent line) and MM1S (stroma-independent line) proliferation by using a potent selective inhibitor of TLR4 signaling, C34 (1-methylethyl 2-[acetylamino]-2-deoxy-α-d-glucopyranoside 3,4,6-triacetate).21 We treated primary HD or MM MSC stroma with C34 before and during coculture with MM cell line, and we did not notice any effect on the viability of MSCs (supplemental Figure S1E). C34 had no effect on the ability of HD stroma to support MOLP-6 growth but significantly reduced the ability of MM stroma to promote MOLP-6 growth as compared with untreated stroma (Figure 1J). In parallel, TLR4 antagonism had no effect on coculture of stroma-independent MM cells (MM1S) and MSCs (Figure 1K), which confirms the specific role of TLR4 in targeting MM stroma. Interestingly, we demonstrated that TLR4 blocking altered CD54 and IL-6 overexpression after TLR4 stimulation in MM MSCs (supplemental Figure S1F,G). As shown in supplemental Figure S1H, besides IL-6, to proliferate MM cells requires strong adhesion with the MSC stroma. MOLP-6 cells monoculture in the presence of IL-6 (50 ng/mL) or in media supplemented with 50% of MOLP-6/MSCs supernatant did not support the high MOLP-6 proliferation rate observed after direct coculture with primary MSCs. In addition, we observed that the adhesion of MOLP-6 cells to the stroma was maintained when the MSC stroma was treated with the TLR4 inhibitor, but their proliferation was significantly inhibited due to a decrease of stroma-derived IL-6 (Figure 1L). The addition of recombinant IL-6 to this coculture rescued the C34-induced inhibition of MOLP6 proliferation with MM stroma showing the key and necessary role of IL-6 in this context (Figure 1L).
In order to get closer to clinical therapeutics, we studied the effect of selective C34 inhibition of MSCs expressing TLR4 on MOLP-6 proliferation, combined with conventional treatment with melphalan (chemotherapy drug) and lenalidomide (thalidomide analog). C34 with or without melphalan did not significantly inhibit MOLP-6 cell growth after coculture with HD-derived MSCs; conversely, C34 conferred a robust and significant inhibition in the presence of MM-derived MSC stroma and to a greater extent with C34+melphalan (Figure 2A). Lenalidomide alone inhibited MOLP-6 cell proliferation in both HD and MM MSC cocultures; however, lenalidomide with C34 treatment greatly altered MOLP-6 cell growth only when cocultured with MM MSCs (Figure 2B). Attacking the disease on both fronts and controlling stroma responsiveness reinforced the global effect of the therapy. In parallel, assessing the impact of different treatments in vitro on TLR4 expression on MSCs could open up interesting perspectives by correlating this with treatment efficacy.
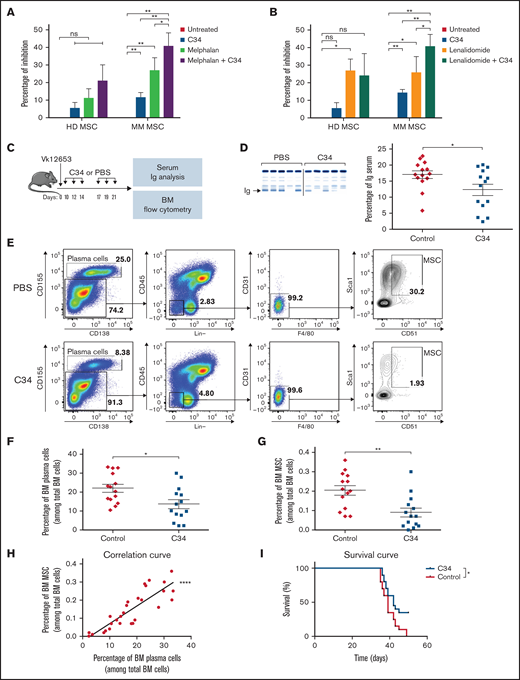
TLR4 inhibition potentiated anti-MM drug effect in MOLP-6-MSC coculture and decreased Vk*MYC mouse development. (A,B) Percentage of MOLP-6 cell inhibition after 7 days of coculture with HD or MM MSCs or without coculture. MSCs were untreated or treated with 1 µM C34, then MOLP-6 cells (5.104) were added to each flask with 5 mL complete RPMI medium with or without 100 nM melphalan (A) or lenalidomide (B). For both cocultures, after 72 hours, 2 mL complete RPMI medium ± 1 µM C34 ± 100 nM melphalan or lenalidomide was added, respectively. Data are mean±SEM of percent inhibition calculated as 1-(number cocultured MOLP-6 ± melphalan or lenalidomide ± C34 at day 7/number untreated cocultured MOLP-6 at day 7) from 5 independent experiments. (C-I) C57Bl/6 WT mice were injected with Vk12653 myeloma cell line (2 × 10⁶ cells, iv). Ten days later, they were treated with 1 mg/kg C34 (C34 group, n = 14) or phosphate-buffered saline (PBS group, n = 14), twice a week for 2 weeks. Then, blood samples were collected and serum was harvested for protein electrophoresis. After treatment, the femur was harvested and flushed to extract BM. As a control, C34 effect on BM from WT mice is shown in supplemental Figure S2. Erythrocytes were lysed, and BM was stained with mouse antibodies as described in supplemental Table 1. (C) Schematic representation of the experimental design. (D) Representative electrophoresis and graph showing the presence of monoclonal Ig in the blood of PBS (Red) and C34 (Blue) groups after 2-week treatment. According to the manufacturer, serum proteins are separated into 6 major fractions (albumin, α-1, α-2, β-1, β-2, γ), and we detected and quantified monoclonal components for the diagnosis. Data are mean±SEM. Each point represents 1 sample. (E) Representative FACS plots showing the gating strategy to isolate MSCs. Viable cells were separated into 2 groups: plasma cells gated with double-positive CD155+/CD138+ cells and microenvironment CD155-cells. In this microenvironment, Lin-(B220, CD3e, Ter119, Gr1, CD11b), CD45.2-, CD31-, F4/80- allows for selecting MSCs with double-positive CD51+/Sca1+ cells. (F-H) Percentage of BM plasma cells (F) and BM MSCs (G) in C34-treated (Blue) or control (Red) groups among total BM cells. Data are mean±SEM from 3 independent experiments with n = 14 mice. (H) Correlation between BM plasma cell and BM MSC percentages. Each point represents 1 mouse. Pearson correlation coefficient, r = 0.7335. (I) Survival curve of Vk*MYC mice either untreated (PBS as control, Red) or treated by 10 mg/kg C34 (C34, Blue). Statistical differences between the 2 groups were determined with paired t test (A,B), Mann-Whitney test (C-G), and Gehan-Breslow-Wilcoxon test (I). *P < .05, **P < .01, ***P < .0001. ns, not significant.
TLR4 inhibition potentiated anti-MM drug effect in MOLP-6-MSC coculture and decreased Vk*MYC mouse development. (A,B) Percentage of MOLP-6 cell inhibition after 7 days of coculture with HD or MM MSCs or without coculture. MSCs were untreated or treated with 1 µM C34, then MOLP-6 cells (5.104) were added to each flask with 5 mL complete RPMI medium with or without 100 nM melphalan (A) or lenalidomide (B). For both cocultures, after 72 hours, 2 mL complete RPMI medium ± 1 µM C34 ± 100 nM melphalan or lenalidomide was added, respectively. Data are mean±SEM of percent inhibition calculated as 1-(number cocultured MOLP-6 ± melphalan or lenalidomide ± C34 at day 7/number untreated cocultured MOLP-6 at day 7) from 5 independent experiments. (C-I) C57Bl/6 WT mice were injected with Vk12653 myeloma cell line (2 × 10⁶ cells, iv). Ten days later, they were treated with 1 mg/kg C34 (C34 group, n = 14) or phosphate-buffered saline (PBS group, n = 14), twice a week for 2 weeks. Then, blood samples were collected and serum was harvested for protein electrophoresis. After treatment, the femur was harvested and flushed to extract BM. As a control, C34 effect on BM from WT mice is shown in supplemental Figure S2. Erythrocytes were lysed, and BM was stained with mouse antibodies as described in supplemental Table 1. (C) Schematic representation of the experimental design. (D) Representative electrophoresis and graph showing the presence of monoclonal Ig in the blood of PBS (Red) and C34 (Blue) groups after 2-week treatment. According to the manufacturer, serum proteins are separated into 6 major fractions (albumin, α-1, α-2, β-1, β-2, γ), and we detected and quantified monoclonal components for the diagnosis. Data are mean±SEM. Each point represents 1 sample. (E) Representative FACS plots showing the gating strategy to isolate MSCs. Viable cells were separated into 2 groups: plasma cells gated with double-positive CD155+/CD138+ cells and microenvironment CD155-cells. In this microenvironment, Lin-(B220, CD3e, Ter119, Gr1, CD11b), CD45.2-, CD31-, F4/80- allows for selecting MSCs with double-positive CD51+/Sca1+ cells. (F-H) Percentage of BM plasma cells (F) and BM MSCs (G) in C34-treated (Blue) or control (Red) groups among total BM cells. Data are mean±SEM from 3 independent experiments with n = 14 mice. (H) Correlation between BM plasma cell and BM MSC percentages. Each point represents 1 mouse. Pearson correlation coefficient, r = 0.7335. (I) Survival curve of Vk*MYC mice either untreated (PBS as control, Red) or treated by 10 mg/kg C34 (C34, Blue). Statistical differences between the 2 groups were determined with paired t test (A,B), Mann-Whitney test (C-G), and Gehan-Breslow-Wilcoxon test (I). *P < .05, **P < .01, ***P < .0001. ns, not significant.
TLR4 antagonism weakened MM development in vivo
To explore the role of TLR4 in disease progression, we evaluated TLR4 inhibition in the Vk*MYC mice, a well-characterized preclinical MM mouse model presenting hallmarks of human pathology.11,22 The Vk12653 cell line was injected into C57BL/6 mice, which were treated or not with C34 (Figure 2C). At an early stage of the disease, serum Ig level was significantly lower in C34-treated than untreated Vk*MYC mice (Figure 2D). Therefore, C34 treatment significantly decreased the proportion of BM MM cells (CD138+/CD155+ cells) in Vk*MYC mice (Figure 2E,F) and also that of mouse BM MSCs (CD155-/Lin-/CD45-/CD31-/F4/80-/Sca1+/CD51+) (Figure 2E,G). Importantly, we found a corresponding increase in the proportion of MSCs and MM cells in BM during MM development in the mouse model (Figure 2H). In addition, C34 monotherapy significantly increased the survival rate of the Vk*MYC-injected mice (Figure 2I). Therefore, C34-based therapy could be an alternative or associated with chemotherapies routinely used to treat MM. For the first time, we show that specific targeting of the pathological microenvironment alters MM disease development.
In addition, this MM microenvironment targeting through TLR4 signaling, reflecting the disease stage, could be an innovative approach to improve the specificity and efficacy of current MM treatments.
Acknowledgments
The authors are grateful to their patients for their kind participation in this study. They thank L. Bergsagel and M. Chesi of the Mayo Clinic (Scottsdale, AZ) for the use of the Vk*MYC model. Laura Smales, English editor from BioMedEditing (Toronto, ON, Canada), corrected the manuscript.
This study was supported by internal funds of EFS Occitanie and by grants from Intergroupe Francophone du Myélome (IFM 2019-2021) (Geroscience and Rejuvenation Research Center [RESTORE], Flames Team, INSERM 1301, UMR CNRS 5070, Univ. P. Sabatier, EFS/ENVT); The Genomic and Immunology of Myeloma Laboratory at CRCT is supported by the Fondation ARC pour la Recherche sur le Cancer Program Grants (ARC PGA1-20160203788 and PGA1-20190208630). This work was supported by grants from the Institut National du Cancer (PLBIO R16100BB), Cancer Research Institute/Bristol-Myers Squibb CLIP Grant, and the Fondation Toulouse Cancer Santé IUCT-O translational research program.
Authorship
Contribution: F.D., L.M., P.B., J.C., and N.E. designed the research study; L.L., M.H., J.-G.D., M.-V.J., M.G., and N.E. performed the research (experiments); L.D.S.F., P.B., F.D., and N.E. analyzed the data; L.L., J.C., and N.E. wrote the paper; H.A.-L., A.J., N.R., and J.C. contributed clinical samples; and L.M. revised the paper.
Conflict-of-interest disclosure: The authors declare no competing financial interests.
Correspondence: Nicolas Espagnolle, Geroscience and Rejuvenation Research Center (RESTORE), Flames Team, INSERM 1301, UMR CNRS 5070, Univ. P. Sabatier, EFS/ENVT, 4bis Avenue Hubert Curien, 31100 Toulouse, France; e-mail: nicolas.espagnolle@efs.sante.fr.

