

Abstract
Guideline developers consider cost-effectiveness evidence in decision making to determine value for money. This consideration in the guideline development process can be informed either by formal and dedicated economic evaluations or by systematic reviews of existing studies. To inform the American Society of Hematology guideline on the diagnosis of venous thromboembolism (VTE), we conducted a systematic review focused on the cost-effectiveness of diagnostic strategies for VTE within the guideline scope. We systematically searched Medline (Ovid), Embase (Ovid), National Health Service Economic Evaluation Database, and the Cost-effectiveness Analysis Registry; summarized; and critically appraised the economic evidence on diagnostic strategies for VTE. We identified 49 studies that met our inclusion criteria, with 26 on pulmonary embolism (PE) and 24 on deep vein thrombosis (DVT). For the diagnosis of PE, strategies including d-dimer to exclude PE were cost-effective compared with strategies without d-dimer testing. The cost-effectiveness of computed tomography pulmonary angiogram (CTPA) in relation to ventilation-perfusion (V/Q) scan was inconclusive. CTPA or V/Q scan following ultrasound or d-dimer results could be cost-effective or even cost saving. For DVT, studies supporting strategies with d-dimer and/or ultrasound were cost-effective, supporting the recommendation that for patients at low (unlikely) VTE risk, using d-dimer as the initial test reduces the need for diagnostic imaging. Our systematic review informed the American Society of Hematology guideline recommendations about d-dimer, V/Q scan and CTPA for PE diagnosis, and d-dimer and ultrasound for DVT diagnosis.
Introduction
To support patients and health professionals in venous thromboembolism (VTE) diagnosis, the American Society of Hematology (ASH) together with the MacGRADE center at McMaster University developed evidence-based guidelines on diagnostic strategies for pulmonary embolism (PE), deep vein thrombosis (DVT) of the lower and upper extremity, and recurrent VTE.1 Various strategies including d-dimer testing, ultrasound, computed tomography pulmonary angiogram (CTPA), and ventilation-perfusion scan (V/Q scan) used alone and in various combinations in the diagnostic evaluation for a first and recurrent suspected VTE were used. Accurate diagnosis of VTE is important because of the morbidity and mortality associated with missed diagnoses and the potential side effects and/or inconvenience, and resource implications of diagnosis and anticoagulant treatment given for VTE.1 Thus, following the Evidence to Decision frameworks,2,3 the guideline recommendations were calibrated based on economic evidence, to consider the value for money and the impact on the budget of the alternative strategies to diagnose VTE.
Cost-effectiveness analysis or cost-utility analysis compares the relative costs and outcomes of different strategies and helps health care researchers determine the value for money of the strategies of interest. In other words, it assesses whether the additional benefit in outcomes is worth the additional cost. For guideline developers, considering cost-effectiveness evidence in decision making means answering questions about value for money, which means a holistic consideration of the net clinical benefit, uncertainty in evidence about the clinical benefit, and uncertainty in how much people value the clinical benefit.2-4 Meanwhile, it is also critical to consider the affordability, that is, resource implications of recommended strategies. Budget impact analysis is an economic analysis that estimates the financial consequences of adopting an intervention.5 The consideration of value for money and resource implications in the guideline development process can be informed either by formal economic evaluations (eg, cost-effectiveness or cost-utility analysis, budget impact analysis), or by systematic reviews of existing economic evaluations.6 Systematic reviews of economic evaluations has gained popularity in recent years.7-9 Systematically summarizing and critically appraising health economic evidence facilitates the development of transparent and cost-conscious guideline recommendations. Specific to the scope of the guidelines, there have been cost-effectiveness analyses on the diagnostic strategies for VTE, but systematic reviews which provide a detailed overview of relevant evidence are lacking. To inform the guideline on the diagnosis of VTE, we conducted a systematic review focused on the cost-effectiveness of diagnostic strategies for VTE within the guideline scope, which mainly considered d-dimer and ultrasound for DVT, and d-dimer, V/Q scan, and CTPA for PE.
Because the systematic review findings might help inform a wider audience than guideline developers, we updated the evidence to March 2021 for the purposes of this publication. This systematic review aims to assess the cost-effectiveness or budget impact of all diagnostic strategies for VTE.
Methods
We systematically searched, summarized, and critically appraised the economic evidence on diagnostic strategies for VTE. We reported this review following the Preferred Reporting Items for Systematic Reviews and Meta-Analyses (PRISMA) statement.10
Economic literature search
To comprehensively search relevant records, we performed an economic literature search on 12 December 2016 to retrieve studies published from Medline (Ovid) and Embase (Ovid) until the search date. We created an auto search alert to update the search results until March 2021. To retrieve health economics-relevant studies, we applied an economic and costing filter developed by the Scottish Intercollegiate Guidelines Network.11 We also performed a targeted gray literature search on the National Health Service Economic Evaluation Database and the Cost-Effectiveness Analysis Registry (see supplemental Document 1 for search strategies).
Eligibility criteria
We screened the retrieved records with the prespecified inclusion and exclusion criteria. Primary studies were eligible if they met the following inclusion criteria: included a population of adults (18 years and older) undergoing diagnostic or screening tests for DVT, PE, recurrent DVT, or recurrent PE (includes any type of patient, adult with no risk factors, adult with known risk factors such as pregnancy, cancer, thrombophilia), evaluated a diagnostic or screening tests for VTE. Outcomes of interest included: cost-effectiveness analysis, cost-utility analysis, or cost-benefit analysis of VTE diagnostic strategies; cost comparisons of VTE diagnostic or screening strategies; health care service utilization comparisons of VTE diagnostic or screening strategies; and budget impact analyses. We excluded the following information: nonoriginal report (eg, review, commentary, communication); conference abstracts and structured abstracts; project record; letter/commentary; and case reports. We set no restriction on the publication language or year.
Literature screening
We managed citations through Endnote and conducted a duplicate initial screening of titles and abstracts by 2 independent reviewers. We then obtained the full text of studies that appeared eligible for review according to the inclusion criteria by either reviewer. We examined the full-text articles and selected studies eligible for inclusion. Two independent reviewers conducted the full-text review in duplicate and resolved the disagreement through consensus discussion. If necessary, a third reviewer was consulted. The reviewer also examined reference lists for any additional relevant studies from the guideline’s other systematic reviews.
Data extraction
We extracted relevant data on study characteristics and health economic outcomes, including the following details: source (eg, citation information, study type), methods (eg, study design, perspective, time horizon, population, intervention[s], comparator[s]), and outcomes (eg, health outcomes, costs, incremental cost-effectiveness ratios, sensitivity analyses).
Study limitations
For model-based cost-effectiveness or cost-utility analyses, we determined the study quality of each identified study by applying a modified quality appraisal checklist.12 We did not assess the study limitations for studies only on cost comparison or budget impact analysis. We did not conduct body of evidence level quality assessment.
Results
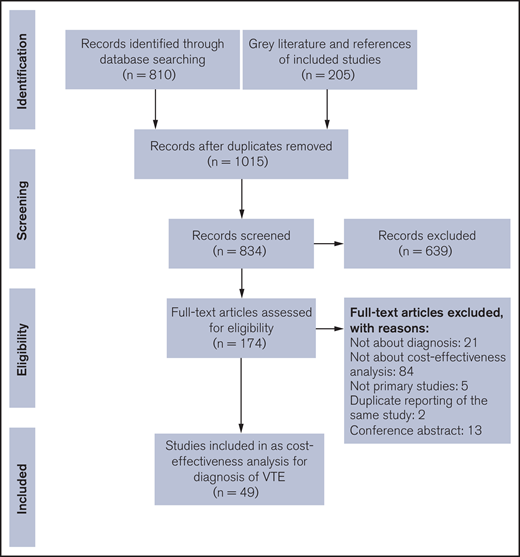
The economic literature search yielded 834 citations published until 7 March 2021, after removing duplicates. We identified 49 studies that met our inclusion criteria (see supplemental Document 2 for reference list of included studies). Figure 1 shows the PRISMA flow diagram for the literature search and screening process.
Overview of included economic evaluations
Tables 1 and 2 summarize the characteristics of included studies. Of all the included reports, 21 were from North America (including 16 from the United States, and 5 from Canada), 24 from Europe (including 10 from the Netherlands, 4 from Switzerland, 3 from the United Kingdom, 2 from France and Spain, and 1 each from Italy, Serbia, and Sweden), and 1 each from Argentina, Australia, and Thailand. One further study was reported by researchers from multiple countries without specifying which country the results apply to. Twenty-six economic evaluations assessed the diagnosis of PE, 24 the diagnosis of DVT (with 1 on both).
Economic evaluations of diagnostic and screening strategies for pulmonary embolism
| Study | Country/setting | Study design/analytic technique | Perspective | Time horizon/discount | Currency/y | Population/pretest probability (prevalence) | Intervention and comparison | Results |
|---|---|---|---|---|---|---|---|---|
| d-dimer | ||||||||
| Blondon 2020 | Multiple countries; inpatient and outpatient | Decision analytic model (decision tree);cost utility analysis | Health care system | Lifetime horizon;3% for both cost and effectiveness | $ (USD) in 2018 | Hypothetical cohort of patients with suspected PE with a non-high pretest probability; non-high pretest probability | Age-adjusted d-dimer strategy compared with standard d-dimer strategy | When Geneva risk score was used, compared with the standard cutoff, the age-adjusted d-dimer test cutoff was associated with a loss of 0.0001 quality-adjusted life-years (16.076 QALYs vs 16.076 QALYs) and an average cost reduction of $33.4 ($1562 for age-adjusted d-dimer test vs $1596 for standard d-dimer test). When Wells risk score was used, the cost-effectiveness results were similar to Geneva risk score. The age-adjusted d-dimer test cutoff results in a clinically nonsignificant decrease in QALY but important costs reductions. |
| Duriseti 2006 | USA; an urban emergency department | Decision analytic model; cost utility analysis | Unclear | 25 y (lifetime for a 55-y-old patient);3% for both cost and effectiveness | $ (USD), currency year not specified | Hypothetical patients with suspected pulmonary embolism; all patients, unselected, prevalence unknown | The d-dimer test was combined with 10 imaging strategies: (1) no imaging; (2) compression ultrasound alone; (3) compression ultrasound followed by V/Q if negative, and treatment if V/Q > low; (4) compression ultrasound followed by V/Q if negative, and treatment if V/Q > normal; (5) compression ultrasound treatment if V/Q > intermediate; (6) V/Q and treatment if V/Q > low; 7)V/Q and treatment if V/Q > normal; (8) V/Q and treatment if V/Q > intermediate; (9) CT angiogram and treatment if CT angiogram positive; and (10) compression ultrasound followed by CTP (CT angiogram with pulmonary portion) with treatment if either test is positive | In the base case, for all patient pretest categories, the most cost-effective diagnostic strategy is to use an initial enzyme-linked immunosorbent assay d-dimer test, followed by compression ultrasound of the lower extremities if the d-dimer is above a specified cutoff. |
| Duriseti 2010 | USA; emergency department | Decision analytic model; cost utility analysis | Not reported (indirect cost considered) | 25 y (lifetime for a 55-y-old patient);3% for both cost and effectiveness | $ (USD), currency year not specified | Hypothetical patients presenting with undifferentiated symptoms suggestive of pulmonary embolism; all patients, unselected, prevalence unknown | The d-dimer test was combined with 10 imaging strategies: (1) no imaging; (2) compression ultrasound alone; (3) compression ultrasound followed by V/Q if negative, and treatment if V/Q > low; (4) compression ultrasound followed by V/Q if negative, and treatment if V/Q > normal; (5) compression ultrasound treatment if V/Q > intermediate; (6) V/Q and treatment if V/Q > low; (7)V/Q and treatment if V/Q > normal; (8) V/Q and treatment if V/Q > intermediate; (9) CT angiogram and treatment if CT angiogram positive; and (10) compression ultrasound followed by CTP (CT angiogram with pulmonary portion) with treatment if either test is positive | For all patient pretest categories, the best strategy is to use a d-dimer test, followed by compression ultrasound if the d-dimer is above a specified cutoff. A cutoff higher than the current widely used cutoff was preferred or dominant for all pretest categories except high Wells patients with clinically suspected deep venous thrombosis. |
| Elias 2004 | France; hospitalized patients | Decision analytic model; cost-effectiveness analysis | Health care payer’s perspective | 3 mo; no discount (time horizon ≤ 1 y) | € in 2011 | Hypothetical patients with suspected pulmonary embolism; prevalence from literature, not reported | The following strategies were compared: (1) V/Q, angiography; (2) d-dimer, limited bilateral ultrasound, V/Q scan-clinical probability, angiography; (3) d-dimer- clinical probability, V/Q scan, limited bilateral ultrasound, serial limited bilateral ultrasound, angiography; (4) limited bilateral ultrasound, helical CT, clinical probability, V/Q scan, pulmonary angiography; (5) helical CT, limited bilateral ultrasound; (6) d-dimer assays, limited bilateral ultrasound, helical CT; (7) d-dimer, extended bilateral ultrasound, helical CT; (8) limited bilateral ultrasound, helical CT; and (9) extended bilateral ultrasound, helical CT | Strategies including D-dimer and/or ultrasound followed by helical CT were less costly than those using V/Q scan and angiography. Three strategies were dominant, including strategies 6, 8, and 9. Strategy 6, “d-dimer assays, limited bilateral ultrasound, followed by helical CT” was most cost-saving but the least effective of the 3 dominant strategies. Strategy 9, “extended bilateral ultrasound, helical CT” improves survival at an acceptable extra cost per life saved compared with strategy 6. |
| Humphreys 2004 | USA; setting not specified | Decision analytic model (decision tree);cost minimization analysis | Medicare charges | Not reported, likely a short temporal horizon; no discount (time horizon ≤ 1 y) | $ (USD) in 2003 | Hypothetical patients with suspected acute pulmonary embolism; unselected, prevalence unknown | The strategy with Wells score and d-dimer was compared with the standard approach using American Thoracic Society guideline with V/Q scan | Costs of testing using an algorithm based on Wells score and d-dimer ($216.52) was less than with a standard approach (American Thoracic Society guideline with V/Q scan, cost $538.62) for evaluating suspected acute pulmonary embolism. |
| Lee 2011 | USA; setting not specified | Decision analytic model (decision tree); Cost effectiveness analysis | Third-party payer perspective (the US government as the third-party payer) | 3 mo; No discount (time horizon ≤ 1 y) | $ (USD) in 2006 | Patients With a high, intermediate, or low clinical probability of pulmonary embolism; 28.4% overall (10%, 37%, 69% for low, intermediate, and high clinical probability groups) | The following strategies were compared: (1) V/Q scan then pulmonary angiography; (2) CT; (3) ultrasound then CT; (4) CT then ultrasound; (5) d-dimer then CT; (6) d-dimer then ultrasound then CT; (7) d-dimer then CT then ultrasound; (8) V/Q scan then CT d-dimer then V/Q scan then pulmonary angiography. | The strategy of D-dimer followed by CT was cost-effective and had the lowest cost per life saved for all patients suspected with pulmonary embolism (high, intermediate, low clinical probabilities). The conventional strategy including ventilation and perfusion lung scanning followed by pulmonary angiography or CT was not cost-effective. |
| Michel 1996 | Netherlands; large teaching hospitals in Amsterdam | Decision analytic model (decision tree);cost-effectiveness analysis | Not reported (only direct costs were considered) | 6 mo;5% for effectiveness when calculating QALYs | Fl. in October 1995 | 487 patients with clinically suspected pulmonary embolism; consecutive patients (unselected patients, prevalence unknown) | The Dutch consensus with V/Q scan was compared with alternative strategies consisted of d-dimer, clinical decision rule, and angiography. | The strategy with highest survival and leading to considerable savings subsequently included a V/Q scan, a clinical decision rule, a d-dimer test, a pulmonary angiography, and leg ultrasound. Patients with a high probability V/Q scan, an abnormal angiography, or leg ultrasound test are treated, whereas treatment is withheld in patients with a normal V/Q scan, a normal clinical decision rule, a negative d-dimer test, a normal angiography, or a normal leg ultrasound test. |
| Perrier 1997 | Switzerland; emergency department | Decision analytic model (decision tree);cost-effectiveness analysis | Health care system | 3 mo; no discount (time horizon ≤ 1 y) | $ (USD), currency year not specified | Hypothetical patients with suspected pulmonary embolism;35% (intermediate risk) | The following strategies were compared: (1) no treatment; (2) lung scan then angiography (reference strategy for judging effectiveness); (3) lung scan followed by ultrasound then angiography; (4) lung scan followed by d-dimer and ultrasound then angiography; (5) d-dimer, followed by ultrasound then lung scan in case of a negative ultrasound, and angiography; (6) lung scan, no treatment of low probability, angiography for intermediate probability, treatment of high probability; (7) identical to strategy 5, except patients initially undergo a negative D-dimer or ultrasound do not undergo lung scan; and (8) d-dimer followed by ultrasound then scan, treatment except those with a normal or near-normal scan | The D-dimer test and ultrasound are cost-effective in the diagnosis of pulmonary embolism, whether performed after or before lung scan, thus avoiding costly referrals to lung scanning and/or angiography. For patients with a low clinical probability, a low-probability lung scan, and a normal ultrasound, treatment may be withheld without referring to angiography. |
| Perrier 2003 | Switzerland; tertiary care center in Geneva | Decision analytic model (decision tree);cost utility analysis | Third-party payer perspective | 3 mo; no discount (time horizon ≤ 1 y) | $ (USD) in 1996 | Hypothetical patients with suspected pulmonary embolism;10%, 37%, 69% for low, intermediate, and high clinical probability groups, respectively | The following strategies were compared: (1) V/Q scan ± angiography; (2) CT; (3) ultrasound ± CT; (4) d-dimer ± ultrasound ± CT; (5) d-dimer ± ultrasound ± CT ± angiography; (6) d-dimer ± ultrasound ± V/Q scan; (7) d-dimer ± ultrasound ± V/Q scan ± angiography; and (8) d-dimer ± ultrasound ± V/Q scan ± CT | For low clinical probability of pulmonary embolism patients, all strategies were reasonably effective, considering that the 3-mo survival remained within a range of 0.5% mortality compared with the reference strategy (V/Q scan ± angiography, $1728). The cheapest strategy was d-dimer ± ultrasound ± V/Q scan ($845), followed by d-dimer ± ultrasound ± CT ($1230). When clinical probability of pulmonary embolism was intermediate, the most cost-effective strategy was d-dimer ± ultrasound ± V/Q scan ± CT, in which a nondiagnostic V/Q scan is followed by helical CT ($2674). That strategy allowed us to forego pulmonary angiography in all patients. d-dimer ± ultrasound ± V/Q scan ± angiography was also cost saving compared with the reference strategy ($2832 vs $3164, respectively) and required an angiogram in 29% of patients. In patients with a high clinical probability of pulmonary embolism, d-dimer ± ultrasound ± V/Q scan ± CT remained the cheapest strategy ($4308) but was of marginal effectiveness (difference because of a higher proportion of patients treated unnecessarily, in 3-mo survival with the reference strategy, 0.47%). |
| Righini 2007 | Switzerland; emergency department | Decision analytic model (decision tree);cost utility analysis | Payer | 3 mo; no discount (time horizon ≤ 1 y) | $ (USD) in 2006 | 1721 consecutive patients with suspected pulmonary embolism; consecutive patients (unselected patients, prevalence unknown) | Four strategies were compared: (1) clinical probability ± d-dimer ± compression ultrasound ± helical CT; (2) clinical probability ± d-dimer ± helical CT; (3) clinical probability ± compression ultrasound ± helical CT; and (4) helical CT alone | All strategies were equally safe. Whatever the diagnostic strategy and whatever the age, the effectiveness remained very high, with variations in the 3-mo survival never exceeding 0.5% compared with the most effective strategy. Diagnostic strategies using d-dimer are less expensive. d-dimer measurement was highly cost-saving under the age of 80 y. |
| Van Beek 1996 | Netherlands; a secondary and tertiary referral center (both inpatient and outpatient) | Decision analytic model; cost-effectiveness analysis | Not reported (only direct costs were considered) | Not reported, likely a short temporal horizon; no discount (time horizon ≤ 1 y) | ECU, currency year not specified | 203 consecutive patients with suspected pulmonary embolism; consecutive patients (unselected patients, prevalence unknown) | The strategies compared include: (1) V/Q scan with ultrasound, if scan shows non-high probability and angiography, if ultrasound is normal; treatment if scan shows high probability, if ultrasound is abnormal, or if angiography shows pulmonary embolism; (2) d-dimer followed by strategy 1 if d-dimer elevated; (3) V/Q scan with d-dimer if scan shows non-high probability, ultrasound if d-dimer elevated and angiography if ultrasound is normal; treatment as strategy 1; (4) V/Q scan with angiography if scan shows non-high probability; treatment if scan shows high probability or if angiogram shows pulmonary embolism; (5) d-dimer followed by strategy 4 if d-dimer elevated; and (6) V/Q scan with d-dimer if scan shows non-high probability and angiography if d-dimer elevated; treatment as strategy 4 | Addition of the d-dimer assay to the diagnostic strategies does not result in any significant change in the mortality rates, whereas morbidity decreases to a slightly lower level. Addition of the d-dimer assay leads to an approximate 10% cost reduction in addition to a 25%-28% reduction in the number of patients requiring pulmonary angiography. |
| Van Erkel 1996 | Netherlands; a secondary and tertiary referral center | Decision analytic model (decision tree);cost-effectiveness analysis | Hospital | 3 mo; no discount (time horizon ≤ 1 y) | $ (USD), currency year not specified | Hypothetical patients with suspected pulmonary embolism; 24% | Conventional angiographic strategies:(1) V/Q scanning, ultrasound, and conventional angiography; (2) ultrasound and conventional angiography; (3) V/Q scanning and conventional angiography; and (4) V/Q scanning, US, d-dimer assay, and conventional angiography. Spiral CT angiographic strategies:(5) spinal CT angiography; (6) ultrasound and spiral CT angiography; (7) perfusion scanning and spinal CT angiography; (8) perfusion scanning, US, and spiral CT angiography; (9) ultrasound, perfusion scanning, and spiral CT angiography; (10) V/Q scanning, ultrasound, and spiral CT angiography; (11) ultrasound, d-dimer assay, and spinal CT angiography; and (12) d-dimer assay and spiral CT angiography. Reference strategies:(13) no therapy; (14) therapy in all patients; and (15) ideal. | With the mortality or cost per life saved as the primary outcome parameter, the best strategies all included use of spiral CT angiography. Use of ultrasound before spiral CT angiography reduced the mortality but increased the cost per life saved ($20 562 per life saved vs $19 564 per life saved for spiral CT angiography only). The d-dimer test before spiral CT angiography increased the mortality but improved the marginal cost-effectiveness ($16 493 per life saved vs $19 564 per life saved for spiral CT angiography only). |
| Van Erkel 1998 | Netherlands; a secondary and tertiary referral center | Decision analytic model (decision tree);cost-effectiveness analysis | Hospital | 3 mo; no discount (time horizon ≤ 1 y) | $ (USD), currency year not specified | Hypothetical patients with suspected pulmonary embolism;24% | CT strategies:(1) CT; (2) ultrasound and CT; (3) perfusion scan and CT; (4) perfusion scan, ultrasound, and CT; (5) ultrasound, perfusion scan, and CT; and (6) V/Q scan, ultrasound, and CT. PA strategies: (7) ultrasound and pulmonary angiography; and (8) V/Q scan, ultrasound, and pulmonary angiography. d-dimer/CT strategies: (9) d-dimer and CT; (10) d-dimer, ultrasound, and CT; (11) d-dimer, perfusion scan, and CT; (12) d-dimer, perfusion scan, ultrasound, and CT; (13) d-dimer, ultrasound, perfusion scan, and CT; (14) d-dimer, V/Q scan, ultrasound, and CT, d-dimer/pulmonary angiography strategies; (15) d-dimer, ultrasound, and pulmonary angiography; and (16) d-dimer, V/Q scan, ultrasound, and pulmonary angiography. Reference strategies:(17) no therapy; and (18) all therapy. | Strategies using helical CT have lower costs and higher survival than strategies that use pulmonary angiography. With a willing to pay threshold of $500 000 for each additional life saved, the most cost-effective strategy under baseline conditions is ultrasound followed by helical CT. Using this strategy, the average patient survival is 99.39% at an average cost of $1125 per patient, leading to an incremental cost-effectiveness of $116 000 per extra life saved when compared with the best strategy previously recommended (the same algorithm but preceded by the d-dimer test). |
| Van Erkel 1999 | Netherlands; European and United States hospitals | Decision analytic model (decision tree);cost-effectiveness analysis | Not reported (only direct costs were considered) | 3 mo; no discount (time horizon ≤ 1 y) | ECU in 1997 | Hypothetical patients with suspected pulmonary embolism;24%. | CT strategies:(1) CT; (2) ultrasound, CT; (3) perfusion scan, CT; (4) perfusion scan, Ultrasound, CT; (5) ultrasound, perfusion scan, CT; (6) V/Q scan, ultrasound, CT; (7) d-dimer and CT; (8) d-dimer, ultrasound, CT;( 9) d-dimer, perfusion scan, CT; (10) d-dimer, perfusion scan, ultrasound, CT; (11) d-dimer, ultrasound, perfusion scan, CT; and 12) d-dimer, V/Q scan, ultrasound, CT. PA strategies:(13) ultrasound, pulmonary angiography; (14) V/Q scan, ultrasound, pulmonary angiography; (15) d-dimer, ultrasound, pulmonary angiography; and 16) d-dimer, V/Q scan, ultrasound, pulmonary angiography. Reference strategies:(17) no therapy; and (18) all therapy. | The most cost-effective strategy was ultrasound followed by helical CT. |
| V/Q scan or CTPA | ||||||||
| Batalles 2009 | Argentina; inpatient | Decision analytic model (decision tree);cost-effectiveness analysis | Third-party payer perspective | A short temporal horizon; no discount (time horizon ≤ 1 y) | € in 2008 | Hypothetical patient who was hospitalized for another diagnosis other than PTE presented with an episode of sudden dyspnea;28.4%. | The strategies compared included: (1) V/Q lung scan; (2) spiral CT; (3) angiography by MDCT; (4) MRI; and (5) conventional arteriography. | The most cost-effective diagnostic test was angiography by MDCT. Compared with V/Q scan, the cost per additional diagnosis of pulmonary embolism was €127.2 for spiral CT. Angiography by MDCT cost €2168.4 for each additional PE diagnosis compared with spiral CT. MRI and conventional arteriography were dominated by angiography by MDCT. |
| Doyle 2004 | USA; not specified | Decision analytic model (decision tree);cost-effectiveness analysis | Third-party payer perspective | Not reported, likely a short temporal horizon; no discount (time horizon ≤ 1 y) | $ (USD), currency year not specified | 100 hypothetical pregnant women or women in the puerperium with clinical suspicion for PE;5%. | Diagnostic test for PE in pregnancy included: (1) compression ultrasound followed by anticoagulation (if there is a positive result) or secondary tests, V/Q scans or spiral CT (if there is a negative result); (2) V/Q scans as a primary test followed by anticoagulation; and (3) computed tomography followed by anticoagulation (if there is a positive result). | The use of spiral CT as the primary modality for the diagnosis of a suspected PE was the most cost-effective strategy at $17 208 per life saved vs the compression ultrasound strategy ($24 004 per life saved) and the V/Q scan strategy ($35 906 per life saved). If V/Q scanning or compression ultrasound scanning is used as the primary diagnostic modality, spiral CT is the most cost-effective secondary test; more cost-effective than V/Q scans or pulmonary angiography. |
| Henschke 1997 | USA; not specified | Not specified (likely decision analytic model);cost-benefit analysis | Patient | 6 mo; no discount (time horizon ≤ 1 y) | $ (USD), currency year not specified | Hypothetical patients suspected with pulmonary embolism; unselected. | The strategies compared included: (1) V/Q scan; (2) pulmonary arteriography; (3) MR angiography; and (4) CT angiography. | When the test charges are used, when the mortality is $1 and the morbidity is $10K, the best test is V/Q scan for prevalence rates below 10%. As mortality costs increase above $1, V/Q scan becomes the best algorithm for all prevalence values. When the mortality cost is $100K, V/Q is just slightly better than CT angiography or MR angiography. V/Q scan remains the best algorithm as the mortality costs increases. |
| Hull 1996 | Canada; Midwest urban hospital affiliated with a university medical school | Decision analysis; cost-effectiveness analysis | Third-party payer perspective | Not reported, likely a short temporal horizon; no discount (time horizon ≤ 1 y) | $ (USD), Can$ in 1992 | 662 patients with suspected acute pulmonary embolism; consecutive patients (unselected patients, prevalence unknown). | The strategies compared included: (1) V/Q lung scans and pulmonary angiography; (2) V/Q lung scans, single noninvasive leg test (impedance plethysmography or Doppler ultrasound with B-mode imaging), and pulmonary angiography; and (3) V/Q lung scans, serial noninvasive leg test (impedance plethysmography or Doppler ultrasound with B-mode imaging), and pulmonary angiography. | For strategy 1, the charges in the United States for each patient who requires treatment would be $14 421, and the charges incurred per patient correctly withheld from treatment would be $5978. For strategy 2, the charges in the United States for each patient who requires treatment would be $14 047, and the charges incurred per patient correctly withheld from treatment would be $5865 if the noninvasive leg test was impedance plethysmography; and $14 407 and $6016 respectively, if the noninvasive leg test was Doppler ultrasound with B-mode imaging. For strategy 3, the charges in the United States for each patient who requires treatment would be $12 639, and the charges incurred per patient correctly withheld from treatment would be $4333 if the noninvasive leg test was impedance plethysmography; and $13 842 and $4745 respectively, if the noninvasive leg test was Doppler ultrasound with B-mode imaging. |
| Hull 2001 | Canada; Midwest urban hospital affiliated with a university medical school | Decision analysis; cost-effectiveness analysis | Third-party payer perspective | Not reported, likely a short temporal horizon; no discount (time horizon ≤ 1 y) | Can$ in 1999 | 662 patients with suspected acute pulmonary embolism; consecutive patients (unselected patients, prevalence unknown). | The strategies compared included: (1) V/Q lung scans and pulmonary angiography; (2) V/Q lung scans, single noninvasive leg test (impedance plethysmography or Doppler ultrasound with B-mode imaging), and pulmonary angiography; and (3) V/Q lung scans, serial non-invasive leg test (impedance plethysmography or Doppler ultrasound with B-mode imaging), and pulmonary angiography. | For strategy 1, the charges for each patient who requires treatment would be $10 761, and the charges incurred per patient correctly withheld from treatment would be $4461. For strategy 2, the charges for each patient who requires treatment would be $10 364, and the charges incurred per patient correctly withheld from treatment would be $4328. For strategy 3, the charges for each patient who requires treatment would be $8915, and the charges incurred per patient correctly withheld from treatment would be $3056. |
| Larcos 2000 | Australia; setting not specified | Decision analytic model (decision tree);cost-effectiveness analysis | Not reported (only direct costs were considered) | Lifetime horizon; life-years gained discounted: 3% | A$ in 1996/1997 | Hypothetical patients with suspected acute pulmonary embolism;34%. | The strategies compared included: (1) V/Q scan + ultrasound, pulmonary angiography; (2) CT scan alone; and (3) CT scan + ultrasound, pulmonary angiography. | The V/Q scan strategy was more effective (20.1 lives saved for every 1000 persons screened) and more costly (additional cost of A$315 per patient) compared with CT. The cost per life saved was A$940. If CT replaced V/Q scan in the screening, more lives could be saved (2.6 additional lives saved for every 1000 persons screened). Replacing V/Q scan with CT was also more costly (additional cost of A$979 per patient) compared with CT. The cost per life saved was A$23 905. |
| Muangman 2012 | Thailand; setting not specified | Prospective cohort; cost-effectiveness analysis | Not reported (only direct costs were considered) | 3 mo; no discount (time horizon ≤ 1 y) | ฿ currency year not specified | 100 cases with moderate to high probability for pulmonary embolism according to Wells criteria; moderate to high probability of pulmonary embolism. | Combined CTPA and indirect CTV was compared with strategy with sequential CTPA followed by direct CTV for negative PE cases. | The study found that 70 909 baht more per case for the combined CTPA and indirect CTV was needed for early detection of DVT (combined CTPA and indirect CTV: ฿3 744 000; sequential CTPA followed by direct CTV for negative PE cases: ฿2 964 000). |
| Oudkerk 1993 | Netherlands; inpatient | Decision analytic model; cost-effectiveness analysis | Unclear | 3 mo; no discount (time horizon ≤ 1 y) | $ (USD), currency year not specified | Hypothetical patients with clinically suspected pulmonary embolism;30%. | The strategies compared included: (1) no treatment; (2) no diagnostic test; treatment of all patients; (3) perfusion scan and treatment if scan is abnormal; (4) perfusion scan, followed with angiography if scan is abnormal, treatment if pulmonary embolism is shown; (5) V/Q scan, treatment only If scan shows high probability; (6) V/Q scan, followed with angiography if scan shows non-high probability, treatment if scan shows high probability or if angiography shows pulmonary embolism; (7) angiography in all patients, treatment if pulmonary embolism is shown; (8) ultrasound in all patients, followed with angiography if ultrasound is normal, treatment if ultrasound is abnormal or if angiography shows pulmonary embolism; (9) V/Q scan, followed with ultrasound if scan shows non high probability, treatment if scan shows high probability or if ultrasound is abnormal; and (10) V/Q scan, followed with ultrasound if scan shows non high probability and angiography if ultrasound is normal, treatment if scan shows high probability, if ultrasound is abnormal, or if angiography shows pulmonary embolism. | The analysis identified 3 categories of strategies. The first category included treatment of all patients (or of those with an abnormal perfusion scan). These strategies had the lowest mortality and morbidity rates but the highest costs because of inappropriate treatment of 55% to 70% of patients. The second category included pulmonary angiography strategies with or without prior V/Q lung scintigraphy and ultrasound of the legs had comparable low mortality and morbidity rates, lower rate of inappropriate treatment (fewer than 5% of patients). But it saved cost by about 40% compared with the first category. The third category used V/Q scintigraphy with or without ultrasound, and this category led to unacceptably high mortality rates. |
| Paterson 2001 | Canada; inpatient and outpatient | Decision analytic model (decision tree);cost-effectiveness analysis | Third-party payer perspective | 3 mo; no discount (time horizon ≤ 1 y) | Can$ in 1996 | Simulated cohort of 1000 patients with suspected acute pulmonary embolism, with a prevalence of 28.4% | The following strategies were compared: (1) spiral CT followed by ultrasound; (2) spiral CT followed by ultrasound and then angiography; (3) V/Q scan followed by ultrasound then angiography; (4) V/Q scan followed by ultrasound and then spiral CT; (5) spiral CT followed by angiography; (6) spiral CT alone; and (7) V/Q scan followed by spiral CT. | Four of the strategies yielded poorer survival at higher cost (strategies 2, 5, 6, and 7). The 3 remaining strategies were as follows: strategy 3, V/Q ± leg ultrasound ± pulmonary angiography (the “traditional” algorithm), with an expected survival of 953.7 per 1000 patients and a cost of $1416 per patient; strategy 4, V/Q scan followed by leg ultrasound and then spiral CT, with an expected survival of 953.4 per 1000 patients and a cost of $1391 per patient; strategy 1, spiral CT followed by leg ultrasound, with an expected survival of 958.2 per 1000 patients and a cost of $1751 per patient. Strategy 3 was then excluded by extended dominance. The cost per additional life saved was $70 833 for strategy 1 (spiral CT followed by leg ultrasound) relative to strategy 4 (V/Q scan followed by leg ultrasound then spiral CT). |
| Toney 2017 | USA; emergency department | Decision analytic model; cost-effectiveness analysis | Payer | 30 d; no discount (time horizon ≤ 1 y) | $ (USD) in 2016 | Hypothetical cohort of 1000 patients with suspected acute pulmonary embolism presenting to an emergency department;22.7%. | The strategies compared included: (1) single-photon emission CT; (2) single-photon emission CT with CT; (3) nuclear medicine; and (4) CT pulmonary angiography. | Total costs for 1000 patients were $3 638 078, $3 203 039, $5 768 844, and $3 824 694 for single-photon emission CT, single-photon emission CT with CT, nuclear medicine, and CT pulmonary angiography, respectively. Switching to single-photon emission CT with CT strategy yielding per-patient-per-month cost savings of $51.80 (vs CT pulmonary angiography), $213.80 (vs nuclear medicine), and $36.30 (vs single-photon emission CT). Total lives lost per 1000 patients was 28.90, 28.82, 31.21, and 34.34 for single-photon emission CT, single-photon emission CT with CT, nuclear medicine, and CT pulmonary angiography, respectively. |
| Ultrasound | ||||||||
| Beecham 1993 | USA; setting not specified | Retrospective medical data review; cost comparison | Not reported (only direct costs were considered) | Not reported, likely a short temporal horizon; no discount (time horizon ≤ 1 y) | $ (USD) in 1993 | 223 consecutive patients suspected of pulmonary embolism; consecutive patients (unselected patients, prevalence unknown). | Pulmonary arteriography was compared with compression sonography plus pulmonary arteriography. | If all 145 patients whose lung scans were nondiagnostic had sonography and only those with normal sonograms had pulmonary arteriography, the professional and hospital charges would be $359 552. If all 145 had pulmonary arteriography without sonography, the charges would be $395 031. This study demonstrated that if V/Q lung scans indicated a low or an indeterminate probability of pulmonary embolism, only those patients with normal sonographic findings would need further study. |
| Ward 2011 | USA; emergency department | Decision analytic model (decision tree and Markov model);cost utility analysis | Societal | 6 mo;3% for effectiveness | $ (USD) in 2009 | Hypothetical 59 y old, hemodynamically stable female who presents with new-onset symptoms of pulmonary embolism;37.5%. | Selected CT (if ultrasound negative) was compared with universal CT strategy. | A selective CT strategy using compression US is cost-effective for patients with a high pretest probability of pulmonary embolism. The cost of universal CT strategy was $9051.94, whereas the cost was $7594.24 for a selective CT strategy. The selective CT strategy led to 0.0213 QALY gain compared with a universal CT strategy. |
| Other | ||||||||
| Goodacre 2018 | UK; UK National Health Service | Decision analytic model (decision tree);cost utility analysis | UK National Health Service and personal social service perspectives | Lifetime horizon;3.5% for both costs and benefits | £ in 2015/16 | Hypothetical pregnant or postpartum (up to 6 wk after birth) women who presented with a suspected pulmonary embolism at a UK hospital;6.5%. | The strategies compared included: (1) scanning all pregnant women with suspected pulmonary embolism (current recommended care); (2) applying the 3 expert-derived clinical consensus decision rules (primary, sensitive and specific); (3) applying a permissive interpretation of Wells’ decision rule (Wells’ permissive); (4) applying a strict interpretation of Wells’ decision rule (Wells’ strict); (5) applying the pulmonary embolism rule-out criteria decision rule; (6) applying the simplified Geneva decision rule; (7) scanning no women, but treating all; and (8) no scanning no treatment. | No scan, treat none, Wells’ score (strict), Delphi specificity score, Geneva score, Wells’ score (permissive), Delphi primary score, PERC score, no scan, treat all, Delphi sensitivity score all dominated by scan all. |
Abbreviations: CTV, computed tomography venography; ICER, incremental cost-effectiveness ratio; MRI, magnetic resonance imaging; MDCT, multidetector computed tomography; PERC, pulmonary embolism rule-out criteria; QALY, quality-adjusted life-years.
Currencies: A$, Australian dollar; Thai baht; Can$, Canadian dollar; €, Euros; ETC, European currency unit; fl., Dutch guilders; £, UK Sterling; $, USD.
Economic evaluations of diagnostic and screening strategies for deep vein thrombosis
| Study | Country/setting | Study design/analytic technique | Perspective | Time horizon/discount | Currency/y | Population/pretest probability (prevalence) | Intervention and comparison | Results |
|---|---|---|---|---|---|---|---|---|
| d-dimer | ||||||||
| Bogavac-Stanojevic 2013 | Serbia; vascular ambulance at Department of Clinic for Vascular surgery, Clinical Centre of Serbia | Prospective cohort; cost-effectiveness analysis | The clinical laboratory setting perspective | NR, likely a short temporal horizon; no discount (time horizon ≤ 1 y) | € in 2011 | 192 (95 male and 97 female) prospectively identified outpatients with clinically suspected acute DVT; unselected, prevalence unknown | Three D-dimer assays were compared: (1) Innovance d-dimer; (2) Vildas d-dimer; (3) Hemosil d-dimer In the first decision analytic model, tests were applied for all patients; in the second decision analytic model, tests were applied only to patients with low and moderate pretest probability. | The diagnostic alternative employing Vidas d-dimer Exclusion II assay was cost-effective compared with the alternative employing Hemosil d-dimer HS assay. Compared with the Innovance d-dimer assay, the ICER (incremental cost per additional DVT positive patient selected for compression ultrasound) was estimated to be €0.187 for Vidas d-dimer assay and vs €0.998 for Hemosil d-dimer assay in patients selected for compression ultrasound, if there was no pretest probability assessment. When pretest probability was considered, the incremental cost per additional DVT positive patient was estimated to be €0.450 for Innovance d-dimer assay and €0.753 for Hemosil d-dimer assay. |
| D’Angelo 1996 | Italy; inpatient and outpatient | Prospective cohort; cost-effectiveness analysis | NR (only direct costs of tests were considered) | 6 mo; no discount (time horizon ≤ 1 y) | $ (USD), currency year not specified | 103 patients with suspected DVT; consecutive patients (including low, moderate, and high clinical probability) | Ultrasound alone was compared with d-dimer and compression ultrasound | In patients with a first episode of suspected DVT (n = 66), the cost saving per DVT diagnosed for d-dimer and compression ultrasound vs ultrasound alone was estimated to be 55% in 15 patients with low clinical pretest probability, and 38% in 24 patients with moderate clinical pretest probability, and 5% in 27 patients with high clinical probability. In 37 patients with suspected DVT recurrence, the cost saving per DVT diagnosed was estimated to be 77%. |
| Del Rio Sola 1999 | Spain; emergency department | Prospective cohort; cost-effectiveness analysis | NR | 3 mo; No discount (time horizon ≤ 1 y) | NR | 175 symptomatic patients with suspected DVT; consecutive patients (unselected patients, prevalence unknown) | d-dimer test was compared with no d-dimer test | The diagnosis carried out through a combination of clinical suspicion and high d-dimer levels permits a significant saving of economic resources, insofar as a considerable number of patients, 48% are excluded from further tests. |
| Dryjski 2001 | USA; emergency department | Prospective cohort; cost comparison | NR (only direct costs of tests were considered) | NR, likely a short temporal horizon; no discount (time horizon ≤ 1 y) | $ (USD) in 2000 and 2001 | 114 patients with suspected DVT; Consecutive patients (unselected patients, prevalence unknown) | The strategies compared were: (1) global pretest probability, direct venous duplex imaging for high-risk patients, and d-dimer for low-risk and moderate-risk patients, with selective venous duplex imaging for low- and moderate-risk patients having positive d-dimer results; (2) direct venous duplex imaging for all. | This study proposed a screening strategy: for high-risk patients, use direct venous duplex imaging (no d-dimer); for low-risk or moderate-risk patients, obtain d-dimer, and if it is positive, use venous duplex imaging, and if it is negative, no further action is required. The estimated average cost was $170.50 for this strategy, and $202.00 for the strategy using direct venous duplex imaging for all. |
| Goodacre 2006 | UK; National Health Service | Decision analytic model (decision tree); cost utility analysis | UK National Health Service and personal social service perspectives | Lifetime horizon; 3.5% for both costs and benefits | £ in 2003/04 | Hypothetical patients suspected to have DVT; consecutive patients (unselected patients, prevalence unknown) | Thirty-one algorithms including Wells score, d-dimer, ultrasound were compared: (1) algorithm 1, a “no testing, no treatment” alternative; (2) algorithms 2, 3, 4, 5, 6, 7, 8, 14, 17, and 18 require all patients to have ultrasound; algorithms 9, 10, 11, 12, 15, 16, 20, 22, 23, 24, 27, and 28 discharge on the basis of a combination of Wells score and d-dimer; (3) algorithms 19, 26, 29, and 30 discharge on the basis of negative plethysmography and d-dimer; (4) algorithm 21 discharges on the basis of a low Wells score alone; (5) algorithms 13 and 25 discharge on the basis of negative d-dimer alone; (6) algorithm 31 discharges on the basis of a combination of Wells score and plethysmography. | Algorithm 20 had the greatest net benefit. Two algorithms (9 and 10) also had a consistently high net benefit regardless of the threshold used. All of these algorithms used d-dimer and Wells score as an initial screening tool, before progressing to ultrasound with repeat. At the thresholds for willingness to pay recommended by the National Institute for Clinical and Healthcare Excellence (£20 000-£30 000 per QALY), the optimal strategy was to discharge patients with a low or intermediate Wells score and negative d-dimer, limiting ultrasound to those with a high score or positive d-dimer. Strategies using radiological testing for all patients were only cost-effective at £40 000 per QALY or more. |
| Heijboer 1992 | Netherlands; outpatients with clinically suspected DVT | Cross-sectional study; cost-effectiveness analysis | NR (only direct costs of tests were considered) | NR, likely a short temporal horizon; no discount (time horizon ≤ 1 y) | ECU, currency year not specified | 474 outpatients with a clinically suspected first episode of acute DVT of the leg; consecutive patients (unselected patients, prevalence unknown) | The following strategies were compared: (1) combination of d-dimer test and impedance plethysmography; (2) combination of d-dimer test and real-them ultrasound; (3) serial impedance plethysmography; (4) serial ultrasound. | For the cost per diagnosis, combination strategy of d-dimer test and impedance plethysmography had comparable cost (ECU 435) with serial impedance plethysmography (ECU 415). Similarly, the combination d-dimer test and real-time ultrasound had similar cost per diagnosis (ECU 695) with serial ultrasound (ECU 729). |
| Hendriksen 2015 | Netherlands; primary care | Decision analytic model (Markov model); cost utility analysis/ cost minimization analysis | NR (only direct costs were considered) | 10 y; 4% for cost and 1.5% for outcomes | € in 2010 | Hypothetical patients suspected to have DVT; 13.57% | The following strategies were compared: (1) triage POC test; (2) cardiac POC test; (3) Mycocard POC test; (4) simplify POC test; (5) laboratory strategy (hospital-based laboratory testing); (6) hospital strategy, referral to hospital for further testing for all patients. | The laboratory strategy led to 6.986 QALYs at the cost of €8354 per patient. This study found all point of care d-dimer strategies led to similar health outcomes as the laboratory strategy, but the point of care d-dimer tests were cost-saving (Simplify d-dimer: €-155.37; Nycocard d-dimer: €-56.43; Cardiac d-dimer: €-83.20; Triage d-dimer: €-16.87; and hospital strategy: €113.59). |
| Michiels 1999 | Netherlands; outpatient | Decision analytic model; cost comparison | NR (indirect cost considered) | NR, likely a short temporal horizon; no discount (time horizon ≤ 1 y) | fl., currency year not specified | Hypothetical patients suspected to have DVT; consecutive patients (unselected patients, prevalence unknown) | Consensus strategy of serial compression ultrasound was compared with d-dimer test. | The total diagnosis cost per 15 million inhabitants in the Netherlands was estimated to be fl. 13.4 million for the consensus strategy of serial compression ultrasound, and fl. 8.7 million for the d-dimer before compression ultrasound. This led to cost-saving of fl. 4.7 million annually when only direct costs were considered, and fl. 15 to 20 million when indirect costs were also considered. |
| Norlin 2010 | Sweden; emergency department | Decision analytic model; cost-effectiveness analysis | Societal perspective (in a Swedish setting) | NR, likely a short temporal horizon; no discount (time horizon ≤ 1 y) | € in 2008 | 357 suspected cases of DVT at emergency departments; consecutive patients (unselected patients, prevalence unknown) | The following strategies were compared: (1) compression ultrasound and/or contrast venography for all patients; (2) Wells score with d-dimer (to rule out low probability patients); (3) d-dimer with Wells score (to rule out low probability patients). | The total cost per patient was estimated to be €581 for the traditional strategy of compression ultrasound and/or contrast venography was €406 for the pretest probability and d-dimer strategy, and €421 for the strategy with reversed order combination (d-dimer then pretest probability). |
| Novielli 2013 | UK; setting not specified | Decision analytic model (decision tree and Markov model); cost-effectiveness analysis | Unclear | NR, likely a short temporal horizon; no discount (time horizon ≤ 1 y) | £, currency year not specified | Hypothetical patients suspected to have DVT; unselected, prevalence unknown | Three strategies were compared: (1) combination strategies of Wells score and d-dimer; (2) no test, treat all; (3) no test, treat none. | Assuming the diagnostic performance of the 2 tests to be independent, the strategy “Wells score moderate/high risk treated for DVT and Wells score low risk tested further with d-dimer” was identified as the most cost-effective at the £20 000 willingness-to-pay threshold (probability cost-effective 0.8). When performance dependence is modeled, the most cost-effective strategies were “d-dimer alone” and “Wells score low/moderate risk discharged and Wells score high risk further tested with d-dimer” (probability cost-effective 0.4). |
| Perone 2001 | Switzerland; inpatient and outpatient | Decision analytic model (decision tree); cost utility analysis | NR (only direct costs were considered) | 3 mo; no discount (time horizon ≤ 1 y) | $ (USD) in 1996 | Hypothetical patients suspected to have DVT; 24% | The following strategies were compared: (1) no treatment; (2) serial ultrasound; (3) serial ultrasound with d-dimer; (4) risk-based serial ultrasound; (5) d-dimer with risk-based single ultrasound. | Compared with no treatment, the 4 strategies led to similar effectiveness, saving 4.6 to 4.8 lives per 1000 patients. But the costs of 4 strategies differed. The most expensive strategy was serial ultrasound strategy ($1482 per patient), then serial ultrasound with d-dimer ($1425 per patient), followed by risk-based serial ultrasound ($1402), and d-dimer with risk-based single ultrasound ($1200). The ICER, indicated by incremental cost per additional QALY, was estimated to be $10 716, $10 281, $10 090, and $8897 per QALY for serial ultrasound, serial ultrasound with d-dimer, risk-based serial ultrasound, and d-dimer with risk-based single ultrasound. |
| Reardon 2019 | Canada; emergency department | Retrospective cohort; cost comparison | NR (only direct costs were considered) | 30 d; no discount (time horizon ≤ 1 y) | Can$, currency year not specified | 972 patients presenting to emergency department with suspected DVT; consecutive patients (unselected patients, prevalence unknown) | Three strategies were compared: (1) conventional cutoff value 500 ng/mL; (2) age-adjusted cutoff (age*10); (3) absolute cutoff value 1000 ng/mL. | The conventional cutoff of <500 ng/mL demonstrated a sensitivity of 100% (95% confidence interval [CI], 94.3-100) and a specificity of 35.6% (95% CI, 32.5-38.8). Both age-adjusted cutoff strategy and absolute cutoff value of 1000 ng/mL had maintained the high sensitivity while improved specificity (age-adjusted cutoff: 49.9% [95% CI, 46.7-53.3]; absolute cutoff value 1000 ng/mL, 66.3% [95% CI, 63.2-69.4]). Both the 1000 ng/mL cutoff and the age-adjusted cutoffs were cost-saving compared with the conventional approach (cost saving per patient for age-adjusted cutoff: Can$79; Absolute cutoff value 1000 ng/mL: Can$172). |
| Ultrasound | ||||||||
| Bendayan 1991 | France; hospitalized and ambulatory patients | Prospective cohort; cost-effectiveness analysis | NR (only direct costs were considered) | 6 mo; no discount (time horizon ≤ 1 y) | FF; year not specified | 511 consecutive patients suspected of DVT of the lower limbs; consecutive patients (unselected patients, prevalence unknown) | The following strategies were compared: (1) clinical; (2) echography followed by plethysmography; (3) echography followed by plethysmography and venography; (4) contrast venography. | The total costs were 8276110 FF, 2127362 FF, 2286793 FF, and 2893404 FF, and 2893404 FF for clinical strategy, echography followed by plethysmography strategy, echography followed by plethysmography and venography strategy, and contrast venography. Health outcomes were not compared. |
| Hillner 1992 | USA; ambulatory patients | Decision analytic model (decision tree and Markov model); cost-effectiveness analysis | Unclear | 3 mo; no discount (time horizon ≤ 1 y) | $ (USD) in 1990 | Hypothetical patients suspected to have lower extremity DVT; 10% for calf DVT and 30% for thigh DVT | In total, 24 strategies were compared: treat none or treat all, venography first, 1 noninvasive test, 2 noninvasive tests, or 3 noninvasive tests. | This analysis revealed that the optimal approach was to perform real-time ultrasound followed by anticoagulation therapy if DVT is found. This approach was both effective and cost saving compared with no testing or treatment. Serial follow-up studies of patients whose initial study suggested no DVT saved additional lives, but at a cost of $390 000 per each additional life saved for patients with one follow-up study and $3.5 million per each additional life saved for patients with a second follow-up study. |
| Hull 1995 | Canada; regional thromboembolism program | Prospective cohort; cost minimization analysis | NR (only direct costs were considered) | 3 mo; no discount (time horizon ≤ 1 y) | $ (USD), Can$ in 1992 | 516 patients referred to a regional thromboembolism program with a first episode of clinically suspected DVT; consecutive patients (unselected patients, prevalence unknown) | The following strategies were compared: (1) serial Doppler ultrasound; (2) serial impedance plethysmography; (3) combined Doppler ultrasound and serial impedance plethysmography. | Outpatient diagnosis using noninvasive testing was the most cost effective. Serial Doppler ultrasound is more costly (Can $618 265, US$1 326 180) than serial impedance plethysmography (Can$527 165, US$1 052 880), and combined Doppler ultrasound and serial impedance plethysmography (Can$551 065, US$1 124 580). |
| Kim 2000 | USA; inpatient | Decision analytic model (Markov model); cost utility analysis | Medicare charges | Lifetime horizon; 3% for both cost and effectiveness | $ (USD) in 1996 | Hypothetical 65-y-old male patients suspected to have DVT; 31.8% | Six initial strategies were considered: (1) unilateral examination of the common femoral and popliteal veins; (2) unilateral examination of the common femoral, popliteal, and femoral veins; (3) bilateral examination of the common femoral and popliteal veins; (4) bilateral examination of the common femoral, popliteal, and femoral veins; (5) complete unilateral examination of symptomatic leg (including calf veins); (6) complete bilateral examination of both legs Five follow-up strategies of popliteal vein within 5 d: 1) no initial treatment and no follow-up testing; 2) unilateral examination of the popliteal vein; 3) unilateral examination of the common femoral and popliteal veins; 4) unilateral examination of the common femoral, popliteal, and femoral veins; 5) bilateral limited examination of the common femoral and popliteal veins | For 65-y-old men with unilateral symptoms of DVT, the most effective strategy was bilateral examination of the common femoral and popliteal veins, anticoagulation therapy in patients with proximal DVT, and follow-up bilateral examination of the common femoral and popliteal veins in patients without an initial diagnosis of DVT. This strategy had an incremental cost-effectiveness ratio of $39 000 per quality-adjusted life year gained compared with strategy of unilateral common femoral, popliteal examination and no follow-up. |
| Samuel 2019 | USA; major academic tertiary care medical center | Quasi-experimental study; cost-effectiveness analysis | NR (only direct costs were considered) | 14 d; no discount (time horizon ≤ 1 y) | $ (USD), currency year not specified | 157 adults underwent cranial or spinal surgical interventions; high-risk patients who present with brain injury and require surgical interventions | Routine ultrasound screening was compared with standard screening. | For diagnostic performance, detecting 1 DVT required 6 vs 27 ultrasound screening studies in the standard screening and the routine screening group, respectively. Total cost incurred per DVT diagnosis was lower for the standard screening approach ($13 664) versus the routine screening approach ($56 525). |
| Wilson 2005 | USA; inpatient stroke rehabilitation unit | Decision analytic model (decision tree); cost utility analysis | Societal | 4 y (life expectancy of those with ischemic stroke); no discount | $ (USD) in 2004 | Hypothetical patients with ischemic stroke at the time of admission to rehabilitation at risk of DVT; 12% | Two strategies were compared: (1) screening all patients with acute ischemic stroke for DVT by Doppler ultrasound; (2) clinical surveillance for signs of DVT and treatment after confirmation by Doppler ultrasound. | The expected health outcomes were 1.875 QALYs for ultrasound screening strategy and 1.872 QALYs for no screening strategy. The expected cost per patient was $330 for ultrasound screening strategy, compared with $162 for no screening. The ICER was estimated to be $67 200 per QALY gained. |
| Other | ||||||||
| Fuentes 2016 | Spain; hospital emergency room | Cross-sectional study; cost-effectiveness analysis | NR (only direct costs were considered) | NR, likely a short temporal horizon; no discount (time horizon ≤ 1 y) | € in 2013 | 138 patients with symptoms of a first episode of DVT; consecutive patients (unselected patients, prevalence unknown) | The following strategies were compared: (1) current approach; (2) Oudega clinical probability algorithm; (3) Wells clinical probability algorithm. | Compared with current approach, the cost saving per patient was estimated to be €86.19 for Oudega clinical probability algorithm, and €97.40 for Wells clinical probability algorithm. |
| Hedderich 2019 | USA; emergency department | Decision analytic model (decision tree); cost utility analysis | US health care perspective | Lifetime horizon; 3% for both cost and effectiveness | $ (USD) in 2017 | Hypothetical patients admitted to the emergency department for possible CVT; low (1.6%) and high (50%) | The following strategies were compared: (1) NCCT; (2) NCCT plus CTV; (3) routine MRI; (4) routine MRI plus MRV. | Two strategies, NCCT and NCCT plus CTV were dominant over routine MRI and routine MRI plus MRV. NCCT plus CTV led to more QALYs (23.385 QALYs) compared with NCCT (23.374 QALYs), but also are more costly ($5210 for NCCT plus CTV versus $5057 for NCCT). Probabilistic sensitivity analysis found that CTV was the strategy with the highest percentage of cost-effective iterations if willingness-to-pay (WTP) thresholds were higher than $13 750/QALY. |
| Van Dam 2021 | Netherlands and Norway; emergency department | Decision analytic model; cost-effectiveness analysis | NR (only direct costs were considered) | 1 y; no discount (time horizon ≤ 1 y) | € in 2019 | Adult patients with suspected recurrent ipsilateral proximal DVT of the lower extremity on or off anticoagulant treatment; 43% (for recurrent DVT) | 13 diagnostic scenarios: (1) MRDTI only; (2) ultrasound (normal/abnormal) only; (3) ultrasound (positive/negative/inconclusive) only; (4) only ultrasound (normal/abnormal) in case of a likely clinical decision rule and/or abnormal D-dimer; (5) only ultrasound (positive/negative/inconclusive) in case of a likely clinical decision rule and/or abnormal D-dimer; (6) only MRDTI in case of an abnormal ultrasound; (7) only MRDTI in case of an inconclusive ultrasound; (8) only MRDTI in case of a likely clinical decision rule and/or abnormal D-dimer; (9) only MRDTI in case of a likely clinical decision rule and/or abnormal D-dimer and an abnormal ultrasound; (10) MRDTI in case of a likely clinical decision rule and/or abnormal D-dimer and an inconclusive ultrasound; (11) Clinical decision rule and d-dimer; (12) treat all; (13) treat none | Total 1-y health care costs (€) per person and total mortality per 10 000 patients (1) MRDTI only: €1,271 and 18 deaths per 10 000 patients; (2) ultrasound (normal/abnormal) only: €1529 and 14 deaths per 10 000 patients; (3) ultrasound (positive/negative/inconclusive) only: €1378 and 15 deaths per 10 000 patients; (4) only ultrasound (normal/abnormal) in case of a likely clinical decision rule and/or abnormal D-dimer: €1365 and 16 deaths per 10 000 patients; (5) only ultrasound (positive/negative/inconclusive) in case of a likely clinical decision rule and/or abnormal D-dimer: €1278 and 17 deaths per 10 000 patients; (6) only MRDTI in case of an abnormal ultrasound: €1296 and 18 deaths per 10 000 patients; (7) only MRDTI in case of an inconclusive ultrasound: €1263 and 16 deaths per 10 000 patients; (8) only MRDTI in case of a likely clinical decision rule and/or abnormal D-Dimer: €1230 and 19 deaths per 10 000 patients; (9) only MRDTI in case of a likely clinical decision rule and/or abnormal D-Dimer and an abnormal ultrasound: €1260 and 19 deaths per 10 000 patients; (10) MRDTI in case of a likely clinical decision rule and/or abnormal D-dimer and an inconclusive ultrasound: €1219 and 17 deaths per 10 000 patients; (11) clinical decision rule and d-Dimer: €1654 and 14 deaths per 10 000 patients; (11) treat all: €2004 and 10 deaths per 10 000 patients; (13) treat none: 1239 and 104 deaths per 10 000 patients. Strategies with MRDTI for suspected recurrent ipsilateral DVT decreased 1-y health care costs compared with strategies without MRDTI, with similar impact on mortality. |
| CTPA for both PE and DVT | ||||||||
| Henschke 1994 | USA; not specified | Not specified (likely decision analytic model); cost-effectiveness analysis | NR (only direct cost of tests was considered) | NR, likely a short temporal horizon; no discount (time horizon ≤ 1 y) | $ (USD), currency year not specified | Hypothetical patients suspected with pulmonary embolism and DVT; unselected, prevalence unknown | Five strategies were compared: (1) angiogram; (2) radionuclide venography; (3) contrast venography; (4) sonography with Doppler; (5) radionuclide V/Q scan. | Effective cost, the money spent per unit of diagnostic information, was defined as the ratio of the expected direct test cost to its diagnostic performance. The effective cost was lowest for Doppler sonography, estimated to be between $378 and $486, followed by radionuclide leg venography ($843). The effective cost was estimated to be between $1557 and $2001 for contrast venography and $2061 for angiography, whereas the effective cost for radionuclide with V/Q scan depends on the prevalence of pulmonary embolism and morbidity and mortality cost. |
Abbreviations: MRV, magnetic resonance venography; NCCT, noncontrast computed tomography; NR, not reported; POC, point-of-care.
Currencies: Can$, Canadian dollar; €, Euros; ECU, European currency unit; FF, France franc; fl., Dutch guilders; £, UK Sterling; $, USD
In total, 37 studies used decision analysis or decision analytic model strategy to assess the cost-effectiveness of alternative strategies. Of these 37 reports, 34 considered both diagnosis and treatment-related costs, but 3 reports considered only diagnosis related costs. However, only 10 of these 37 reports considered a time frame longer than 1 year, so for most of the analyses neither costs nor health outcomes were discounted because of the short time horizon. Only 10 studies used cost per quality adjusted life-year as the indication of cost-effectiveness. Although 2 studies used diagnostic accuracy as the outcome, the other studies used diagnostic accuracy information as the model inputs. As for the trustworthiness of clinical evidence, only 8 studies were based on systematic reviews or meta-analyses, and 20 studies based on “literature review” or “literature.” Table 3 summarizes the study limitation of model-based analyses.
Limitation of included model-based analyses
| Study | Does the model structure adequately reflect the nature of the health condition? | Is the time horizon sufficiently long to reflect all important differences in cost and outcomes? | Are all important and relevant health outcomes considered? | Are the clinical inputs obtained from the best available sources? | Are all important and relevant costs included in the analysis? | Are the estimates and unit costs of resource use obtained from best available sources? | Is an appropriate incremental analysis presented or can it be calculated? | Are all important and uncertain parameters subjected to appropriate analysis? | Is there a potential conflict of interest? | Overall judgment |
|---|---|---|---|---|---|---|---|---|---|---|
| DVT | ||||||||||
| Duriseti 2010 | Probably yes | Yes (25 y) | Yes | Probably yes (literature review) | Yes | Probably yes | No (conducted but not reported) | Yes | Probably no (governmental/public funding) | Potentially serious limitation |
| Goodacre 2006 | Probably yes | Yes (lifetime horizon) | Yes | Yes (systematic review and meta-analysis) | Yes | Probably yes | Yes | Yes | Probably no (governmental/public funding) | Minor limitation |
| Hedderich 2019 | Probably yes | Yes (lifetime horizon) | Yes | Probably yes (literature) | Yes | Probably yes | Yes | Yes | Probably no (no funding) | Minor limitation |
| Hendriksen 2015 | Probably yes | Probably yes (10 y) | Probably yes | Yes (Systematic review and meta-analysis) | Yes | Probably yes | Yes | Yes | Probably no (governmental/public funding) | Minor limitation |
| Hillner 1992 | Probably yes | Probably no (3 mo) | Probably yes | Probably yes (literature) | Yes | Probably yes | Probably yes (cost per life saved) | Probably yes (only deterministic sensitivity analysis) | Unclear | Potential serious limitation |
| Kim 2000 | Probably yes | Yes (lifetime horizon) | Yes | Yes (systematic review and meta-analysis) | Yes | Probably yes | Yes | Probably yes (only deterministic sensitivity analysis) | Unclear | Potential serious limitation |
| Norlin 2010 | Probably yes | Probably no (likely a short temporal horizon) | Probably no (only diagnostic performance) | Probably yes (prospective cohort) | Yes | Probably yes | No | Probably yes (only deterministic sensitivity analysis) | Probably no (declaring no conflict interest) | Potential serious limitation |
| Novielli 2013 | Probably yes | Probably no (likely a short temporal horizon) | Probably no (only diagnostic performance) | Yes (systematic review and meta-analysis) | Unclear | Unclear | No (conducted but not reported) | Yes | Probably no (governmental/public funding) | Potential serious limitation |
| Paterson 2001 | Probably yes | Probably no (3 mo) | Probably no (only survival) | Probably yes (literature) | Yes | Probably yes | Probably yes (cost per life saved) | Probably yes (only deterministic sensitivity analysis) | Probably no (governmental/public funding) | Potential serious limitation |
| Perone 2001 | Probably yes | Probably no (3 mo) | Yes | Probably yes (literature) | Yes | Probably yes | Yes | Probably yes (only deterministic sensitivity analysis) | Probably no (governmental/public funding) | Potential serious limitation |
| Van Dam 2021 | Probably yes | Probably no (1 y) | Yes | Probably yes (prospective cohort and literature) | Yes | Probably yes | No | Probably yes (only deterministic sensitivity analysis) | Probably no (industry-funded project, declaring no conflict interest) | Potential serious limitation |
| Wilson 2005 | Probably yes | Probably yes (4 y, life expectancy of those with ischemic stroke) | Yes | Probably yes (literature) | Yes | Probably yes | Yes | Probably yes (only deterministic sensitivity analysis) | Probably no (no commercial funding) | Minor limitation |
| PE | ||||||||||
| Batalles 2009 | Probably yes | Probably no (likely a short temporal horizon) | Probably no (only diagnostic performance) | Probably yes (literature review) | Yes | Probably yes | Probably yes (cost per additional PE diagnosis) | Probably yes (only deterministic sensitivity analysis) | Probably no (declaring no conflict interest) | Potential serious limitation |
| Blondon 2020 | Probably yes | Yes (lifetime horizon) | Yes | Probably yes (prospective cohorts) | Yes | Probably yes | Yes | Yes | Probably no (governmental/public funding) | Minor limitation |
| Doyle 2004 | Probably yes | Probably no (likely a short temporal horizon) | Probably no (only survival) | Yes (systematic review and meta-analysis) | No (only diagnosis related costs) | Probably yes | Probably yes (cost per life saved) | Probably yes (only deterministic sensitivity analysis) | Unclear | Potential serious limitation |
| Duriseti 2006 | Probably yes | Yes (25 y) | Yes | Probably yes (literature review) | Yes | Probably yes | No (conducted but not reported) | Yes | Probably no (governmental/public funding) | Potential serious limitation |
| Elias 2004 | Probably yes | Probably no (3 mo) | Probably no (only survival) | Probably yes (literature) | Yes | Probably yes | Probably yes (cost per life saved) | Probably yes (only deterministic sensitivity analysis) | Unclear | Potential serious limitation |
| Goodacre 2018 | Probably yes | Yes (Lifetime horizon) | Yes | Yes (systematic review and meta-analysis) | Yes | Probably yes | Yes | Yes | Probably no (governmental/public funding) | Minor limitation |
| Henschke 1997 | Probably yes | Probably no (6 mo) | Probably yes | Probably yes (literature) | Yes | Probably yes | No | No | Unclear | Potential serious limitation |
| Hull 1996 | Probably yes | Probably no (likely a short temporal horizon) | Probably no (only diagnostic performance) | Probably yes (prospective cohort) | Yes | Probably yes | No | Probably yes (only deterministic sensitivity analysis) | Unclear | Potential serious limitation |
| Hull 2001 | Probably yes | Probably no (likely a short temporal horizon) | Probably no (only diagnostic performance) | Probably yes (prospective cohort) | Yes | Probably yes | No | Probably yes (only deterministic sensitivity analysis) | Unclear | Potential serious limitation |
| Humphreys 2004 | Probably yes | Probably no (likely a short temporal horizon) | Probably no (only diagnostic performance) | Probably yes (literature) | No (only diagnosis-related costs) | Probably yes | No | Yes | Unclear | Potential serious limitation |
| Larcos 2000 | Probably yes | Yes (lifetime horizon) | Probably no (only survival) | Probably yes (retrospective review of cases) | Yes | Probably yes | Probably yes (cost per life-year gained) | Probably yes (only deterministic sensitivity analysis) | Unclear | Potential serious limitation |
| Lee 2011 | Probably yes | Probably no (3 mo) | Probably no (only survival) | Probably yes (literature) | Yes | Probably yes | Probably yes (cost per life saved) | Probably yes (only deterministic sensitivity analysis) | Probably no (declaring no conflict interest) | Potential serious limitation |
| Michel 1996 | Probably yes | Probably no (6 mo) | Yes | Probably yes (prospective cohort) | Yes | Probably yes | Yes | Probably yes (only deterministic sensitivity analysis) | Probably no (governmental/public funding) | Potential serious limitation |
| Oudkerk 1993 | Probably yes | Probably no (3 mo) | Probably no (only diagnostic performance) | Probably yes (literature) | Yes | Probably yes | Probably yes (cost per life saved) | Probably yes (only deterministic sensitivity analysis) | Probably no (governmental/public funding) | Potential serious limitation |
| Perrier 1997 | Probably yes | Probably no (3 mo) | Probably no (only survival) | Probably yes (literature) | Yes | Probably yes | Probably yes (cost per life saved) | Probably yes (only deterministic sensitivity analysis) | Probably no (governmental/public funding) | Potential serious limitation |
| Perrier 2003 | Probably yes | Probably no (3 mo) | Yes | Probably yes (literature review) | Yes | Probably yes | Probably yes (cost per life saved) | Probably yes (only deterministic sensitivity analysis) | Probably no (governmental/public funding) | Potential serious limitation |
| Righini 2007 | Probably yes | Probably no (3 mo) | Yes | Probably yes (2 recent outcome studies) | Yes | Probably yes | No | Probably yes (only deterministic sensitivity analysis) | Probably no (governmental/public funding) | Potential serious limitation |
| Toney 2017 | Probably yes | Probably no (30 d) | Probably no (only survival) | Yes (systematic review and meta-analysis) | Yes | Probably yes | No | Probably yes (only deterministic sensitivity analysis) | Probably no (declaring no conflict interest) | Potential serious limitation |
| Van Beek 1996 | Probably yes | Probably no (likely a short temporal horizon) | Probably no (only diagnostic performance) | Probably yes (data on 179 patients) | Yes | Unclear | No | Probably yes (only deterministic sensitivity analysis) | Probably no (declaring no conflict interest) | Potential serious limitation |
| Van Erkel 1996 | Probably yes | Probably no (3 mo) | Probably no (only survival) | Probably yes (literature) | Yes | Probably yes | Probably yes (cost per life saved) | Probably yes (only deterministic sensitivity analysis) | Unclear | Potential serious limitation |
| Van Erkel 1998 | Probably yes | Probably no (3 mo) | Probably no (only survival) | Probably yes (literature) | Yes | Probably yes | Probably yes (cost per life saved) | Probably yes (only deterministic sensitivity analysis) | Unclear | Potential serious limitation |
| Van Erkel 1999 | Probably yes | Probably no (3 mo) | Probably no (only survival) | Yes (systematic review and meta-analysis) | Yes | Probably yes | Probably yes (cost per life saved) | Probably yes (only deterministic sensitivity analysis) | Probably no (governmental/public funding) | Potential serious limitation |
| Ward 2011 | Probably yes | Probably no (6 mo) | Yes | Probably yes (Literature) | Yes | Probably yes | Yes | Probably yes (only deterministic sensitivity analysis) | Probably no (declaring no conflict interest) | Potential serious limitation |
| PE and DVT | ||||||||||
| Henschke 1994 | Probably yes | Probably no (likely a short temporal horizon) | Probably no (only diagnostic performance) | Probably yes (literature) | No (only diagnosis related costs) | Probably yes | No | No | Unclear | Potential serious limitation |
PE
Table 1 summarizes the economic evaluations of diagnosis and screening for PE. Of these studies, 6 did not report the prevalence of PE (pretest probability unknown) and studied the cost-effectiveness among an unselected population. Most of the remaining studies were on patients with intermediate risk of PE, except 1 that evaluated a low-risk population (prevalence of 5%),13 and 1 considered a subgroup of a high-risk population (prevalence of 69%).14
d-dimer in the exclusion of PE
Several cost-effectiveness analyses compared the diagnostic strategies with d-dimer and use of CTPA according to the d-dimer result with other strategies, including no diagnostic testing, or anticoagulant treatment of all patients with suspected PE, or universal CTPA or V/Q scan. In general, the strategy to combine d-dimer with another expensive strategy was suggested to be cost-effective or cost-saving.14-25
V/Q scan
Cost-effectiveness analyses compared V/Q scan with other diagnosis strategies. None of the reports suggested V/Q scan was cost-effective compared with CTPA.13,23,26,27 Another report suggested V/Q scan was cost-effective compared with CT alone,28 with 20.1 additional lives saved per 1000 patients, at a cost of $940 per life-year gained. No evidence on the cost-effectiveness of single-photon emission CT was identified. Other reports suggested that the use of V/Q scan according to the ultrasound or d-dimer results could be cost-effective or cost saving.14-20,29,30
CTPA
The included studies on the cost-effectiveness of CTPA varied in regard to the compared strategy, the setting, the time frame, and the analysis methods. In general, the CTPA strategy was considered effective, mostly associated with improved survival. However, the cost-effectiveness of CTPA was inconclusive.
Batalles et al26 concluded that CTPA was cost-effective compared with pulmonary magnetic resonance imaging (MRI), and was the most effective strategy. A study by van Erkel et al23 found that CTPA reduced mortality and improves cost-effectiveness in the diagnostic workup of suspected PE when compared with other strategies involving combinations of V/Q, ultrasound, d-dimer, and conventional angiography strategies. In Oudkerk,31 the “treatment for all” strategy had the lowest mortality but highest cost. Compared with this treatment for all strategy, pulmonary angiography strategies with or without prior V/Q lung scintigraphy and ultrasound of the legs had comparable low mortality, but also saved costs by ∼40%, and led to inappropriate treatment in fewer than 5% of patients. Paterson et al27 found higher costs for CTPA as the initial diagnostic test but with improved expected survival when compared with a gradual algorithm of V/Q scanning followed by compression ultrasound and CTPA.
Doyle et al13 conducted a study in the United States that included a decision analytic model on diagnostic tests of PE in women to determine which strategy is the most cost-effective with the least number of deaths from PE. Of the strategies compared (ultrasound, V/Q scan, and spiral CT), spiral CT as the initial diagnostic regimen was found to be the most cost-effective at $17 208 per life saved (2004). Other studies concluded CTPA was not cost-effective compared with ultrasound,32 or compared with single-photon emission CT33 but some reports suggested that the use of CTPA based on ultrasound or d-dimer results could be cost-effective or cost saving.14,19-22,29,30,34
DVT
Table 2 summarizes the economic evaluations of diagnosis and screening for DVT. Of these studies, 13 did not report the prevalence of DVT (pretest probability unknown) and studied the cost-effectiveness among an unselected population. Most of the remaining studies were on patients with intermediate risk of DVT, except 2 studies included a low-risk population (prevalence no higher than 10%) and a high-risk population (prevalence of 50% or higher).35,36
d-dimer in the exclusion of DVT
We identified reports on the cost-effectiveness of pretest probability combined with d-dimer testing and ultrasound. For all the included studies, d-dimer, followed by ultrasound is either cost-effective or cost saving.35,37-42 We were unable to identify studies comparing the whole leg ultrasound vs proximal compression ultrasound after d-dimer testing.
Ultrasound
One health technology assessment39 report compared 31 strategies including pretest probability assessment using the Wells’ score, d-dimer, ultrasound, compared with a “no testing, no treatment” alternative. The optimal strategy for DVT diagnosis is to use ultrasound selectively in patients with a high clinical pretest probability or positive d-dimer. Radiological testing for all patients does not appear to be a cost-effective use of health service resources.
Hull et al43 reported a cost-effectiveness analysis derived from a prospective study. The researchers concluded that compared with clinical diagnosis, outpatient diagnosis using noninvasive testing was the most cost-effective strategy. Serial Doppler ultrasound is more costly than serial impedance plethysmography. Combined Doppler ultrasound and serial impedance plethysmography offers a less costly strategy than serial ultrasound alone.
Recurrent VTE
We identified 1 model-based cost-effectiveness analysis on the diagnosis of recurrent ipsilateral DVT.44 This analysis compared different diagnostic strategies including a clinical decision rule, d-dimer test, compression ultrasound, and magnetic resonance direct thrombus imaging (MRDTI). The analysis was based on a prospective cohort with 234 patients and the prevalence of recurrent DVT was 43%. According to this analysis, strategies with MRDTI for suspected recurrent ipsilateral DVT decreased 1-year health care costs compared with strategies without MRDTI, with similar impact on mortality. However, this analysis did not consider the long-term impact on the costs and outcomes.44
Other results not included in the guideline development
Discussion
Study findings
This systematic review summarizes the economic evaluation evidence for VTE diagnosis until March 2021. For PE, diagnostic strategies including d-dimer to exclude PE were cost-effective compared with strategies without d-dimer testing. Strategies with CTPA alone were associated with improved survival, but not necessarily cost-effective when compared with combination strategies including d-dimer testing. The cost-effectiveness of CTPA in relation to V/Q scan was inconclusive, but CTPA or V/Q scan following ultrasound or d-dimer results could be cost-effective or even cost saving. For DVT, strategies with d-dimer and/or ultrasound were cost-effective. These results on d-dimer test supported the ASH clinical practice guideline recommendation that for patients at low (unlikely) VTE risk, using d-dimer as the initial test reduces the need for diagnostic imaging. Our systematic review also supported the recommendations of V/Q scans and CTPA for PE diagnosis and ultrasound for DVT diagnosis. Notably, for both PE and DVT, most of the included studies assessed the cost-effectiveness in unselected populations, and the prevalence of VTE and pretest probability of the population is unknown.
Although most of the studies considered clinical outcomes rather than diagnostic accuracy outcomes only, our confidence in the systematic review results is limited by a short follow-up duration of shorter than a year (3 months in most studies). An appropriate time horizon in the economic evaluation needs to be long enough to notice a difference between strategies of interest and 3 months may be insufficient.
Furthermore, all except 1 of the economic evaluations considering sequential testing strategies identified in the systematic review assumed the performance independency of tests. However, it is highly likely when multiple tests are used for diagnosis, the tests will not perform independently. For example, in a sequential combination of 2 tests, the performance of the second test may differ depending on the results of the first test. Failing to account for this performance independency may lead to biased estimates for diagnostic accuracy outcomes, which will eventually lead to biased cost-effectiveness results.41 Another issue arising from complex sequential testing strategies is that each one of the research questions in the guideline considered 1 specific diagnostic test, but the economic evidence might have assessed diagnostic tests in a sequential testing strategy. This mismatch between the research questions and the available evidence further compromised our confidence in the systematic review results to provide high-quality economic evidence to support the guideline recommendation.
Strengths and limitations
Strengths of our systematic review include that this is a comprehensive systematic review to summarize available economic evidence on the diagnosis of VTE. The scope of this systematic review is broad, and not limited to the scope of the guideline recommendations.
Nevertheless, we were limited in that we could not provide economic evidence stratified by pretest probability of VTE. We only identified limited economic evidence on diagnosis of recurrent VTE. Our systematic review was also limited by study limitations of included studies, for example, the follow-up and low quality of model inputs. The follow-up was limited as most of the included studies had a short follow-up duration. Moreover, though false-negative cases could be detected, these studies were inadequate in following up with individuals with false-positive results. Only a few of the included studies used systematic reviews as the basis for model input. Clinical evidence based on unsystematic methods is less trustworthy. Furthermore, we did not assess the quality of evidence in economic evaluations because of a lack of guidance on this topic. The findings should be interpreted with caution, given the limits of the methodology in this field.
Implications for research
Our systematic review also revealed a mismatch between what is needed and what is available in cost-effectiveness evidence. None of the included studies considered the cost-effectiveness of diagnostic strategies stratified by pretest probabilities of VTE and there is a lack of evidence on the diagnosis of recurrent VTE. Further studies on these questions are warranted. The methodology on systematic review of economic evidence has yet to be developed and future Grading of Recommendations Assessment, Development, and Evaluation endeavors are necessary to provide guidance on how to assess quality of evidence on model-based cost-effectiveness analyses and how to use the information, especially when there may be more than 1 study and quantitively pooling may not be feasible.49
Implications for practice
Our systematic review supported the recommendations on the diagnosis of VTE made by ASH, including recommendations of starting with d-dimer for assessment of patients at low pretest probability of VTE, and recommendations of V/Q scans and CTPA for PE diagnosis and ultrasound for DVT diagnosis.1 Together with the guideline recommendations, our systematic review may facilitate the adoption of timely and cost-effective diagnostic testing for patients suspected of VTE. Moreover, there could be cost savings or offset by avoiding unnecessary diagnostic imaging.
Conclusion
Through systematic review, we summarized economic evidence on the diagnosis and screening of VTE to support the ASH guidelines for the diagnosis of VTE.
Acknowledgments
This systematic review was conducted to support the development of the American Society of Hematology 2018 guidelines for management of venous thromboembolism: diagnosis of venous thromboembolism.
The entire guideline development process was funded by the American Society of Hematology. Through the McMaster GRADE Center, some researchers received salary (W.W. and H.B.) or grant support (R.A.M. and H.J.S.), and others participated to fulfill requirements of an academic degree or program or volunteered their time.
Authorship
Contribution: Y.Z. and H.J.S. designed the study; Y.Z., H.A.B., H.G., I.E.-I., G.P.M., R.K., R.N., C.D., and W.W. screened the literature and/or abstracted the data; Y.Z. and H.A.B. drafted the manuscript; H.J.S., W.W., and R.N. coordinated the overall project; H.J.S. is cochair of the GRADE working group and was the principal investigator for this project; W.W., W.L., R.A.M., and H.J.S. contributed to the interpretation of the results and critical revision of the report; and all authors read and approved the final version of the manuscript.
Conflict-of-interest disclosure: The authors declare no competing financial interests.
Correspondence: Yuan Zhang, Department of Health Research Methods, Evidence, and Impact, McMaster University, 1280 Main St W, Hamilton, ON L8S 4K1; e-mail: zhang243@mcmaster.ca.

