

Key Points
MM cells suffer from proteotoxicity and depend on NRF1, the master regulator of proteasome stress response, for survival.
KO of NRF1 or its activating protease DDI2 is cytotoxic in myeloma and overcomes de novo and acquired PI resistance.

Abstract
Multiple myeloma (MM) cells suffer from baseline proteotoxicity as the result of an imbalance between the load of misfolded proteins awaiting proteolysis and the capacity of the ubiquitin-proteasome system to degrade them. This intrinsic vulnerability is at the base of MM sensitivity to agents that perturb proteostasis, such as proteasome inhibitors (PIs), the mainstay of modern-day myeloma therapy. De novo and acquired PI resistance are important clinical limitations that adversely affect prognosis. The molecular mechanisms underpinning PI resistance are only partially understood, limiting the development of drugs that can overcome it. The transcription factor NRF1 is activated by the aspartic protease DNA damage inducible 1 homolog 2 (DDI2) upon proteasome insufficiency and governs proteasome biogenesis. In this article, we show that MM cells exhibit baseline NRF1 activation and are dependent upon DDI2 for survival. DDI2 knockout (KO) is cytotoxic for MM cells, both in vitro and in vivo. Protein structure-function studies show that DDI2 KO blocks NRF1 cleavage and nuclear translocation, causing impaired proteasome activity recovery upon irreversible proteasome inhibition and, thereby, increasing sensitivity to PIs. Add-back of wild-type, but not of catalytically dead DDI2, fully rescues these phenotypes. We propose that DDI2 is an unexplored promising molecular target in MM by disrupting the proteasome stress response and exacerbating proteotoxicity.
Introduction
Multiple myeloma (MM) is the second most common hematologic malignancy of the western world and remains incurable.1 Proteasome inhibitors (PIs) have significantly improved survival of patients with MM; however, de novo resistance can occur, and acquired resistance is common, leading to disease relapse and patient demise.2 The proteasome is an ATP-dependent multicatalytic protease that is responsible for the degradation of senescent and/or misfolded proteins tagged via polyubiquitin chains.3 The proteasome is composed of a 19S cap at 1 or both ends of a barrel-shaped 20S catalytic core. The 19S subunits have a regulatory function, mediating recognition, binding, and unfolding of cargo proteins and triggering the opening of the 20S gate ahead of cargo protein translocation and degradation.4 The 20S core contains 3 distinct catalytic subunits, β1, β2, and β5, that provide caspase-like (CT-L), trypsin-like, and chymotrypsin-like proteolytic activity, respectively.5 Three PIs are approved by the US Food and Drug Administration for MM: bortezomib, carfilzomib and ixazomib. Although carfilzomib is an irreversible epoxyketone-based PI, bortezomib and ixazomib are reversible boronic acid inhibitors, with the latter being the only orally bioavailable PI.6 All 3 PIs target the CT-L proteasome activity. There are no known predictive factors of PI response in the clinic, and therapeutic strategies to overcome PI resistance are urgently needed to improve survival for patients with MM.7 Recently, the protease inhibitor nelfinavir was shown to overcome acquired PI resistance in preclinical studies by triggering retention of proteins in the endoplasmic reticulum (ER), thus triggering the unfolded protein response.8 In clinical trials, nelfinavir was remarkably effective in overcoming PI resistance in patients who were refractory to bortezomib, suggesting that concurrent targeting of multiple proteostasis mechanisms has therapeutic utility in MM.9
We previously showed that MM cells suffer from baseline proteotoxic stress and that the imbalance between polyubiquitylated (polyUb) proteins and proteasome activity determines PI sensitivity.10 Preconditioning of MM cells with sublethal doses of PI leads to increased proteasome activity and acquisition of PI resistance.10 The proteasome stress response (PSR) is an evolutionarily conserved homeostatic mechanism that is triggered by insufficient proteasome activity, such as secondary to PI treatment.11-13 Through the PSR, cells induce de novo proteasome biogenesis and restore protein homeostasis.14,15 The transcription factor nuclear factor erythroid 2 like 1 (NFE2L1 or NRF1) is the PSR master regulator and an essential gene in mammals.16 Under homeostatic conditions, NRF1 is constitutively synthesized and imported into the ER, glycosylated, retrotranslocated to the cytosol, and targeted for proteasomal degradation via p97/VCP-mediated ER-associated degradation (Figure 1A, left panel).17 However, when proteasome activity is insufficient, cytosolic NRF1 is deglycosylated by N-glycanase 1 (NGLY1), proteolytically cleaved by the aspartic protease DNA damage inducible 1 homolog 2 (DDI2) and translocated to the nucleus to induce a complex transcriptional program, including proteasome subunit genes (Figure 1A, right panel).18,19 We hypothesize that targeting PSR may be of therapeutic utility in MM, based on its high dependency on proteasome function, and could overcome PI resistance.10 Supporting this hypothesis, pharmacological inhibition of NGLY1 in eukaryotic cells was recently shown to sensitize mammalian cells to PI-mediated cytotoxicity.20
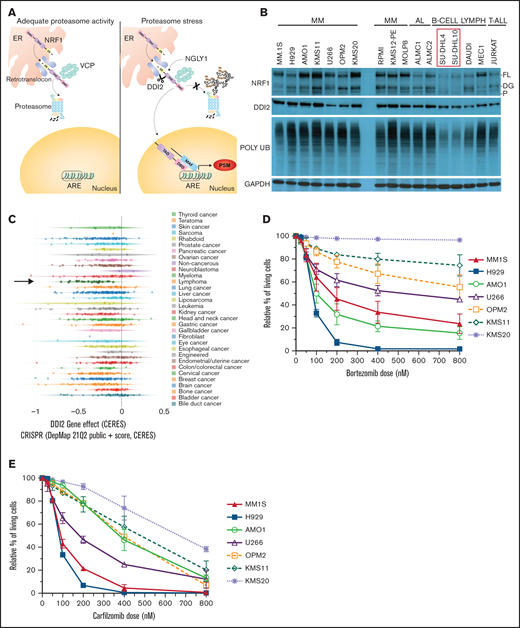
MM is dependent on DDI2/NRF1 for survival. (A) NRF1 processing in the face of adequate (left panel) or inadequate (right panel) proteasome activity. The ER localization domain, transactivating domain (TAD), and DNA binding domain (DBD) of NRF1, as well as deglycanase NGLY1, aspartic protease DDI2 and p97/VCP, are shown. Cleaved NRF1 translocates to the nucleus where it dimerizes with small MAF proteins, binds to antioxidant responsive elements (ARE), and induces transcription of proteasome subunit genes (PSM). (B) Western blot showing full length (FL), deglycosylated (DG), and processed (P) NRF1 (top blots); DDI2 (second blot); and polyUb proteins (third blot) across a panel of MM, AL amyloidosis (AL), B cell lymphoma (B-CELL LYMPH), and T acute lymphoblastic leukemia (T-ALL) cell lines. In comparison with SU-DHL4 and SU-DHL10 cell lines (red box), all other cell lines are characterized by higher polyUb protein accumulation and increased expression of NRF1. GAPDH served as a loading control (bottom blot). (C) CERES score for DDI2 across 342 cancer cell lines assessed via genomic CRISPR screening as part of the DepMap project. Using this approach, a CERES score of −1 identifies an essential gene. MM (green stars indicated by a black arrow) is the cancer cell type that is most highly dependent on DDI2. (D-E) Relative percentage of living cells (Annexin V− and PI− on flow cytometry) after pulse treatment with specific doses of bortezomib (D) or carfilzomib (E), normalized against cells treated with DMSO (control).33 Data are the average of 3 biological replicates with standard deviation.
MM is dependent on DDI2/NRF1 for survival. (A) NRF1 processing in the face of adequate (left panel) or inadequate (right panel) proteasome activity. The ER localization domain, transactivating domain (TAD), and DNA binding domain (DBD) of NRF1, as well as deglycanase NGLY1, aspartic protease DDI2 and p97/VCP, are shown. Cleaved NRF1 translocates to the nucleus where it dimerizes with small MAF proteins, binds to antioxidant responsive elements (ARE), and induces transcription of proteasome subunit genes (PSM). (B) Western blot showing full length (FL), deglycosylated (DG), and processed (P) NRF1 (top blots); DDI2 (second blot); and polyUb proteins (third blot) across a panel of MM, AL amyloidosis (AL), B cell lymphoma (B-CELL LYMPH), and T acute lymphoblastic leukemia (T-ALL) cell lines. In comparison with SU-DHL4 and SU-DHL10 cell lines (red box), all other cell lines are characterized by higher polyUb protein accumulation and increased expression of NRF1. GAPDH served as a loading control (bottom blot). (C) CERES score for DDI2 across 342 cancer cell lines assessed via genomic CRISPR screening as part of the DepMap project. Using this approach, a CERES score of −1 identifies an essential gene. MM (green stars indicated by a black arrow) is the cancer cell type that is most highly dependent on DDI2. (D-E) Relative percentage of living cells (Annexin V− and PI− on flow cytometry) after pulse treatment with specific doses of bortezomib (D) or carfilzomib (E), normalized against cells treated with DMSO (control).33 Data are the average of 3 biological replicates with standard deviation.
To our knowledge, it has not been reported whether blocking DDI2 or NRF1 directly could target an intrinsic vulnerability of MM, thus representing an unexplored innovative therapeutic strategy to perturb protein homeostasis for therapeutic purposes.
We show that full-length and cleaved NRF1 are detectable under baseline conditions in MM cells, suggesting a constitutively active PSR and consistent with intrinsic proteasome insufficiency in MM. By querying the publicly available Dependency Map (DepMap) for essential genes participating in PSR, we discovered a high dependency of MM cells on DDI2. Consistently, DDI2 knockout (KO) is cytotoxic alone and in combination with PI, including in de novo PI-resistant cell lines, and it reduces plasmacytoma formation in an in vivo mouse model, resulting in increased animal survival. Protein structure-function studies show that DDI2 KO blocks NRF1 cleavage and nuclear import, thereby impairing de novo proteasome subunit transcription and proteasome recovery after irreversible PI treatment, resulting in increased PI sensitivity. Wild-type (WT), but not catalytically dead DDI2, add-back rescues these phenotypes, confirming a causative link.
Overall, our data suggest that NRF1 is constitutively active in MM and necessary for MM survival in baseline conditions and upon PI. Targeting DDI2, alone or in combination with PI, is cytotoxic against MM, including acquired and de novo PI-resistant models. This study provides the preclinical rationale for development of novel therapeutics targeting DDI2 to overcome PI resistance and improve patient outcome in MM.
Methods
Cell lines and cell culture
Human MM cell lines MM.1S, NCI-H929, AMO1, KMS11, U266, OPM2, KMS20, RPMI8226, KMS12-PE, and MOLP8 were previously available in our institution or were purchased from American Type Culture Collection (ATCC). The bortezomib-resistant AMO1 cell line (AMO1-VR) was a kind gift of Christopher Driessen (Kantonsspital St. Gallen, St. Gallen, Switzerland) and was generated as previously described.21 MM cell lines were maintained in RPMI 1640 medium containing 2.5 mg/mL plasmocin, 1× Gibco Antibiotic-Antimycotic (100 U/mL penicillin, 100 µg/mL streptomycin, and 25 ng/mL Gibco Amphotericin B), supplemented with 10% (volume-to-volume ratio [v/v]) fetal bovine serum (FBS) and 2 µg l-glutamine. 293T cells were purchased from ATCC and maintained in Dulbecco’s modified Eagle medium with 10% FBS and 1× Antibiotic-Antimycotic. Human AL amyloidosis cell lines ALMC1 and ALMC2 were kindly provided by the laboratory of Marina Ramirez-Alvarado and maintained in Iscove modified Dulbecco medium containing 2.5 mg/mL plasmocin, 1× Antibiotic-Antimycotic supplemented with 10% (v/v) FBS, and 1 ng/mL interleukin-6. Human diffuse large B-cell lymphoma SU-DHL4 and SU-DHL10, Burkitt lymphoma DAUDI, chronic lymphocytic leukemia MEC1, T acute lymphoblastic leukemia Jurkat, and chronic myelocytic leukemia K-562 cell lines were purchased from ATCC. These cell lines were cultured as MM cell lines, with the exception of HL-60 and K-562, which were maintained in Iscove modified Dulbecco medium with 100 U/mL penicillin and 100 μg/mL streptomycin, supplemented with 20% (v/v) or 10% FBS, respectively. Cell lines were maintained in sterile conditions in a cell culture incubator at 37°C with 5% CO2 and intermittently tested with a MycoAlert Mycoplasma Detection Kit (Lonza) to rule out mycoplasma contamination. All cell lines were authenticated via short tandem repeat profiling, with the exception of ALMC1 and ALMC2, which were authenticated via a specific protocol kindly provided by the laboratory of Marina Ramirez-Alvarado.
Gene editing via CRISPR/Cas9 ribonucleoprotein delivery
CRISPR RNA (crRNA) were designed using the MIT CRISPR tool (crDDI2-ASP: TGGCAATCCCTGCCCACCGA) or obtained as predesigned crRNA from Integrated DNA Technologies (crNFE2L1.1AA: GCACGGAACCTGCTAGTGGA and crDDI2.AA: GCTCGAAGTCGGCGTCGACC). A nontargeting crRNA was used as negative control (CGTTAATCGCGTATAATACG). ATTO550-labeled trans-activating crRNA and recombinant Cas9 protein were obtained from Integrated DNA Technologies. Gene KO was achieved via transient transfection of a complex of crRNA, trans-activating crRNA, and Cas9 via electroporation through the Neon Transfection System (Thermo Fisher Scientific, Waltham, MA). The detailed protocol can be found in supplemental Material. Cells were harvested 1-hour postelectroporation and sorted based on 4′,6-diamidino-2-phenylindole (DAPI) negativity and ATTO550 positivity, as a bulk population or as single cells. Gene target KO was validated by immunoblots and sequencing of a genomic polymerase chain reaction (PCR) amplicon across the edited locus.
DDI2-KO AMO1-VR monoclones
AMO1-VR cells were subjected to ribonucleoprotein (RNP)-based DDI2 KO with the following crRNA: TGGCAATCCCTGCCCACCGA. One hour posttransfection, cells were subjected to single-cell fluorescence-activated cell sorting in 96-well plates. Growing clones were expanded, and protein lysates were obtained to assess for biallelic DDI2 KO via western blotting. Nested PCR sequencing of the amplicon surrounding the edited locus was used for confirmation.
Chemicals
Bortezomib (S1013), carfilzomib (PR-171), and nelfinavir (S4282) were purchased from Selleckchem and resuspended according to the manufacturer’s instructions.
PI treatment
For drug-sensitivity assay, MM cells were treated with bortezomib or carfilzomib at the indicated concentration for 1 hour, washed with phosphate-buffered saline (PBS), and cultured in regular media for 47 hours prior to harvesting and flow cytometry apoptosis analysis.
For carfilzomib sensitivity in DDI2 KO vs WT and add-back clones, cells were treated for 48 hours continuously prior to harvesting and flow cytometry apoptosis analysis.
Flow cytometry apoptosis assay
Cells were harvested following drug treatment/RNP at the indicated times and washed with PBS once before being pelleted by centrifugation at 1400 rpm for 5 minutes. The cell pellet was resuspended in PBS containing 1× Annexin V binding buffer with 1 mg/mL Annexin V antibody (BD Biosciences). Cells were stained with Annexin V for 20 minutes on ice. Prior to acquisition, 1 mg/mL propidium iodide (PI; or DAPI) was added, and cells were acquired using a flow cytometer (BD LSRFortessa) and analyzed using FlowJo software (TreeStar). PI−Annexin V− cells were considered alive, PI−Annexin V+ cells were considered early apoptotic, and PI+Annexin V+ and PI+Annexin V− cells were considered late apoptotic.
Real-time PCR
DDI2 KO was performed as described. A nontargeting genomic RNA (gRNA) was used as negative control. After 48 hours, DDI2-KO or WT H929, AMO1, and KMS20 cell lines were treated with 25 nM, 40 nM, or 50 nM carfilzomib, respectively, for 1 hour, followed by washing with PBS and culture in regular media. Cells treated with dimethyl sulfoxide (DMSO) were used as control. After 10 hours, cells were harvested for RNA extraction using an RNeasy Mini Kit (QIAGEN), according to the manufacturer’s instruction. The integrity and quantity of total RNA were assessed using a NanoDrop Spectrophotometer (Thermo Fisher Scientific). For analysis of messenger RNA expression, oligo-dT–primed complementary DNA was obtained using a SuperScript VILO cDNA Synthesis Kit (Thermo Fisher Scientific) starting with 1 µg of RNA. Quantitative real-time PCR was performed with the TaqMan fluorescence methodology (Thermo Fisher Scientific) on an ABI Prism 7900HT Sequence Detection System with a 384 module (Applied Biosystems) and PSMA7 (Hs00895424_m1), PSMB5 (Hs00605652_m1), PSMB6 (Hs00382586_m1), and PSMD11 (Hs00160660_m1) probes. Normalization was performed with GAPDH (Hs02786624_g1) as housekeeping gene. Comparative real-time PCR was performed in triplicate, including no-template controls. Relative expression was calculated using the comparative cross threshold method.
Immunoblotting
For whole-cell lysates, cells were harvested, washed with PBS, and lysed in RIPA buffer (Boston BioProducts) containing protease inhibitors (cOmplete, Mini Protease Inhibitor Cocktail; Roche), 1 mM EDTA, 1 mM EGTA, protease inhibitors, and 10 mM NEM (Thermo Fisher Scientific). Cytosolic and nuclear protein fractions were obtained using NE-PER Nuclear and Cytoplasmic Extraction Reagents (Thermo Fisher Scientific), according to the manufacturer’s instructions. The detailed protocol is available in supplemental Material. The following antibodies were used: DDI2 (ab197081) and NRF2 (ab137550) from Abcam; FLAG (F4799) and Apu2 (051407) from Sigma, NRF1 (CST8052), GAPDH (CST5174), HDAC1 (CST5356), anti-Rabbit IgG HRP-linked antibody (CST7074), and anti-mouse IgG HRP-linked antibody (CST7076) from Cell Signaling Technologies, P4D1 (BML-PW0930-0100; Biomol), and α-tubulin (GT-114l; GeneTex). HDAC1 was used as loading control for nuclear proteins; GAPDH or α-tubulin was used as loading control for whole-cell or cytosolic proteins. For NRF1 western blotting, full-length, deglycosylated, and processed NRF1 were identified based on molecular weight.
Proteasome activity assay
WT or DDI2-KO (plus/minus DDI2 or DDI2* add-back) AMO1-VR cells were treated with 20 to 40 nM carfilzomib for 1 hour to inhibit ≥90% proteasome activity, washed with PBS, and allowed to recover in full media. Cells were harvested at 0, 4, 8, 12, and 24 hours postwashing, washed once with PBS, and lysed in ice-cold TX-100 lysis buffer (50 mM NaCl, 2 mM BGP, 1 mM NaF, 10 mM Tris-Cl [pH 7.5], 5 mM EDTA, 1% TX-100, Roche Protease Inhibitor Cocktail Tablet). Protein concentration was determined using a Pierce BCA Protein Assay Kit (Thermo Fisher Scientific). Peptidase activity assay was set up in a 100-μL reaction (96-well plate format) containing 1 μg of lysate protein (10 μg lysate protein was used for the MM baseline proteasome activity assay), 50 mM Tris-HCl [pH 8.0], 10 mM MgCl2, 1 mM ATP, 1 mM DTT, 50 μM Suc-LLVY-AMC (Bachem; I-1395.0025, 20 mM in DMSO, to measure chymotrypsin-like activity). Fluorescence of AMC was measured in a SpectraMax M3 plate reader with an excitation wavelength of 380 nm and an emission wavelength of 460 nm. Under the kinetics mode, fluorescence was read every 35 seconds for a total duration of 1 hour, and the velocity of peptide substrate hydrolysis was determined by the relative fluorescence unit over time slope.
Cell counting kit 8 viability assay
Viability was assessed via a Cell Counting Kit 8 (CCK-8) assay (Dojindo Laboratories; DJDB4000X), according to the manufacturer’s instructions. Ten microliters of reagent was added to 100 μL of cell culture in each well, and plates were read 2 to 4 hours after CCK-8 incubation at an absorbance of 450 nm on a SpectraMax M3 plate reader.
Murine xenograft models
Five-week-old female NOD SCID γ mice (Charles River) were used for this study. All animal studies were approved by the Dana Farber Cancer Institute’s Institutional Animal Care and Use Committee. AMO1 cells were subjected to RNP-based CRISPR/Cas9 gene editing using a DDI2-targeting gRNA or a negative control nontargeting gRNA, as previously described. Viable ATTO550+ cells were sorted 1 hour posttransfection. An aliquot of cells was used to confirm DDI2 KO via western blotting. The remainder of the cells were mixed in a 1:1 ratio with Matrigel (Invitrogen), and 1 × 10⁶ DDI2-KO or WT cells were injected subcutaneously in each mouse. Five mice were used per group. Tumor growth was monitored twice a week after engraftment using an electronic caliper. Mice were euthanized when the tumor reached 2 cm in length or 2 cm3 in volume, or if they appeared moribund, to prevent unnecessary morbidity. DDI2 KO was confirmed via western blot prior to subcutaneous inoculation of cells.
Generation of DDI2-KO and WT and aspartic protease–dead DDI2 add-back AMO1-VR monoclones
Monoclonal DDI2-KO AMO1-VR cell lines were established as described above. pIRES-FLAG-DDI2-Puro and pIRES-FLAG-DDI2*-Puro were a kind gift of Shigeo Murata (The University of Tokyo, Tokyo, Japan).18 We subcloned FLAG-DDI2 and FLAG-DDI2* inserts into a pCDH-Ubc-MCS-PURO backbone vector via NheI/RsrII digestion to generate pCDH-Ubc-FLAG-DDI2-IRES-puro pCDH-Ubc-FLAG-DDI2*-IRES-Puro vectors. Sanger sequencing was used to confirm vector sequence.
Growth competitive assay
DDI2/NRF1 KO in H929, AMO1, and KMS20 cells was performed as described. A nontargeting gRNA was used as negative control. One hour post-RNP transfection, an equal number of DAPI− (viable), ATTO550+ (transfected) cells were seeded in 96-well plates in sextuplicates. Seven days later, the viability of DDI2/NRF1-KO cells and control cells was measured using a CCK-8 assay. Results were normalized against control cells for each cell lines.
Statistics
Experiments were performed in 3 biological replicates, unless otherwise specified. Statistical significance was determined using a Student t test when comparing 2 populations or analysis of variance when comparing >2 populations.
Results and discussion
Based on our prior work showing that proteotoxicity is an intrinsic vulnerability of MM cells, and an intact ubiquitin proteasome system (UPS) is necessary for MM survival, we hypothesized that MM cells depend on DDI2/NRF1-mediated PSR for survival.10 Consistently, we expected NRF1 to be active and, thus, detectable and cleaved, in baseline conditions in MM. Across a panel of B-cell–derived cancer cell lines, we discovered that NRF1 expression is positively correlated with the accumulation of polyUb proteins, a marker of baseline proteotoxic stress; we detected high levels of full-length, deglycosylated, and/or processed NRF1 in MM and AL amyloidosis cells, along with high polyUb accumulation, as we reported previously (Figure 1B). In contrast, SU-DHL4 and SU-DHL10 cells, which are characterized by low polyUb accumulation, showed faint NRF1 expression. Our data suggest that the NRF1 pathway is constitutively active in plasma cell disorders. Consistent with this observation, the publicly available genome-wide CRISPR-Cas9 essentiality gene screening (depmap.org) showed that MM cell lines are the cancer cell type that is most dependent on the aspartic protease DDI2 (Figure 1C; supplemental Figure 1). We next identified cells with high (MM.1S, H929), intermediate (AMO1, U266, OPM2, KMS11), or low (KMS20) de novo sensitivity to bortezomib (Figure 1D) and carfilzomib (Figure 1E). Based on these results, we selected H929 and KMS20 as representative of the most PI-sensitive and most PI-resistant cell lines, respectively. We selected AMO1 as an intermediate sensitivity cell line because of the availability of a well-characterized bortezomib-resistant isogenic cell line (AMO1-VR) that could have been useful for downstream experiments. We then performed growth competitive assays across these 3 cell lines by comparing the viability of DDI2-KO or NRF1-KO cells with that of their WT counterpart 7 days post RNP-mediated gene editing (Figure 2A-B, respectively). DDI2 and NRF1 KO caused a significant reduction in cell numbers across all cell lines, including in de novo PI-resistant KMS20 cells. Through daily assessment of apoptosis via flow cytometry, we noted an excess of early and late apoptosis in DDI2-null cells compared with DDI2 WT cells, supporting a cytotoxic effect for DDI2 KO (supplemental Figure 3). Effective DDI2 and NRF1 KO was confirmed via western blotting (Figure 2C-D, respectively). We then asked whether DDI2 KO could sensitize MM cells to treatment with carfilzomib. Our data show that DDI2-null H929, AMO1, and KMS20 cells are significantly more sensitive to carfilzomib (Figure 2E-G), suggesting a synergistic effect across MM cell lines, regardless of baseline PI sensitivity. Consistent with impaired proteasome biogenesis, real-time PCR data showed reduced transcription of catalytic core (20S) proteasome subunits α7 (PSMA7), β5 (PSMB5), and β6 (PSMB6), as well as regulatory particle, 26S proteasome non-ATPase regulatory subunit 11 (PSMD11), in DDI2-KO cells compared with DDI2 WT cells (Figure 2H; supplemental Figure 2) in baseline conditions and upon carfilzomib treatment.
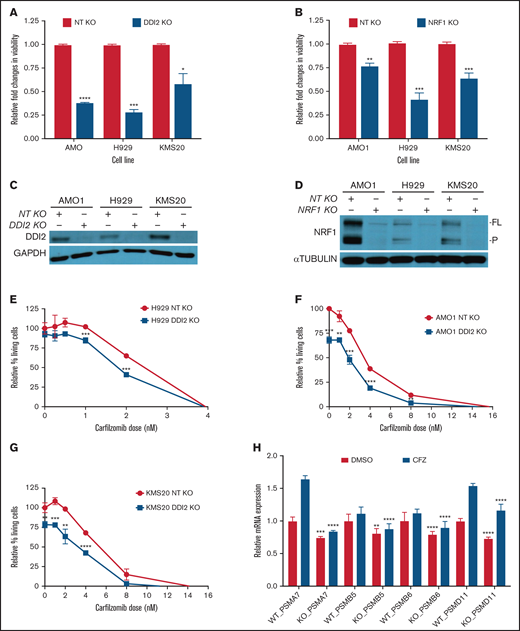
DDI2 KO is cytotoxic in MM and sensitized to PI treatment by impairing de novo proteasome subunit biogenesis. (A) Relative changes in viability of DDI2-KO AMO1, H929, and KMS20 cells (blue bars) compared with cells subjected to RNP with a nontargeting (NT) gRNA (red bars). The average of 3 independent biological experiments is shown. (B) Relative changes in viability in NRF1-KO AMO1, H929, and KMS20 cells (blue bars) compared with cells subjected to RNP with an NT gRNA (red bars). The average of 3 independent biological experiments is shown. (C-D) Western blotting showing DDI2 (C) or NRF1 (D) KO in cells used for the growth competitive assay in (A) and (B), respectively. GAPDH and α-tubulin served as loading controls, respectively. FL, full length; P, processed. (E-G) Percentage of living (Annexin V−/PI− on flow cytometry) DDI2 KO (blue line) H929 (E), AMO1 (F), and KMS20 (G) cells after 48 hours of treatment with the indicated dose of carfilzomib. Data were normalized against DDI2 WT cells (red line). The average of 3 independent experiments is shown. (H) Real-time PCR showing expression of messenger RNA coding for proteasome subunits PSMA7, PSMB5, PSMB6, and PSMD11 in DDI2 WT vs DDI2-KO KMS20 cells treated with DMSO (red bars) or a sublethal dose of carfilzomib (CFZ, blue bars). For each gene, RNA level in WT DDI2 cells treated with DMSO was used as control for normalization. The P value was calculated for each paired condition (same proteasome subunit and same treatment) for DDI2 WT vs KO. One representative experiment of 3 biological replicates, each with triplicate conditions, is shown. *P < .05, **P < 0.01, ***P < .001, ****P < .0001.
DDI2 KO is cytotoxic in MM and sensitized to PI treatment by impairing de novo proteasome subunit biogenesis. (A) Relative changes in viability of DDI2-KO AMO1, H929, and KMS20 cells (blue bars) compared with cells subjected to RNP with a nontargeting (NT) gRNA (red bars). The average of 3 independent biological experiments is shown. (B) Relative changes in viability in NRF1-KO AMO1, H929, and KMS20 cells (blue bars) compared with cells subjected to RNP with an NT gRNA (red bars). The average of 3 independent biological experiments is shown. (C-D) Western blotting showing DDI2 (C) or NRF1 (D) KO in cells used for the growth competitive assay in (A) and (B), respectively. GAPDH and α-tubulin served as loading controls, respectively. FL, full length; P, processed. (E-G) Percentage of living (Annexin V−/PI− on flow cytometry) DDI2 KO (blue line) H929 (E), AMO1 (F), and KMS20 (G) cells after 48 hours of treatment with the indicated dose of carfilzomib. Data were normalized against DDI2 WT cells (red line). The average of 3 independent experiments is shown. (H) Real-time PCR showing expression of messenger RNA coding for proteasome subunits PSMA7, PSMB5, PSMB6, and PSMD11 in DDI2 WT vs DDI2-KO KMS20 cells treated with DMSO (red bars) or a sublethal dose of carfilzomib (CFZ, blue bars). For each gene, RNA level in WT DDI2 cells treated with DMSO was used as control for normalization. The P value was calculated for each paired condition (same proteasome subunit and same treatment) for DDI2 WT vs KO. One representative experiment of 3 biological replicates, each with triplicate conditions, is shown. *P < .05, **P < 0.01, ***P < .001, ****P < .0001.
To confirm a causative relationship between DDI2 KO and PI sensitization and to evaluate the downstream consequences of DDI2 KO, we set out to develop DDI2-KO monoclonal MM cell lines. However, we were unable to generate DDI2-null monoclones in any of the 7 distinct MM cell lines that we tested (data not shown), consistent with the hypothesis that MM cells depend on DDI2 for survival. Therefore, we decided to use the MM cell line AMO1-VR, a syngeneic derivative of AMO1 cells that is adapted to grow in bortezomib-containing media and is a model of acquired bortezomib resistance. Previous studies have shown that, compared with parental cells, AMO1-VR cells are less dependent on the proteasome pathway.22 We speculated that they could be more able to withstand DDI2 loss. In fact, we succeeded in generating several DDI2-null AMO1-VR clones (Figure 3A, orange font). DDI2-KO AMO1-VR monoclones showed increased sensitivity to carfilzomib compared with parental DDI2 WT AMO1-VR cells (Figure 3B). To prove causality and perform protein structure-function studies, we transduced WT AMO1-VR and DDI2 KO AMO1-VR monoclones with a lentiviral vector expressing WT DDI2 or catalytically-dead mutant DDI2D252N (DDI2*) with an N terminus FLAG tag (Figure 3C). We found robust expression of the add-back constructs in DDI2-KO and WT AMO1-VR cells (Figure 3D). DDI2 KO caused a modest, but statistically significant, reduction in baseline chymotryptic-like activity of the proteasome, whereas DDI2 overexpression led to a significant increase (Figure 3E), suggesting that DDI2 expression may be the limiting step in NRF1 activation and proteasome biogenesis in this system. Further, following irreversible proteasome inhibition, DDI2-KO cells had impaired recovery of chymotryptic-like proteasome activity compared with DDI2 WT cells (Figure 3F). Interestingly, DDI2 add-back fully rescued the KO phenotype and led to accelerated proteasome recovery, in line with our baseline data. In contrast, aspartic protease–dead DDI2* add-back failed to rescue the KO phenotype (Figure 3F). Similarly, WT DDI2, but not catalytically-dead DDI2*, add-back restored proteasome inhibitor sensitivity when expressed in DDI2-KO clones (Figure 3G).
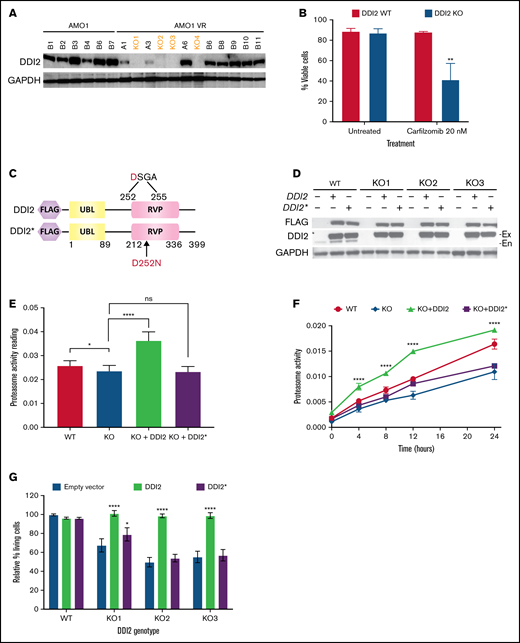
DDI2 KO impairs proteasome recovery after irreversible inhibition and sensitizes to the PI carfilzomib. (A) Western blot showing the absence of DDI2 expression in 4 distinct biallelic DDI2-KO clones (orange font) obtained from AMO1-VR cells. GAPDH was used as loading control. (B) Percentage of DDI2 WT (red bars) or DDI2 KO (blue bars) viable cells at baseline and after treatment with 20 nM carfilzomib for 48 hours. Results were obtained from 3 distinct DDI2 KO monoclones and averaged. Average of 3 independent experiments. (C) Schema of DDI2 and DDI2* add-backs showing N terminus FLAG tag and the ubiquitin-like (UBL) and retroviral-like protease (RVP) domains. The critical loss-of-function mutation D252N in the catalytic domain is also shown. (D) Western blot showing expression of DDI2 and DDI2* in WT and DDI2-KO cells based on FLAG (top panel) and DDI2 (middle panel) expression. The endogenous (En) DDI2 band is visible in DDI2 WT cells in contrast to exogenously expressed DDI2 (Ex). (E) Baseline chymotryptic-like (CT-L) proteasome activity in DDI2 WT (red bar), DDI2-KO monoclones (blue bar), DDI2-KO monoclones plus DDI2 add-back (green bar) and DDI2-KO monoclones plus DDI2* add-back (purple bar) AMO1-VR. Average of 3 independent experiments using 2 distinct DDI2-KO clones is shown. (F) DDI2 WT AMO1-VR cells (solid red line), DDI2-KO clones (solid blue line), and DDI2-KO clones expressing DDI2 (dashed green line) or DDI2* (dashed purple line) add-back were treated with carfilzomib for 1 hour to almost fully inhibit proteasome function (time 0). CT-L proteasome activity was assessed at the indicated time points after carfilzomib wash out. Average of 3 independent experiments with 2 distinct DDI2-KO clones is shown. (G) Relative percentage of living cells upon 24 hours of treatment with carfilzomib in DDI2 WT AMO1-VR cells and 3 distinct DDI2 KO AMO1-VR clones (KO1, KO2, and KO3) expressing DDI2 (green bars) or DDI2* (purple bars) add-backs or an empty vector (blue bars). Values were normalized against DDI2 WT cells expressing empty vector and are the average of 3 independent biological replicates. *P < .05, **P < .001, ****P < .0001. ns. not significant (P > .05).
DDI2 KO impairs proteasome recovery after irreversible inhibition and sensitizes to the PI carfilzomib. (A) Western blot showing the absence of DDI2 expression in 4 distinct biallelic DDI2-KO clones (orange font) obtained from AMO1-VR cells. GAPDH was used as loading control. (B) Percentage of DDI2 WT (red bars) or DDI2 KO (blue bars) viable cells at baseline and after treatment with 20 nM carfilzomib for 48 hours. Results were obtained from 3 distinct DDI2 KO monoclones and averaged. Average of 3 independent experiments. (C) Schema of DDI2 and DDI2* add-backs showing N terminus FLAG tag and the ubiquitin-like (UBL) and retroviral-like protease (RVP) domains. The critical loss-of-function mutation D252N in the catalytic domain is also shown. (D) Western blot showing expression of DDI2 and DDI2* in WT and DDI2-KO cells based on FLAG (top panel) and DDI2 (middle panel) expression. The endogenous (En) DDI2 band is visible in DDI2 WT cells in contrast to exogenously expressed DDI2 (Ex). (E) Baseline chymotryptic-like (CT-L) proteasome activity in DDI2 WT (red bar), DDI2-KO monoclones (blue bar), DDI2-KO monoclones plus DDI2 add-back (green bar) and DDI2-KO monoclones plus DDI2* add-back (purple bar) AMO1-VR. Average of 3 independent experiments using 2 distinct DDI2-KO clones is shown. (F) DDI2 WT AMO1-VR cells (solid red line), DDI2-KO clones (solid blue line), and DDI2-KO clones expressing DDI2 (dashed green line) or DDI2* (dashed purple line) add-back were treated with carfilzomib for 1 hour to almost fully inhibit proteasome function (time 0). CT-L proteasome activity was assessed at the indicated time points after carfilzomib wash out. Average of 3 independent experiments with 2 distinct DDI2-KO clones is shown. (G) Relative percentage of living cells upon 24 hours of treatment with carfilzomib in DDI2 WT AMO1-VR cells and 3 distinct DDI2 KO AMO1-VR clones (KO1, KO2, and KO3) expressing DDI2 (green bars) or DDI2* (purple bars) add-backs or an empty vector (blue bars). Values were normalized against DDI2 WT cells expressing empty vector and are the average of 3 independent biological replicates. *P < .05, **P < .001, ****P < .0001. ns. not significant (P > .05).
Consistent with its previously described role as an activating enzyme for NRF1, we did not observe any processed NRF1 in DDI2-KO clones at baseline or upon PI treatment. Instead, deglycosylated NRF1 accumulated in KO clones upon PI treatment (Figure 4A). WT DDI2, but not catalytically dead DDI2*, add-back restored NRF1 cleavage when expressed in DDI2-KO monoclones. Interestingly, DDI2-KO clones displayed increased polyUb protein accumulation compared with DDI2 WT cells. Add-back expression of WT DDI2 significantly decreased polyUb proteins, suggesting baseline compromised proteasome function and increased proteotoxic stress in DDI2-null cells (Figure 4A). Interestingly, expression of catalytically dead DDI2* in WT or DDI2-KO cells led to increased accumulation of polyUb proteins in baseline conditions and upon bortezomib treatment compared with cells transfected with control vector, suggesting a dominant-negative effect on proteostasis. Finally, we detected increased expression of NRF2 in DDI2-KO clones, presumably as a compensatory mechanism to maintain proteasome capacity and, thus, viability (Figure 4A).
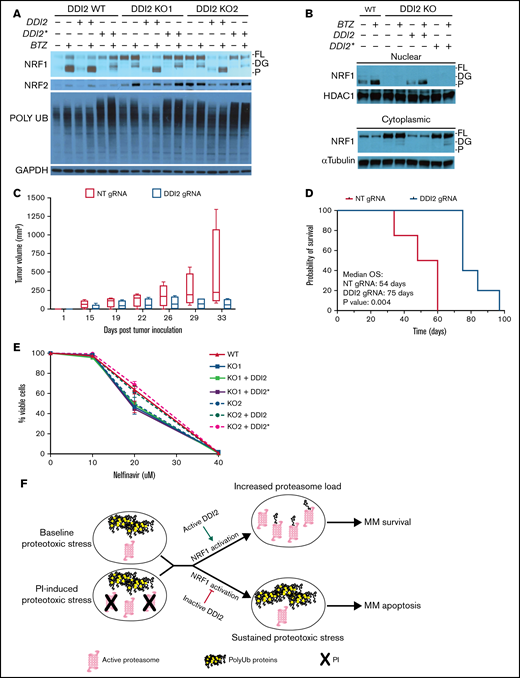
DDI2 KO blocks NRF1 processing and nuclear translocation and WT DDI2 but not catalytically-dead DDI2* rescues NRF1 processing. (A) Western blot showing NRF1, NRF2, and polyUb proteins at baseline and upon bortezomib (BTZ) treatment in DDI2 WT and 2 distinct DDI2-KO clones transduced with an empty vector or vector expressing DDI2 or DDI2*. GAPDH served as loading control. FL, full length; DG, deglycosylated; P, processed form. (B) Western blot showing NRF1 in nuclear (upper blot) and cytoplasmic (lower blot) fraction of cell lysates from DDI2 WT cells or aDDI2-KO clone, with or without WT (DDI2) or catalytic-dead (DDI2*) DDI2 add-back, at baseline and upon BTZ treatment. FL, full length; DG, deglycosylated; P, processed form. (C) Five NSG mice per cohort were inoculated with AMO1 cells that had undergone gene editing with a nontargeting (NT) gRNA (red boxes) or a DDI2-targeting gRNA (blue boxes). Tumor growth was assessed by caliper measurement at the indicated times. Box and whisker plots show median and first and third quartile of tumor volume across the animals in each cohort, as measured on the indicated day post-tumor inoculation. (D) Kaplan-Meier curves of overall survival (OS) for mice harboring DDI2 WT (red line) or DDI2-KO (blue line) tumors. The median OS was 54 days vs 75 days respectively; P = .004. (E) Viability of DDI2 WT AMO1-VR cells and 2 distinct DDI2-KO AMO1-VR clones, with or without WT or catalytic dead DDI2 add-back, upon treatment with the protease inhibitor nelfinavir for 24 hours. Average of 3 independent experiments is shown. (F) Schema showing the rationale for targeting DDI2 in MM to exacerbate proteotoxic stress in baseline conditions and/or upon PI treatment.
DDI2 KO blocks NRF1 processing and nuclear translocation and WT DDI2 but not catalytically-dead DDI2* rescues NRF1 processing. (A) Western blot showing NRF1, NRF2, and polyUb proteins at baseline and upon bortezomib (BTZ) treatment in DDI2 WT and 2 distinct DDI2-KO clones transduced with an empty vector or vector expressing DDI2 or DDI2*. GAPDH served as loading control. FL, full length; DG, deglycosylated; P, processed form. (B) Western blot showing NRF1 in nuclear (upper blot) and cytoplasmic (lower blot) fraction of cell lysates from DDI2 WT cells or aDDI2-KO clone, with or without WT (DDI2) or catalytic-dead (DDI2*) DDI2 add-back, at baseline and upon BTZ treatment. FL, full length; DG, deglycosylated; P, processed form. (C) Five NSG mice per cohort were inoculated with AMO1 cells that had undergone gene editing with a nontargeting (NT) gRNA (red boxes) or a DDI2-targeting gRNA (blue boxes). Tumor growth was assessed by caliper measurement at the indicated times. Box and whisker plots show median and first and third quartile of tumor volume across the animals in each cohort, as measured on the indicated day post-tumor inoculation. (D) Kaplan-Meier curves of overall survival (OS) for mice harboring DDI2 WT (red line) or DDI2-KO (blue line) tumors. The median OS was 54 days vs 75 days respectively; P = .004. (E) Viability of DDI2 WT AMO1-VR cells and 2 distinct DDI2-KO AMO1-VR clones, with or without WT or catalytic dead DDI2 add-back, upon treatment with the protease inhibitor nelfinavir for 24 hours. Average of 3 independent experiments is shown. (F) Schema showing the rationale for targeting DDI2 in MM to exacerbate proteotoxic stress in baseline conditions and/or upon PI treatment.
Next, we show that lack of NRF1 processing in DDI2-KO clones results in defective NRF1 nuclear localization, a phenotype that is fully restored by adding back DDI2, but not DDI2* (Figure 4B). Using a plasmacytoma mouse model, we show that tumors derived from DDI2-KO cells are characterized by reduced growth compared with DDI2 WT tumors (Figure 4C), resulting in a statistically significant prolongation of overall survival (75 vs 54 days, P = .004; Figure 4D).
Recent studies have suggested that the protease inhibitor nelfinavir targets NRF1 by directly inhibiting DDI2, based on data showing impaired NRF1 processing upon nelfinavir treatment.23,24 Using our DDI2-KO AMO1-VR cells, we show that nelfinavir retains similar cytotoxic activity independent of the presence of DDI2, excluding that DDI2 is the target directly mediating nelfinavir cytotoxicity (Figure 4E). We believe that the defective NRF1 processing upon nelfinavir treatment that was observed in prior studies can be explained in light of nelfinavir-induced ER vesicular transport inhibition that presumably compromises NRF1 processing.8,25
The clinical use of proteasome inhibitors has radically changed the natural history of MM and proved that targeting the UPS is an exceptionally effective therapeutic strategy, with unexpectedly modest side effects. Based on our prior studies, the striking tolerability of PIs in the clinics is to be ascribed to the increased dependency of MM cells on the UPS, stemming from their function as professionally secreting cells (Figure 4F). This intrinsic vulnerability has paved the way for the development of novel agents perturbating protein homeostasis, such as histone deacetylase 6 inhibitors.26 However, despite tremendous advancement in our therapeutic armamentarium leading to significant increments in median overall survival, MM remains incurable, and PI resistance remains a major clinical challenge.
We hypothesized that targeting DDI2/NRF1-mediated PSR would leverage the intrinsic proteostasis vulnerability of MM with resultant therapeutic efficacy. We speculated that targeting DDI2 would be cytotoxic against MM cells suffering from baseline or PI-induced proteotoxic stress (Figure 4F).
In this study, we identified 3 human MM cell lines that are characterized by high, intermediate, or low sensitivity to PI: H929, AMO1, and KMS20, respectively. Beyond their distinct response to PI, these cell lines are characterized by different genetic backgrounds. KMS20 carries a G12S homozygous mutation in KRAS and a Y126X homozygous mutation in TP53; H929 is characterized by t(11;14), a G13D heterozygous mutation in NRAS, and TP53 WT status; and AMO1 harbors a t(12;14) heterozygous A146T KRAS mutation and WT TP53.27 By using isogenic DDI2-KO AMO1-VR cells, we showed that DDI2 loss abrogates NRF1 cleavage and nuclear localization and significantly reduces proteasome subunit biogenesis in baseline conditions and upon proteasomal inhibition, as well as recovery of proteasome activity following PI treatment. DDI2 KO proved cytotoxic across MM cell lines, with distinct sensitivity to PIs and sensitized to carfilzomib treatment, suggesting potential therapeutic benefit from DDI2 blockade. Of note, although loss of both copies of DDI2 did not appear to be tolerated by PI-naive MM cell lines, several clones of DDI2 biallelic-KO AMO1-VR cells could be established. This isogenic cell line is a model of acquired bortezomib resistance that is less dependent on the proteasome pathway for survival. These data suggest that, in bortezomib-resistant MM cells, targeting only DDI2 may not be sufficient to induce cytotoxicity; combinatorial treatment may be needed. However, the lack of known pharmacological inhibitors of DDI2/NRF1 limits our ability to preclinically validate this pathway, and our current studies are focusing on the identification of specific DDI2 inhibitors for MM therapy. In fact, a major open question is whether targeting DDI2/NRF1 is tolerated in humans. Irreversible PIs (such as carfilzomib) have shown a signal for distinct toxicities compared with bortezomib, including increased rates of cardiovascular and renal adverse events. Deubiquitinating enzyme and chaperone inhibitors have shown promising activity in preclinical studies in MM, but their clinical development has been limited by severe toxicity.28-30 Thus, although a strong biologic rationale exists to target proteostasis in MM, the therapeutic index may be limited, and identification of MM-specific dependencies is critical to retain efficacy while avoiding toxicities.31,32 DepMap data suggest that DDI2 may be an ideal target as a result of the increased dependency of MM on this protein.
Taken together, our data demonstrate a key role for DDI2/NRF1-mediated PSR in maintaining protein homeostasis and, thus, cell viability at baseline and under conditions of proteasome inhibition in MM cells, independent of their baseline sensitivity to PI. Therefore, DDI2 and NRF1 represent promising novel molecular targets in MM therapy that may overcome de novo and acquired PI resistance, 1 of the most important limitations to the long-term survival of patients with MM.28
Acknowledgments
The authors thank the Dana-Farber Cancer Institute Flow Cytometry Core Facility, led by John Daley and Suzan Lazo, for technical support; Alfred Goldberg and Zhe Sha for fruitful scientific discussions; and Shigeo Murata for DDI2 add-back constructs. This work was supported in part by the Doris Duke Charitable Foundation, Clinical Scientist Development Award (G.B.). No funds from the Doris Duke Charitable Foundation were used for animal-related experiments. G.B. is grateful to the Demarest Lloyd Jr Foundation and the Appleby Cardiac Amyloidosis Fund for their support of the Amyloidosis Program.
This work was supported in part by National Institutes of Health/National Cancer Institute grant K08 CA245100-01A1 (to G.B.).
Authorship
Contribution: G.B. conceived, designed, and performed experiments, analyzed data, and wrote the manuscript; T.C., M.H., and M.M. performed experiments and analyzed the data; J.B. performed experiments; P.G.C., K.C.A., and T.K.B. provided technical support and advice.
Conflict-of-interest disclosure: G.B. has acted as a paid consultant for Karyopharm Therapeutics, MJH Life Sciences, Pfizer, and Clearview. K.C.A. serves on advisory boards for Takeda, Bristol Myers Squibb, Gilead, Sanofi Aventis, and Janssen. The remaining authors declare no competing financial interests.
Correspondence: Giada Bianchi, 4 Blackfan Circle, HIM742, Boston, MA 02115; e-mail: gbianchi1@bwh.harvard.edu.

