

Key Points
Magnetic tweezers reveal a pH-dependent destabilization of the D3 interface priming VWF for multimerization by exposing Cys1099 and Cys1142.
The stability of the D3 interface is increased by FVIII, suggesting a binding site within the D3 submodules.

Abstract
Von Willebrand factor (VWF) is a multimeric plasma glycoprotein that is critically involved in hemostasis. Biosynthesis of long VWF concatemers in the endoplasmic reticulum and the trans-Golgi is still not fully understood. We use the single-molecule force spectroscopy technique magnetic tweezers to analyze a previously hypothesized conformational change in the D′D3 domain crucial for VWF multimerization. We find that the interface formed by submodules C8-3, TIL3, and E3 wrapping around VWD3 can open and expose 2 buried cysteines, Cys1099 and Cys1142, that are vital for multimerization. By characterizing the conformational change at varying levels of force, we can quantify the kinetics of the transition and stability of the interface. We find a pronounced destabilization of the interface on lowering the pH from 7.4 to 6.2 and 5.5. This is consistent with initiation of the conformational change that enables VWF multimerization at the D′D3 domain by a decrease in pH in the trans-Golgi network and Weibel-Palade bodies. Furthermore, we find a stabilization of the interface in the presence of coagulation factor VIII, providing evidence for a previously hypothesized binding site in submodule C8-3. Our findings highlight the critical role of the D′D3 domain in VWF biosynthesis and function, and we anticipate our methodology to be applicable to study other, similar conformational changes in VWF and beyond.
Introduction
Von Willebrand factor (VWF) is a large plasma glycoprotein, critically involved in primary hemostasis. Long VWF multimers travel in the blood stream in a globular conformation and undergo conformational changes on sensing increased hydrodynamic forces, present, for example, at sites of vascular injury.1 Through these changes, VWF exposes binding sites for blood platelets.2,3 After binding to collagen in the injured vessel wall, force-activated VWF thus enables formation of a hemostatic plug, built by multiple platelets binding to it.4 The peak hydrodynamic forces acting on VWF scale approximately with the square of its length.5,6 VWF’s occurrence in form of ultra-large concatemers, reaching lengths up to 100 µm and more on unfolding,6-9 is thus vital for effective force activation through hydrodynamic forces at sites of vascular injury.
Biosynthesis of such long concatemers is a highly complex process10,11 : VWF is expressed as a prepropeptide, comprising a short signal peptide and the prodomains D1 and D2 in addition to the domains featured in mature VWF12 (Figure 1A). The signal peptide is cleaved during transport of proVWF to the endoplasmic reticulum (ER), where numerous cysteine bridges form, which shield most domains against unfolding under force.13 In the ER, monomers dimerize via formation of 3 cysteine bridges between the C-terminal cystin knot (CK) domains7,13 (Figure 1B) and glycosylation is initiated. After dimerization, proteins are transferred to the Golgi (pH 6.2), where the stem region of VWF dimers is compacted into a “dimeric bouquet,”14 and VWF is extensively posttranslationally modified by N- and O-glycosylation, sialylation, and sulfation. In the trans-Golgi network, furin cleaves off the propeptide,4,13,15 -17 and dimers assemble into a helical shape and multimerize by interdimer cysteine bonding at positions Cys1099-Cys′1099 and Cys1142-Cys′1142 in the N-terminal D′D3 domains. The multimers are stored in Weibel-Palade bodies (WPBs; secretory granules) at an even lower pH of 5.4 and secreted into the bloodstream.7,10
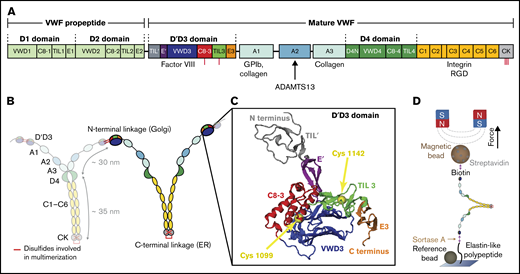
VWF domain structure and magnetic tweezers assay. (A) Domain sequence of a full-length VWF monomer.4 Domains are scaled to length. The propeptide is cleaved by furin before mature VWF concatemers are secreted into the bloodstream. Binding sites of different interaction partners of VWF are indicated. (B) Mature monomers are dimerized via C-terminal linkage of the CK domains in the ER and subsequently multimerized via N-terminal linkage of 2 D'D3 domains in the trans-Golgi network. (C) Crystal structure of the D'D3 domain in its closed conformation (PDB accession code 6N29).18 The D'D3 domain comprises 6 submodules: TIL' and E' (D' submodules) project out, whereas C8-3, TIL3, and E3 form a wedge with the larger VWD3 module (D submodules). Cysteines for multimerization are buried in the interface and indicated by yellow spheres. The structure was rendered using VMD.47 (D) Schematic of VWF dimer in magnetic tweezers. VWF is covalently attached to a flow cell surface via an ELP linker. Coupling to a paramagnetic bead is achieved via a stable biotin-streptavidin linkage. Reference beads are used to account for drift. Forces are applied through 2 permanent magnets above the flow cell.
VWF domain structure and magnetic tweezers assay. (A) Domain sequence of a full-length VWF monomer.4 Domains are scaled to length. The propeptide is cleaved by furin before mature VWF concatemers are secreted into the bloodstream. Binding sites of different interaction partners of VWF are indicated. (B) Mature monomers are dimerized via C-terminal linkage of the CK domains in the ER and subsequently multimerized via N-terminal linkage of 2 D'D3 domains in the trans-Golgi network. (C) Crystal structure of the D'D3 domain in its closed conformation (PDB accession code 6N29).18 The D'D3 domain comprises 6 submodules: TIL' and E' (D' submodules) project out, whereas C8-3, TIL3, and E3 form a wedge with the larger VWD3 module (D submodules). Cysteines for multimerization are buried in the interface and indicated by yellow spheres. The structure was rendered using VMD.47 (D) Schematic of VWF dimer in magnetic tweezers. VWF is covalently attached to a flow cell surface via an ELP linker. Coupling to a paramagnetic bead is achieved via a stable biotin-streptavidin linkage. Reference beads are used to account for drift. Forces are applied through 2 permanent magnets above the flow cell.
To ensure unrestricted functionality, it is of vital importance that all cysteine bridges form natively. Most disulfide bridges are formed in the ER, with the notable exception of the 2 cysteine bridges (Cys1099-Cys′1099 and Cys1142-Cys′1142) in the D′D3 domain mediating VWF multimerization.16 A crystal structure of the monomeric D′D3 domain at neutral pH, characteristic of the ER, has revealed a wedge-like conformation of the D assembly.18 In this conformation, the C8-3, TIL3, and E3 submodules make close contact with the VWD3 domain (Figure 1C), effectively burying the cysteines at positions 1099 and 1142. This conformation likely prevents premature multimerization in the ER.18 It has been hypothesized that in the acidic pH of the trans-Golgi, a conformational change in the D′D3 domain exposes the cysteines to enable multimerization.18 However, details of this necessary conformational change are currently unknown.
In addition to enabling multimerization, the D′D3 domains serve another function critical for hemostasis: By binding coagulation factor VIII (FVIII), they protect FVIII from rapid clearance19,20 and transport it to sites of vascular injury. Mutations within the VWF D′D3 domain that impede this high-affinity binding lead to type 2N von Willebrand disease, a condition characterized by reduced plasma levels of FVIII.21,22 Structural and biochemical data reveal binding of the FVIII C1 domain to the D′ modules of VWF and, additionally, hint at interactions of FVIII with the VWF D3 core.18,19,23 -25
Here, we use magnetic tweezers (MTs) to study the conformational change in the D′D3 domain necessary for multimerization and the interaction of the D′D3 domain with FVIII. MTs are a powerful tool for single-molecule force spectroscopy, enabling multiplexed application of a large range of constant forces.26-28 Recently, assays have been introduced using MTs for studying force-induced conformational changes in proteins.29-31 For this purpose, single proteins are tethered between a glass surface and a magnetic bead. A magnetic field, generated by electro- or permanent magnets, exerts precisely controlled forces on the bead and thus the tethered molecule. Conformational changes in the tethered protein lead to changes in the bead position, which is monitored by video microscopy.
In this study, we investigate full-length VWF dimers at different levels of constant force (Figure 1D) to directly probe the stability of the D′D3 domain. We observe fast, reversible transitions at constant forces around 8 pN that we identify as a large-scale conformational change in the D′D3 domain. Investigating the force dependency of the transitions, we can infer the stability and dynamics of the interface. At the pH present in the Golgi and WPB, we find a significant destabilization of the interface burying the cysteines at positions 1099 and 1142 compared with neutral pH, validating the hypothesis that reduced pH plays a crucial role in VWF’s biosynthesis. Furthermore, we find a stabilization of the interface in presence of FVIII, strongly supporting the hypothesis of a binding site of FVIII within the D submodules in addition to the D′ submodules.18,23,25
Methods
Engineering of recombinant proteins, experimental procedures, and data analysis
Dimeric VWF constructs were designed as hetero-bifunctional dimers, consisting of 2 different types of monomers possessing different peptide tags at their termini for site-specific immobilization in MT. Dimers were expressed in HEK-293 cells and purified via a strep-tag with an affinity column as described previously.29,32 We used commercially available FVIII (Advate 500 I.E.; Baxter AG). For details, please refer to the Supplemental Information. MT measurements were conducted on a custom MT setup described previously33 that was calibrated based on the equipartition theorem using long DNA tethers.34,35 MT data were analyzed to assess the stability of the D3 interface using custom Matlab scripts.
Measurement conditions
Flow cells and proteins were prepared as described previously by Löf et al.29 Measurements of VWF dimers in MT were performed in 20 mM HEPES, 150 mM NaCl, 1 mM CaCl2, and 1 mM MgCl2 at room temperature. To test the influence of lower pH, EDTA, or FVIII, on the transitions in the D3 domain, the measurement buffer was replaced by flushing with 1 mL (∼20 flow cell volumes) with the buffer with the respective condition. All buffers used can be found in supplemental Table 1.
Molecular dynamics simulations
Molecular dynamics (MD) simulations for the entire D'D3 domain were performed under equilibrium conditions and with a constant-velocity pulling force applied to the N and C termini of the D'D3 structure. Two distinct cases were considered for all simulations: with all D'D3-histidines uncharged, mimicking neutral pH, and all D'D3-histidines positively charged, corresponding to low pH. Ten simulation replicas, from 100 to 750 ns, were set up for each case, both in equilibrium and under force, amounting to at least 24 µs of cumulative simulation time. Three pulling velocities were considered during force probing: 0.025, 0.1, and 0.2 m/s. For details refer to the supplemental Information and supplemental Table 2.
Results
To probe the stability of the wedge-like D3 interface formed by VWD3 with C8-3, TIL3, and E3, we use an assay that comprises VWF dimers, the smallest repeating subunits of long VWF concatemers (Figure 1D). We tether the dimers in MT between a flow cell surface and superparamagnetic beads using a previously described coupling strategy based on covalent surface attachment via elastin-like polypeptide (ELP) linkers.29,36 The other terminus is attached to a superparamagnetic bead via a noncovalent, highly stable biotin-streptavidin bond.37 In our MT setups, we apply varying levels of constant force by precisely adjusting the height of 2 permanent magnets located above the flow cell (Figure 1D). Among the 12 domains of mature VWF monomers, only the A2 domain is not shielded against unfolding at comparably low forces by long-range disulfide bridges. The A2 unfolding is thus one of the first responses of VWF to mechanical force and has been extensively investigated using magnetic29 and optical tweezers6,38-40 and atomic force microscopy-based32 single-molecule force spectroscopy. Here, we use the 2 A2 unfolding events (1 from each monomer in the dimer) as a molecular fingerprint: in the beginning of each measurement, we apply a force of 11 pN and identify specifically coupled VWF dimers by observing 2 ≈35-nm steps that correspond to the A2 unfolding signature29 (Figure 2A blue inset).
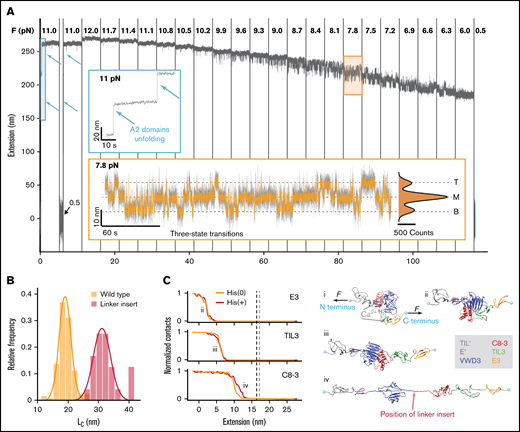
MT force spectroscopy reveals conformational change in the D'D3 domain. (A) Extension-time trace of a VWF dimer exhibiting fast, reversible transitions between 3 distinct states. After checking for A2 domain unfolding at 11 pN (blue inset, unfolding events indicated by arrows), the force is decreased from 12 to 6 pN to systematically study the transitions between 3 states, separated by ≈7.5 nm. The population in the respective states shifts with decreasing force, with an increasing fraction of time spent in the lower extension levels at lower forces. At forces around 8 pN, transitions from the M state to the T or B state are equally likely (orange inset). In the inset, the 3 states (top, middle, and bottom) are indicated by dashed lines. The histogram is fit with a triple Gaussian function (black line; Table 1, Equation 10). Raw data recorded at 58 Hz (gray line, inset) and smoothed data at 5 Hz (main panel and orange line in the inset). (B) Histogram of contour length transformed increment of the wild-type dimer and a modified dimer with an additional 20-aa-long linker insertion into the naturally occurring flexible sequence between VWD3 and C8-3 (position of the linker insert indicated in Civ). Lines are Gaussian fits (Table 1, Equation 8); the mean ± standard deviation are LC,wt = 19.0 ± 2.4 nm and LC,linker = 32.4 ± 4.1 nm. (C) Force-probe molecular dynamics simulations reveal the molecular mechanism of the transitions in the D’D3 domain. (i) Crystal structure of the D'D3 domain with TIL' (gray), E' (purple), VWD3 (blue), C8-3 (red), TIL3 (green), and E3 (orange).16 Termini are marked with cyan spheres. External forces F are applied on them in opposite directions with a pulling velocity of 0.025 m/s. (ii-iv) Under the influence of force, E3, TIL3, and C8-3 are “peeled” off the large VWD3 submodule. Red arrow indicates position of the linker insert. The panels at the left side indicate the normalized average number of contacts between VWD3 and the indicated subdomain as a function of the inter-termini extension. A decrease of contacts indicates the opening of the interface between VWD3 and the respective domains. Data shown are with neutral histidine residues (HIS(0)) or with histidines protonated (HIS(+)). The contour length increase estimates from the simulations on the basis of the force-distance profiles (supplemental Figure 3) are 16.4 ± 0.3 nm (HIS(0): vertical gray line) and 17.1 ± 0.3 nm (HIS(+): vertical black line).
MT force spectroscopy reveals conformational change in the D'D3 domain. (A) Extension-time trace of a VWF dimer exhibiting fast, reversible transitions between 3 distinct states. After checking for A2 domain unfolding at 11 pN (blue inset, unfolding events indicated by arrows), the force is decreased from 12 to 6 pN to systematically study the transitions between 3 states, separated by ≈7.5 nm. The population in the respective states shifts with decreasing force, with an increasing fraction of time spent in the lower extension levels at lower forces. At forces around 8 pN, transitions from the M state to the T or B state are equally likely (orange inset). In the inset, the 3 states (top, middle, and bottom) are indicated by dashed lines. The histogram is fit with a triple Gaussian function (black line; Table 1, Equation 10). Raw data recorded at 58 Hz (gray line, inset) and smoothed data at 5 Hz (main panel and orange line in the inset). (B) Histogram of contour length transformed increment of the wild-type dimer and a modified dimer with an additional 20-aa-long linker insertion into the naturally occurring flexible sequence between VWD3 and C8-3 (position of the linker insert indicated in Civ). Lines are Gaussian fits (Table 1, Equation 8); the mean ± standard deviation are LC,wt = 19.0 ± 2.4 nm and LC,linker = 32.4 ± 4.1 nm. (C) Force-probe molecular dynamics simulations reveal the molecular mechanism of the transitions in the D’D3 domain. (i) Crystal structure of the D'D3 domain with TIL' (gray), E' (purple), VWD3 (blue), C8-3 (red), TIL3 (green), and E3 (orange).16 Termini are marked with cyan spheres. External forces F are applied on them in opposite directions with a pulling velocity of 0.025 m/s. (ii-iv) Under the influence of force, E3, TIL3, and C8-3 are “peeled” off the large VWD3 submodule. Red arrow indicates position of the linker insert. The panels at the left side indicate the normalized average number of contacts between VWD3 and the indicated subdomain as a function of the inter-termini extension. A decrease of contacts indicates the opening of the interface between VWD3 and the respective domains. Data shown are with neutral histidine residues (HIS(0)) or with histidines protonated (HIS(+)). The contour length increase estimates from the simulations on the basis of the force-distance profiles (supplemental Figure 3) are 16.4 ± 0.3 nm (HIS(0): vertical gray line) and 17.1 ± 0.3 nm (HIS(+): vertical black line).
Conformational transition in the D′D3 domain is revealed by MT
After selecting specific VWF tethers, we perform an inverted force ramp protocol, starting at 12 pN and decreasing the force iteratively in steps of 0.3 pN until 6 pN (Figure 2A). In the force-plateaus between 12 and 6 pN, we observe rapid, reversible transitions between a maximum of 3 states, named top, middle, and bottom (Figure 2A, orange inset). The population of these states shifts with decreasing force toward the bottom state, and the midpoint force F1/2, at which transitions from the M state to the T or B state are equally likely, is found to be at around 8 pN. The 3 states are separated by 2 equidistant steps of Δz ≈ 7.6 nm at the applied forces, suggesting that the transitions stem from conformational changes that occur in each of the monomers independently. To uniquely assign the molecular origin of the observed transitions, we performed control measurements on different domain-deletion constructs, in which individual domains are deleted, but which are otherwise identical to the wild-type dimer. We observe the 3-state transitions independently of A2 unfolding (Figure 3A; supplemental Figure 1A) and independently of the deletion of the D4 domain (Figure 3B; supplemental Figure 1A) or deletion of the A1 domain (Figure 3C; supplemental Figure 1B). Furthermore, the characteristic parameters of the transition, namely the midpoint force and the distance between the states are not altered in the domain deletion constructs (Figure 3D-E). Although domain deletion mutant might possibly have locally altered structures or disulfide bonding patterns, given the complexity of VWF, the fact that the observed transition does not change indicates that the domain that harbors the structural change causing the transitions is unaffected in the deletion mutants. AFM images of the deletion constructs furthermore confirm proper dimerization of the deletion constructs (supplemental Figure 2). Therefore, we can exclude an origin within or related to the A1, A2, or D4 domains. When deleting the D′D3 domain, however, the transitions vanish (supplemental Figure 1C), strongly suggesting that a conformational change in this domain causes the transitions.
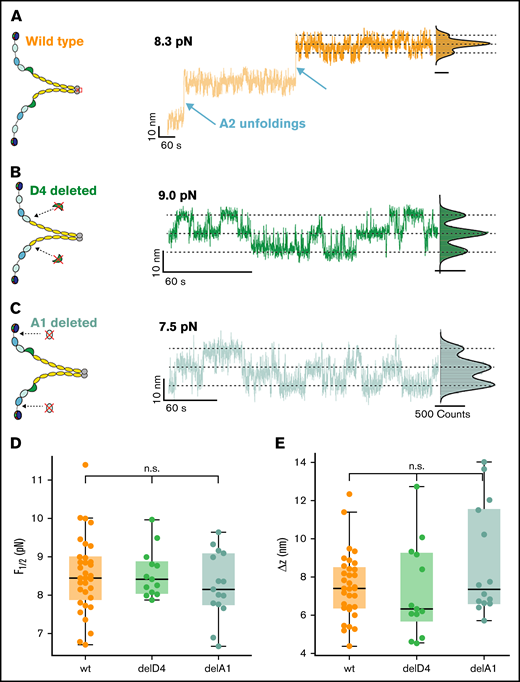
Conformational change in the D’D3 domain is unaffected by other domains. (A) Three-state transitions occur independent of the unfolding of the 2 A2 domains. Schematic of wild-type (wt) VWF dimer and extension-time trace at 8.3 pN. Three-state transitions are observable before and after A2 unfolding. Extension histogram of the segment marked in dark orange reveals 3 distinct states that can be fitted with a 3-term Gaussian (solid black line). (B) Three-state transitions occur independent of a deletion of the D4 domain. Schematic of VWF dimer with deletion of both D4 domains, and extension-time trace at 9.0 pN. Extension histogram reveals 3 distinct states that can be fitted with a 3-term Gaussian (solid black line). (C) Three-state transitions occur independent of a deletion of the A1 domain. Schematic of VWF dimer with deletion of both A1 domains, and extension-time trace at 7.5 pN. Extension histogram reveals 3 distinct states that can be fitted with a 3-term Gaussian (solid black line). (D-E) Neither midpoint forces (D) nor Δz (E) (see main text for a discussion of the model) of the deletion constructs are significantly different from the wt. In the boxplots in panels D and E, each data point corresponds to an individual molecule. The line in the boxes indicates the median of all data points, the box the 25th and 75th percentile, and the whiskers the furthest data point outside the box, but within 1.5 times the box width. Number of molecules included in panels D and E: wt, 33; delD4, 13; delA1, 15.
Conformational change in the D’D3 domain is unaffected by other domains. (A) Three-state transitions occur independent of the unfolding of the 2 A2 domains. Schematic of wild-type (wt) VWF dimer and extension-time trace at 8.3 pN. Three-state transitions are observable before and after A2 unfolding. Extension histogram of the segment marked in dark orange reveals 3 distinct states that can be fitted with a 3-term Gaussian (solid black line). (B) Three-state transitions occur independent of a deletion of the D4 domain. Schematic of VWF dimer with deletion of both D4 domains, and extension-time trace at 9.0 pN. Extension histogram reveals 3 distinct states that can be fitted with a 3-term Gaussian (solid black line). (C) Three-state transitions occur independent of a deletion of the A1 domain. Schematic of VWF dimer with deletion of both A1 domains, and extension-time trace at 7.5 pN. Extension histogram reveals 3 distinct states that can be fitted with a 3-term Gaussian (solid black line). (D-E) Neither midpoint forces (D) nor Δz (E) (see main text for a discussion of the model) of the deletion constructs are significantly different from the wt. In the boxplots in panels D and E, each data point corresponds to an individual molecule. The line in the boxes indicates the median of all data points, the box the 25th and 75th percentile, and the whiskers the furthest data point outside the box, but within 1.5 times the box width. Number of molecules included in panels D and E: wt, 33; delD4, 13; delA1, 15.
Under neutral pH and in the absence of force, the C8-3, TIL3, and E3 submodules wrap around the large VWD3, forming a wedge-like assembly that buries the 2 unbound cysteines18 Cys1099 and Cys1142 (Figure 1C). We hypothesized that by applying force, we unwrap this assembly and open the interface between VWD3, C8-3, TIL3, and E3. We verified this hypothesis by inserting 20 additional amino acids (aa) into the naturally occurring sequence between the VWD3 and C8-3 submodules (Figure 2B-C, “Linker insert”) and evaluating the distance between the states. As unfolded protein chains exhibit entropic polymer elasticity and are not completely stretched at the forces we apply, the measured distance between the states depends on the force at which the transitions occur. For the construct with the linker insert, the transitions shift to lower forces compared with the wild-type construct. To ensure that the difference in force does not systematically bias the measured distance, we take into account the stretching elasticity by calculating the contour lengths from the experimentally observed distances using the worm-like chain model,29 assuming bending persistence length LP = 0.5 nm and contour length LC = 0.4 nm per aa.29,41 The contour length is the length of an unfolded chain of amino acids that is completely stretched and is thus independent of force. We find that inserting the 20 aa leads to an increase in contour length by 13.4 ± 4.8 nm (Figure 2B), in agreement, within experimental error, with the predicted 8 nm.
Force-probe MD simulations provide a detailed view of the transition in the D′D3 domain
As an additional validation and to reveal the microscopic origins of the conformational changes seen by force spectroscopy, we performed force-probe MD simulations on the D′D3 domain (Figure 2C). In the simulations, we pulled the N and C termini of the D′D3 structure away from each other, thus mimicking the force propagation through the D assembly in the MT assay. The externally applied force opens the interface between VWD3 and C8-3, TIL3, and E3, whereas the individual subdomains remain folded because of their internal disulfide bonds (Figure 2C). Monitoring the inter-atomic contacts between the subdomain interfaces reveals the order of events during opening. First the E3 subdomain detaches from D3, a transition that is accompanied by a change in extension of 2.5 ± 0.2 nm between termini. Subsequently, TIL3 loses contact from D3, at an extension of 7.0 ± 0.1 nm (supplemental Figure 3). Finally, C8-3 unbinds from D3 at a 12.0 ± 0.2 nm termini extension. Neither the sequence of events nor the associated extension changes vary significantly with protonation of the histidine residues contained in D′D3. From the simulations, we estimate the contour length as the maximum elongation reached by the protein after all domains are fully detached from each other and before unfolding of D3 starts to occur (supplemental Figure 3). The contour length estimate is 16.4 ± 0.3 nm under neutral pH conditions (His(0)) and 17.1 ± 0.3 nm under low pH conditions (His(+)). These estimates are in excellent agreement with the experimentally determined length increase of 19.0 ± 2.4 nm (Figures 2B). The simulations confirm our hypothesis that the interface in the D3 domain opens under force. Although the simulations, which use high force loading rates, see a sequential peeling off of the domains E3, TIL3, and C8-3 from the VWD3, the constant force measurements in the MT, with much lower temporal resolution, observe them as a single step.
Transitions are inhibited in a fraction of D3 domains
The above findings strongly suggest that the observed transitions between 3 states stem from independently opening the interfaces in the 2 D3 domains of the tethered dimers. Interestingly, 3-state transitions are not observed in all specific tethers exhibiting 2 A2 unfolding steps. Transitions between 3 states are observed in roughly 15% of specific tethers, whereas in 36%, we observe transitions only between 2 states, however, with otherwise identical parameters (see next section), suggesting that these correspond to conformational changes in only 1 of 2 D3 domains. The rest of the specific tethers show no transitions at all, suggesting that no conformational changes in either of the 2 D3 domains occur. In some cases, we initially observed 3-state transitions, but in a later experiment on the same tether under the same conditions, we observed only 2-state transitions. Together, these findings indicate that the conformational change can be inhibited. Considering that interface opening exposes 2 unbound cysteines (Figure 1C, yellow spheres), a possible explanation could be formation of non-native cysteine bridges interfering with native interface formation.
Force-dependent stability of the D3 interface
To extract thermodynamic parameters of the underlying transitions, a triple Gaussian function (Table 1, Equation 10) is fit to the extension histogram in each plateau with 3-state transitions (Figure 4A). Thresholds are defined at the 2 minima between the 3 states (states indicated by dashed lines in Figure 4A). Based on the thresholds, the relative populations of B, M, and T states are determined at each force as the number of data points below, between, and above the thresholds divided by the total number of data points. The relative population of the 3 states shifts systematically with force (Figure 4B). To model the force-dependent fractions, we assume that the D3 interface can be either in a closed state or in a “peeled off” open state. The external force biases the free energy landscape toward the open state, and we assume that the free energy difference between the open and closed interface depends linearly on force as ΔG(F) = ΔG0 − F⋅Δz. Here, ΔG0 is the free energy difference in the absence of force, and Δz is the distance between the free energy minima along the force direction. Assuming that the two D3 domains in the dimer behave identically and independently, the probability of both domains being open (Ptop), one domain being open and one closed (Pmiddle), and both domains being closed (Pbottom) can be described with Equations 1 to 3 (Table 1). Fitting these equations to the relative population of states (Figure 4B, solid lines) yields the fit parameters F1/2, the midpoint force, at which it is equally likely for the domains to be open and closed, as well as Δz, the distance between the states. We find an excellent fit of the 3-state model to the data (Figure 4B), which confirms the assumption of identical, independent transitions. The same analysis can be performed for molecules exhibiting 2-state transitions, where only 1 D3 domain exhibits conformational changes (supplemental Figure 4A). Here, a 2-state model is fit to the relative state populations (Equations 4 and 5, Table 1), providing an independent fit of the same parameters (supplemental Figure 4B). We find that the distributions of fit parameters obtained from analyzing molecules with 2- and 3-state transitions are nearly identical (supplemental Figure 4D-E), which further supports the hypothesis that the underlying processes are indeed identical and that the intra-D3 domain transition is prevented in a fraction of D3 domains. Taking all fit parameters from 2- and 3-state transition molecules together (>30 molecules; Figure 4D-E, solid lines) we find F1/2 = 8.3 ± 1.1 pN and Δz = 7.6 ± 1.7 nm (mean ± standard deviation), which corresponds to a mean free energy of ΔG0 = F1/2 · Δz = 9.0 ± 2.3 kcal/mol and provides a measure of the interface stability.
Equations and fit functions
| Context | Formula | Variables and fit parameters | No. |
|---|---|---|---|
| Three-state transitions, probability top state | F Force kB Boltzmann constant T Temperature Δz & F1/2 fit parameters | 1 | |
| Three-state transitions, probability middle state | F Force kB Boltzmann constant T Temperature Δz & F1/2 fit parameters | 2 | |
| Three-state transitions, probability bottom state | F Force kB Boltzmann constant T Temperature Δz & F1/2 fit parameters | 3 | |
| Two-state transitions, probability top state | F Force kB Boltzmann constant T Temperature Δz & F1/2 fit parameters | 4 | |
| Two-state transitions, probability bottom state | F Force kB Boltzmann constant T Temperature Δz & F1/2 fit parameters | 5 | |
| Dwell times open state | F force kB Boltzmann constant T Temperature τ0,open, Δzopen fit parameters | 6 | |
| Dwell times closed state | F force kB Boltzmann constant T Temperature τ0,closed, Δzclosed fit parameters | 7 | |
| Gauss-fit, 1 term | a, b, c fit parameters | 8 | |
| Gauss-fit, 2 terms | a1, b1, c1, a2, b2, c2 fit parameters | 9 | |
| Gauss-fit, 3 terms | a1, b1, c1, a2, b2, c2, a3, b3, c3 fit parameters | 10 |
Equations describing the equilibrium and the kinetics of the transitions in the D3 domains assuming independent processes.
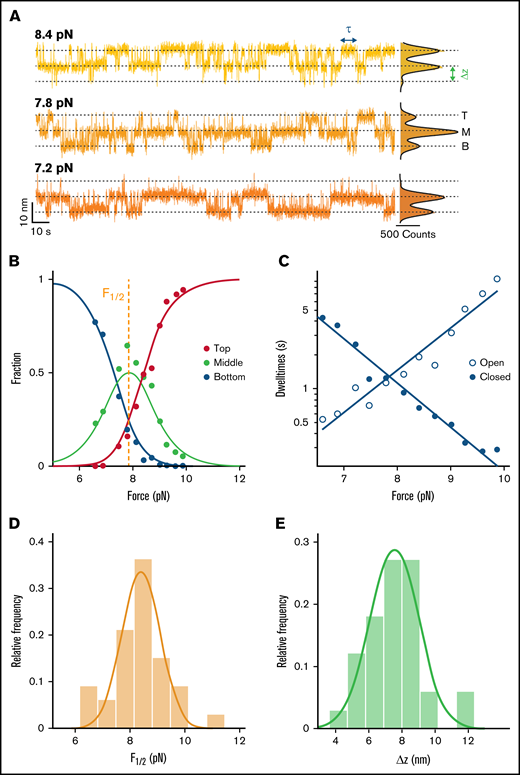
Stability and dynamics of the D3 interface probed by MT force spectroscopy. (A) Extension-time traces of VWF dimers in MT. Three-state transitions shift with decreasing force toward the bottom state. The 3 states (top, middle, and bottom) are indicated by dashed lines. Histograms of the extensions are shown on the right. Black lines show triple Gaussian fits. (B) Analysis of the relative population of the different states as a function of force. Each circle corresponds to experimental data from a 5-minute force plateau measurement. Data are well described by a 3-state model with 2 independent transitions (solid lines; Table 1, Equations 1-3). Fit parameters are the mid-force F1/2 (here F1/2 = 7.85 pN) and the distance between the states Δz (here Δz = 6.5 nm). (C) Pseudo-dwell time distributions for the open and closed domains calculated from dwell times in the top, middle, and bottom state. For each plateau, pseudo-dwell times are determined and fit with an exponential to determine the mean dwell times for each force. Mean dwell times in the open (open circles) and the closed state (filled circles) depend exponentially on the applied force (solid lines are exponential fits; Table 1, Equations 6 and 7). (D) Histogram of mean midpoint forces determined from fitting the 2- or 3-state model (B; supplemental Figure 4B). The solid line is a Gaussian fit with mean ± standard deviation of 8.3 ± 1.1 pN. (E) Histogram of Δz determined from fitting the 2- or 3-state model (B; supplemental Figure 4B). The solid line is a Gaussian fit with mean ± standard deviation of 7.6 ± 1.7 nm. Histograms in panels D and E show distributions of 33 molecules.
Stability and dynamics of the D3 interface probed by MT force spectroscopy. (A) Extension-time traces of VWF dimers in MT. Three-state transitions shift with decreasing force toward the bottom state. The 3 states (top, middle, and bottom) are indicated by dashed lines. Histograms of the extensions are shown on the right. Black lines show triple Gaussian fits. (B) Analysis of the relative population of the different states as a function of force. Each circle corresponds to experimental data from a 5-minute force plateau measurement. Data are well described by a 3-state model with 2 independent transitions (solid lines; Table 1, Equations 1-3). Fit parameters are the mid-force F1/2 (here F1/2 = 7.85 pN) and the distance between the states Δz (here Δz = 6.5 nm). (C) Pseudo-dwell time distributions for the open and closed domains calculated from dwell times in the top, middle, and bottom state. For each plateau, pseudo-dwell times are determined and fit with an exponential to determine the mean dwell times for each force. Mean dwell times in the open (open circles) and the closed state (filled circles) depend exponentially on the applied force (solid lines are exponential fits; Table 1, Equations 6 and 7). (D) Histogram of mean midpoint forces determined from fitting the 2- or 3-state model (B; supplemental Figure 4B). The solid line is a Gaussian fit with mean ± standard deviation of 8.3 ± 1.1 pN. (E) Histogram of Δz determined from fitting the 2- or 3-state model (B; supplemental Figure 4B). The solid line is a Gaussian fit with mean ± standard deviation of 7.6 ± 1.7 nm. Histograms in panels D and E show distributions of 33 molecules.
Kinetics of the conformational changes in the D3 interface
In addition to providing insights into the force-dependent equilibrium, our MT extension time traces can reveal kinetic information from the transitions at different forces. Using the same thresholds as for state-population analysis, we identify dwell times (Figure 4A, τ; supplemental Figure 5) as times that are spent in one state before crossing the threshold. The dwell times in the three-state transitions, however, reflect the kinetics of 2 equal processes happening independently at the same time. To access the dwell times of individual domains, τopen and τclosed, dwell times in the middle plateau are divided by 2 and associated with the dwell times in the bottom state and the top state, respectively. This procedure to obtain so-called pseudo-dwell times for individual domains takes into account the number of domains opened and closed in each state and weighs the measured dwell times accordingly.42,43 We find the pseudo-dwell times determined from the individual plateaus to be exponentially distributed (supplemental Figure 6). The mean pseudo-dwell times in the open and closed state depend exponentially on force and are well described by Arrhenius-like relationships44 (Table 1, Equations 6 and 7; Figure 4C, solid lines). Fitting parameters τ0, open and τ0, closed are the lifetimes of the open and closed conformation at zero force and Δzopen and Δzclosed are the distances to the transition state along the pulling direction. The sum of Δzopen and Δzclosed (3.1 + 4.7 nm = 7.8 nm) is found to be in excellent agreement with Δz obtained from fitting relative state populations, which provides a consistency check between equilibrium and kinetic analysis and suggests that there is a single dominant energy barrier along the reaction pathway. The extrapolated lifetimes at zero force of the closed conformation τ0, closed are in the range of hours. In comparison, the lifetimes of the open states in the absence of load τ0, open are much shorter, only on the order of milliseconds. The extrapolated lifetimes at zero force provide another route for calculating the mean free energy: ΔG0,τ = kBT·log(τ0,open/τ0,closed) = 9.3 ± 1.7 kcal/mol, in excellent agreement with the ΔG0 value computed from the force-dependent populations in the previous section (Figure 5C). The good agreement between the free energy differences obtained from equilibrium and lifetime analysis provides another consistency check between the thermodynamic and kinetic analyses.
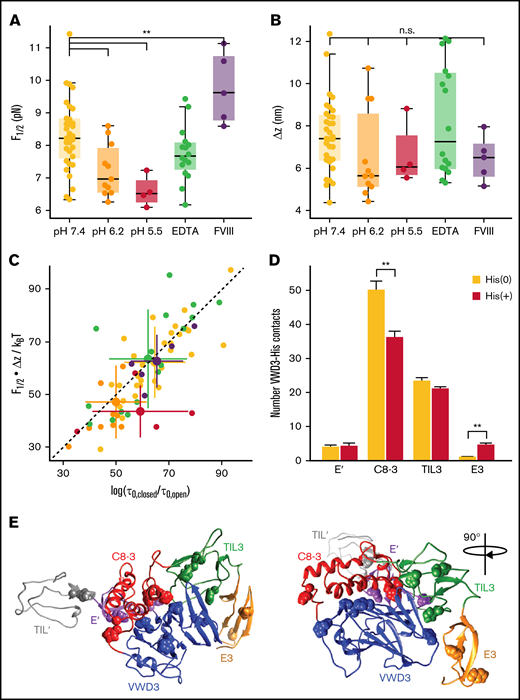
Stability of the D3 interface is modulated by pH and FVIII binding. (A) Midpoint force F1/2 for different buffer conditions (see supplemental Table 1 for details of the buffer compositions). The D3 interface is destabilized by decreasing pH, not affected by addition of EDTA (to remove the Ca2+ from the binding loop in VWD3) and stabilized by addition of FVIII. The difference between F1/2 at pH 7.4 and pH 6.2 is highly significant (P < .0041; 2-tailed t test for independent means). Similarly, the difference between F1/2 at pH 7.4 and pH 7.4 + FVIII is highly significant (P < .0078). (B) Distances Δz between states for the same conditions as in panel A. There are no significant differences in Δz between the conditions. Each point in panels A and B corresponds to an individual molecule. Boxes indicate the median and 25th and 75th percentile, and whiskers are the furthest datapoint outside the box, but within 1.5 times the box width. (C) Free energy differences between the open and closed state of the D3 interface. The free energy differences were obtained from the equilibrium data as F1/2⋅Δx and from the kinetics as ksT⋅log(τ0,closed/τ0,open). The data fall along the 45° line (dashed), indicating that the 2 estimates give consistent values. Comparison of the different conditions reveals a lower free energy difference for decreased pH of 6.2 and 5.5, indicating a destabilization of the domain at low pH. Small points correspond to data from individual molecules; large points with error bars indicate the mean ± standard deviation for each condition. (D) Average number of histidine contacts for several subdomains with the VWD3 domain, determined from equilibrium simulations. Two conditions were considered: histidines unprotonated (orange) or protonated (dark red). Contacts are defined as atoms with a distance < 0.35 nm. Statistically significant differences between the unprotonated and protonated histidine simulations are indicated by 2 stars corresponding to p < .01. (E) Crystallographic structure of the D′D3 domain with histidine residues that showed the strongest changes in average contacts indicated as spheres.
Stability of the D3 interface is modulated by pH and FVIII binding. (A) Midpoint force F1/2 for different buffer conditions (see supplemental Table 1 for details of the buffer compositions). The D3 interface is destabilized by decreasing pH, not affected by addition of EDTA (to remove the Ca2+ from the binding loop in VWD3) and stabilized by addition of FVIII. The difference between F1/2 at pH 7.4 and pH 6.2 is highly significant (P < .0041; 2-tailed t test for independent means). Similarly, the difference between F1/2 at pH 7.4 and pH 7.4 + FVIII is highly significant (P < .0078). (B) Distances Δz between states for the same conditions as in panel A. There are no significant differences in Δz between the conditions. Each point in panels A and B corresponds to an individual molecule. Boxes indicate the median and 25th and 75th percentile, and whiskers are the furthest datapoint outside the box, but within 1.5 times the box width. (C) Free energy differences between the open and closed state of the D3 interface. The free energy differences were obtained from the equilibrium data as F1/2⋅Δx and from the kinetics as ksT⋅log(τ0,closed/τ0,open). The data fall along the 45° line (dashed), indicating that the 2 estimates give consistent values. Comparison of the different conditions reveals a lower free energy difference for decreased pH of 6.2 and 5.5, indicating a destabilization of the domain at low pH. Small points correspond to data from individual molecules; large points with error bars indicate the mean ± standard deviation for each condition. (D) Average number of histidine contacts for several subdomains with the VWD3 domain, determined from equilibrium simulations. Two conditions were considered: histidines unprotonated (orange) or protonated (dark red). Contacts are defined as atoms with a distance < 0.35 nm. Statistically significant differences between the unprotonated and protonated histidine simulations are indicated by 2 stars corresponding to p < .01. (E) Crystallographic structure of the D′D3 domain with histidine residues that showed the strongest changes in average contacts indicated as spheres.
Lowering pH destabilizes the D3 interface
We analyzed the equilibrium and kinetics of the conformational change under different physiologically relevant conditions (Figure 5; supplemental Table 1). Specifically, we compared pH 7.4, characteristic of blood, with the lower pH conditions of pH 6.2 and 5.5, representative of the conditions in the trans-Golgi network and WPB, respectively. We find that the extension change Δz is insensitive to pH (Figure 5B), suggesting that the overall fold of the D3 domain and geometry of the transition is not affected in this pH range. However, we find a significant destabilization of the interface (P < .0041; 2-tailed t test for 2 independent means, performed on F1/2), reflected both in a lower midpoint force (Figure 5A, yellow [pH 7.4]: 8.3 ± 1.1 pN, orange [pH 6.2]: 7.2 ± 0.8 pN, and red [pH 5.5]: 6.6 ± 0.5 pN), and a corresponding decrease in ΔG0 (Figure 5C; pH 7.4: 9.0 ± 2.3 kcal/mol, pH 6.2: 6.8 ± 2.3 kcal/mol, pH 5.5: 6.3 ± 1.5 kcal/mol). Furthermore, the D3 interface becomes more dynamic and in particular the extrapolated lifetime in the open conformation is increased by decreased pH from 0.004 seconds at pH 7.4 to ∼0.3 seconds at pH 6.2 and pH 5.5, suggesting an approximately 10-fold higher exposure of the cysteines buried by the D3 interface at acidic pH.
Equilibrium simulations of the D'D3 domain mimicking conditions of neutral pH environments (all histidines unprotonated) and low pH conditions (all histidines protonated) revealed changes in the number of contacts between histidine residues and the surrounding subdomains (Figures 5D-E). The strongest effect was observed for the C8-VWD3 interface where the average number of contacts significantly decreased (by 28%) on histidine protonation, suggesting this interface to be the one destabilized the most by reduction in pH.
Role of Ca2+ ions in the D3 interface
Previously, it was reported that for successful VWF multimerization, low pH and Ca2+ are required.7 To investigate the role of Ca2+, we performed measurements in the presence of 10 mM EDTA to chelate divalent ions. In contrast to decreased pH, we found that EDTA does not significantly affect the stability of the interface (Figure 5A-C). The fact that the addition of EDTA does not alter the stability of the interface could either indicate that Ca2+ ions have only limited influence on the interface or that structural ions, for example, the ion positioned in a Ca2+ binding loop in VWD3 (Figure 2Ci), are so stably bound that they are not efficiently removed by EDTA.
FVIII binding stabilizes the D3 interface
We next used our MT assay to probe the transitions in the D3 domain in the presence of FVIII. We find a highly significant stabilization (P < .0078; 2-tailed t test for 2 independent means, performed on F1/2) of the D3 interface in the presence of ≈ 640 nM FVIII. FVIII has been reported to predominantly bind to the D′ submodules.23,24 Based on point mutations in the C8-3 domain, which lead to 2N von Willebrand disease phenotypes with decreased ability to bind FVIII, it was, however, hypothesized that FVIII could also have a less prominent interaction site in the C8-3 module.18 Our results strongly support a binding site in the D3 domain, as FVIII directly impacts the conformational change of the D3 interface.
Absence of D3 interface transitions in multimerized D′D3 domains
There is currently no crystal structure available for a dimerized D′D3 domain. Therefore, the native force propagation through the D′D3 domain in multimerized VWF is not known. To assess whether the conformational change in the D3 domain would mostly play a role in biosynthesis or might also occur in VWF multimers and potentially be relevant for VWF force activation, we investigated an “inverted” VWF dimer that is dimerized via its D′D3 domains (supplemental Figure 5). Here, we again observed A2 unfolding events, but no additional transitions, suggesting that the transition in the D3 interface only occurs prior to multimerization at the interface.
Discussion
VWF multimerization is a crucial process for successful hemostasis. It is known that the free cysteines Cys1099 and Cys1142, located in the N-terminal D′D3 domains, are crucially involved in multimerization in the trans-Golgi. However, the crystal structure of a monomeric D′D3 domain at neutral pH shows these 2 cysteines buried in a wedge-like structure formed by the VWD3–C8-3, TIL3, and E3 interface. The details of how the cysteines are exposed to enable multimerization were previously unknown. Recently, Springer et al45 hypothesized that Cys1099 attacks the cysteine bond between Cys1097 and Cys1091, forming a new bond with Cys1091 and releasing Cys1097 for disulfide bond formation with Cys1097′ in a second dimer. However, no matter whether Cys1099 or Cys1097 forms an inter-dimer disulfide bond alongside Cys1142, there must be a prior conformational change to expose both cysteines buried in the wedge. It has been hypothesized that this conformational change is induced by the acidic pH in the Golgi apparatus.18,45 Here, we used MT to examine a conformational transition in the D3 domain, peeling submodules C8-3, TIL3, and E3 off the larger VWD3 submodule and thus exposing the unbound cysteines. Studying the D3 interaction under various levels of constant force, we obtained force-dependent populations and rates that we extrapolated to zero load to characterize the stability of the interface. Both the extrapolated lifetimes and the estimated free energies suggest that the D3 interface is very stable at neutral pH, with a fraction of only about 1 in 107 molecules being in the open conformation at any given time in the absence of force, thus effectively shielding the free cysteines buried by the interface. At lower pH, characteristic of (trans-)Golgi and WPB, the D3 interface is significantly destabilized and becomes more dynamic. The pronounced pH dependency can be rationalized on the molecular level by the large number of histidine-residues in the interface that can be protonated at acidic pH and then likely destabilize the interaction between the 4 submodules.18 Biologically, the regulation of the conformational change by pH is of great importance for VWF’s biosynthesis to enable exposure of the buried cysteines involved in multimerization only under the acidic pH in the trans-Golgi network. The pH dependence demonstrated here might act in concert with cofactors, such as the D1D2 propeptide.7,46 The stability of the interface revealed by our assay suggests that VWF dimers are protected from forming premature cysteine bridges involving Cys1099 and Cys1142 in the ER, which would have the potential to disturb organized compaction and multimerization in the trans-Golgi network.
Finally, we characterized the D3 interface opening in the presence of FVIII. We found a statistically significant stabilization of the interface, indicating that FVIII not only binds to the D′ modules but also to the D modules of the D′D3 domain, an interaction that has previously been suggested by structural and biochemical information.19,23,25 Our results highlight how complex interactions regulate the biosynthesis and function of VWF and demonstrate how MT force spectroscopy can probe biologically relevant conformational changes under a broad range of conditions.
Acknowledgments
The authors thank Thomas Nicolaus and Angelika Kardinal for laboratory assistance; Wolfgang Ott for providing ELP linkers; and Magnus Bauer, Rafael C. Bernadi, Philipp U. Walker, Hermann E. Gaub, and Philip J. Hogg for helpful discussions.
This project was funded by Deutsche Forschungsgemeinschaft (German Research Foundation) project 201269156 (SFB 1032), project 386143268 (“Unraveling the Mechano-Regulation of Von Willebrand Factor”), RTG/GRK 2450, and INST 40/467-1 FUGG, by the state of Baden-Württemberg through bwHPC, and by the Klaus Tschira Foundation.
Authorship
Contribution: A.L., S.G., T.O., R.S., M.A.B., M.B., and J.L. designed research; S.G., and A.H. built instruments; A.L., S.G., and A.H. performed experiments; F.K., C.A.-S., R.J., and F.G. performed and analyzed simulations; T.O. and G.K. expressed proteins; A.L. and S.G. analyzed experimental data; and A.L., S.G., and J.L. wrote the paper with input from all authors.
Conflict-of-interest disclosure: The authors declare no competing financial interests.
Correspondence: Martin Benoit, Department of Physics and Center for NanoScience, LMU Munich, Amalienstrasse 54, 80799 Munich, Germany; e-mail: martin.benoit@physik.uni-muenchen.de; and Jan Lipfert, Department of Physics and Center for NanoScience, LMU Munich, Amalienstrasse 54, 80799 Munich, Germany; e-mail: jan.lipfert@lmu.de.

