

Key Points
Contemporary SA demonstrated comparable responses to conventional chemotherapy for treatment of patients with R/R PTCL.
Epigenetic and signaling modulators are comparable to chemotherapy in R/R PTCL–not otherwise specified and angioimmunoblastic TCL.

Abstract
Optimal treatment strategies for (relapsed and refractory [R/R]) peripheral T-cell lymphoma (PTCL) have not been well defined, and with the approval of several novel single agents (SA), the comparative efficacy of combination chemotherapy (CC) to single-agent strategies remains unclear. We conducted a meta-analysis to evaluate overall response rates (ORR) and toxicities of SA to CC. MEDLINE, Embase, Web of Science Core Collection, and Cochrane were systematically searched for phase I, phase II, and phase III trials investigating a defined SA or an anthracycline-, ifosfamide-, gemcitabine-, and platinum-based regimens. One hundred and fifty-one articles were included, encompassing single and combinations of 60 phase I trials involving 1075 patients, 95 phase II trials involving 3246, and 23 phase III trials involving 1888 patients. There was a high degree of heterogeneity in the trials. Using a random-effects model, the estimated ORR for SA in phase I trials were 40% (95% confidence interval [CI], 34.7%, 46.9%) relative to 41% for CC (95% CI, 27.4%, 56.1%; P = .97) and in phase II trials 34.4% (95% CI, 30.4%, 38.7%) for SA vs 55.3% (95% CI, 31%, 77.2%; P = .1) for CC. There were significant subgroup differences in ORR between histological subtypes of PTCL and drug classes. Our results highlight SA as an attractive outpatient option for R/R PTCL, and their incorporation in the development of upfront treatment paradigms merits urgent consideration. Our results underscore enrollment in clinical trials of SA as a critical strategy for R/R PTCL.
Introduction
Peripheral T-cell lymphomas (PTCL) arising from post-thymic lymphocytes have markedly diverse outcomes and are characterized by high rates of treatment resistance and relapse.1 Much information about the prognosis of PTCL has been collected over 20 years by the British Columbia Cancer Agency in Canada and the International Peripheral T-cell and Natural Killer/T-cell Lymphoma Study.2,3 These studies reported favorable responses for anaplastic large-cell lymphoma (ALCL), intermediate prognosis for PTCL–not otherwise specified (PTCL-NOS) and angioimmunoblastic TCL (AITL), and worse outcomes for histologies such as adult T-cell leukemia/lymphoma and others. A persistent unmet need to improve prognosis for these patients led to the approval of 4 single agents (SA) in the United States for treatment of relapsed and refractory (R/R) TCL with varying outcomes based on the histological subtype, thus providing attractive alternative strategies to combination chemotherapy (CC).4-9 In the COMPLETE registry of 420 patients, relapsed patients received single-agent therapies more often in the second line setting, with longer overall survival (OS) relative to those with primary refractory disease.10
Anecdotally, novel SA are preferred by physicians for the patients with poor performance status, whereas traditional ifosfamide-, platinum-, and gemcitabine-based regimens are reserved for transplant eligible patients and those with favorable comorbidity scores. Based on cohort-based and retrospective series, we and others have demonstrated that SA have comparable efficacy to traditional CC as first retreatment in R/R setting with the ability to bridge patients to stem cell transplantation and could be considered for use in the upfront strategy for the fit patient.11,12 Further, a recent multicenter study highlighted that within PTCLs, specific histological subtypes, such as those arising from T-follicular helper cells, may derive greater benefit from one class of drugs, such as histone deacetylase inhibitors, over others.13 Epigenetic modifiers alone and in combination with traditional chemotherapy backbones have demonstrated exceptionally high complete remission rates in T-follicular helper–derived PTCL patients in both upfront and R/R cases.14-16
The primary objective of this study was to define overall response rates (ORR) for novel SA relative to CC, which will inform clinicians and patients on the risks and benefits of the 2 strategies. The secondary objective of the study was to determine outcomes such as dose-limitations, drug discontinuations, and deaths. To address this central question, we conducted a meta-analysis of all SA and chemotherapy regimens in phase I, II, and III clinical trials in PTCL and cutaneous T-cell lymphoma (CTCL) patients in the upfront and R/R setting. We also assessed differences across histological subtypes, drug classes, and years of publication.
Methods
Search strategy, study selection, and inclusion
This systematic review is reported in accordance with the Preferred Reporting Items for Systematic Reviews and Meta-Analyses guidelines.17 Briefly, a Harvard University Librarian (P.B.) systematically searched the publication libraries of Controlled Trials (Wiley), MEDLINE (through Ovid SP), Embase, Web of Science Core Collection, and Cochrane's Central Register for adult patients with newly diagnosed and R/R PTCL and CTCL enrolled in phase I, II, and III clinical trials of novel single and cytotoxic drugs. The complete search strings are provided in supplemental Appendix 1. Briefly, we identified all publications reporting on single- or multiple-arm phase I, II, and III clinical trials with R/R TCL patients that received an established or experimental SA or CC given as monotherapy or in combination, ranging from 1946 to 1 June 2021. Three researchers (N.S., L.B., and R.S.) independently reviewed the titles and abstracts from the literature search and further reviewed the full text of the abstracts to ensure that they meet the eligibility criteria. Next, 2 authors independently extracted the data included in the literature. From each included study, we attempted to extract the following: baseline demographics and clinical characteristics; histological subtype and treatment characteristics; trial stage; clinical trial registration number; name, type, and class of experimental drug; intention-to-treat population; median lines of prior therapy and types of therapies including stem cell transplantation; ORR; and the toxicity profile as above. The primary outcome was the ORR, defined as a best-reported partial response or better. Secondary outcomes were toxicities, measured as dose-limiting toxicities (DLTs) and drug discontinuations. We used the “meta” (5.1-0) and “metafor” (3.0-2) packages for meta-analyses.18-21 Meta-analyses were conducted for ORR and toxicities, at the scale of logarithm of odd. Further details of the study selection process, including details on categorization of drugs into SA and CC groups, exclusion criteria, data extraction, risk of bias assessment, and statistical analysis, are included in the supplemental Extended Methods.
Results
Selection of studies
Our literature search identified 1870 original publications for review after removal of duplicates. After screening of the titles and abstracts, 394 potentially relevant articles were selected for full article review for eligibility. Of these, 151 articles were included for data extraction and quantitative analysis, with exclusion of duplicate studies by article review and national clinical trials reference number (supplemental Table 1). The selection process is depicted in Figure 1.

Preferred Reporting Items for Systematic Reviews and Meta-Analyses flow diagram of the study selection process. Schema to depict screening and filtering of articles and abstracts for inclusion and exclusion of eligible trials in the meta-analysis. df, degrees of freedom.
Preferred Reporting Items for Systematic Reviews and Meta-Analyses flow diagram of the study selection process. Schema to depict screening and filtering of articles and abstracts for inclusion and exclusion of eligible trials in the meta-analysis. df, degrees of freedom.
Study and patient characteristics
The 151 articles that were included for analysis together report the results of single or combined 60 phase I, 95 phase II, and 23 phase III trials (Table 1). In total, 6209 patients with TCL were included, of which 1075 in phase I, 3246 in phase II, and 1888 in phase III and combined phase trials were enrolled. As expected, the median number of patients enrolled across the various phases of trials ranged from 25 to 58.
Demographics and clinical characteristics
| Phase I* (n = 60) No. (%) | Phase II* (n = 95) No. (%) | Phase III* (n = 23) No. (%) | |
|---|---|---|---|
| Number of trials with TCL patients only | 27 | 66 | 19 |
| Total number of patients | 1791 | 3818 | 2782 |
| Number of T-cell lymphoma patients | 1075 | 3246 | 1888 |
| No. of patients (median, IQR)† | 25 (13-29) | 37 (25-49) | 58 (42-82) |
| Age (median, IQR)† | 62 (55-66) | 61 (55-64) | 58 (51-67) |
| Male, % (median, IQR) | 62 (56-68) | 62 (52-70) | 66 (65-67) |
| No. of trials reporting prior therapies | 34 (57) | 61 (64) | 18 (78) |
| No. of prior therapies (median, IQR)† | 3 (2-3) | 2 (0-3) | 0 (0-2) |
| No. of trials reporting IPI score ≥3‡,§ | 9 (15) | 27 (28) | 9 (39) |
| Percentage of patients with IPI score ≥3 (median, IQR)‖ | 60 (36-61) | 45 (41-56) | 46 (31-52) |
| Therapy | |||
| Novel SA | 36 (60) | 49 (52) | 5 (22) |
| CC | 7 (12) | 30 (32) | 15 (65) |
| SA + CC | 7 (12) | 9 (9) | 3 (13) |
| SA + SA | 10 (17) | 7 (7) | 0 (0) |
| Drug class* | |||
| Cytotoxic chemotherapy¶ | 10 (15) | 34 (33) | 17 (74) |
| Epigenetic modifiers# | 10 (15) | 16 (16) | 1 (4) |
| Antibody-drug conjugates** | 4 (6) | 6 (6) | 1 (20) |
| Therapeutic antibodies†† | 9 (13) | 14 (14) | 0 (0) |
| SMis‡‡ | 11 (16) | 10 (10) | 1 (4) |
| IMIDs§§ | 3 (4) | 7 (7) | 0 (0) |
| Other‖‖ | 10 (15) | 8 (8) | 0 (0) |
| Combination¶¶ | 11 (16) | 8 (8) | 3 (13) |
| Calendar period of publication | |||
| Before 2009 | 4 (7) | 12 (13) | 1 (4) |
| 2009-2015 | 19 (32) | 36 (38) | 2 (9) |
| 2016 and after | 37 (62) | 47 (49) | 20 (87) |
| Treatment setting* | |||
| Upfront | 8 (13) | 29 (31) | 17 (74) |
| Relapsed | 51 (85) | 61 (64) | 6 (26) |
| Upfront + relapsed | 1 (2) | 5 (5) | 0 (0) |
IMIDs, immunomodulatory drugs; IQR, interquartile range.
Combined phase trials such as I/II, II/III, or I/II/III, trials investigating multiple drug classes or combined upfront, and relapsed/refractory trials were included in >1 phase or category in Table 1 for analysis, thereby making the number of trials in each of these categories greater than the number of total trials included for the overall meta-analysis, but they were counted only once in the analysis and not duplicated.
Median (no. of patients per trial, age, male percentage, no. of prior therapies, IPI score >3) reflects information reported by studies at trial enrollment.
IPI score calculated based on age >60 years, stage III or IV Ann Arbor system, elevated lactate dehydrogenase, Eastern Cooperative Oncology Group performance status of 2 to 4, and ≥2 extra nodal sites of disease.
Represents number (percentage) of trials reporting patients with IPI score ≥3 at trial enrollment.
Represents percentage of patients with IPI score ≥3 at trial enrollment reported by the study.
Cytotoxic chemotherapy arm included anthracycline-, ifosfamide-, gemcitabine-, and platinum-based treatments.
Epigenetic modifiers included histone deacetylase inhibitors (romidepsin, belinostat, chidamide), DNA methyltransferase inhibitors (azacytidine and decitabine), and EZH1/2 inhibitors (tazemetostat and valmetostat).
Antibody-drug conjugates included brentuximab vedotin and camidanlumab tesirine.
Therapeutic antibodies included alemtuzumab, nivolumab, pembrolizumab, durvalumab, avelumab, and anti-CD47 monoclonal antibody TTI621 and TTI622.
SMis included inhibitor of PI3K/AKT/mTOR, JAK/STAT, ALK (duvelisib, tenalisib, everolimus, ruxolitinib, cerdulatinib, crizotinib), aurora kinase (alisertib), farnesyl transferase, and proteosome pathways (tipifarnib, fenritinide, bortezomib).
IMIDs included cereblon inhibitors (lenalidomide and CPI 818).
Drugs in the “other” category included ixazomib, avadomide, E777, darinaparsin, RH IL-15, valganciclovir, denileukin, bortezemib, carfilzomib, selinexor, 13 cis-retinoic acid, and interferon α.
Combination includes trials of cytotoxic chemotherapy with other drug classes.
The median age and sex at the time of study enrollment reported by studies was comparable across the different phases of trials (Table 1). Thirty-four (57%) of phase I trials, 61 (64%) of phase II trials, and 18 (78%) of phase III trials reported data on the median lines of prior therapies received by patients before participation in the trial, whereas only 15%, 28%, and 39% of phase I, II, and III trials reported International Prognostic Index (IPI) score for patients at the time of study enrollment. Among studies reporting median number of prior therapies at the time of trial participation, the range was comparable between phase I and phase II trials. The percentage of patients with IPI score ≥ 3 representing patients with greater than high-intermediate risk disease was also comparable across phase I, II, and III trials.
We divided all included studies into 4 subgroups based on the primary therapy received in the trial and as defined by us (see study selection): novel SA (36, 49, and 5 phase I, II, and III trials), CC (7, 30, and 15 phase I, II, and III trials), combination of novel SA and CC (7, 9, and 3 phase I, II, and III trials), and combination of novel SA (SA plus SA; 10 and 7 phase I and II trials). In addition, we subdivided the studies into 8 different subgroups based on the drug class of the established or experimental compound: cytotoxic chemotherapy alone, which included anthracycline-, ifosfamide-, gemcitabine-, platinum-, antifolate-, or topoisomerase inhibitor–based regimens; epigenetic modifiers, which included histone deacetylase, DNA methyltransferase, and enhancer of zeste homolog 1 and 2 inhibitors; antibody-drug conjugates; therapeutic antibodies; small-molecule inhibitors (SMis); immunomodulatory drugs; other; and combinations of the aforementioned drugs.
We stratified all included studies into 3 subgroups based on their year of publication and categorized all included studies based on time of treatment at accrual into upfront and relapsed subgroups (Table 1). The number of patients included in each subgroup is represented in Table 2.
Patient distribution in each category
| Phase I (n = 60) No. (%) | Phase II (n = 95) No. (%) | Phase III (n = 23) No. (%) | |
|---|---|---|---|
| Treatment group | |||
| Novel SA | 1258 (70) | 2067 (54) | 277 (10) |
| CC | 193 (11) | 1315 (34) | 1574 (57) |
| SA + CC | 182 (10) | 281 (7) | 931 (33) |
| SA + SA | 158 (9) | 155 (4) | 0 (0) |
| Drug class | |||
| Cytotoxic chemotherapy* | 320 (17) | 1447 (36) | 1685 (61) |
| Epigenetic† | 202 (10) | 708 (18) | 17 (1) |
| Antibody-drug conjugate‡ | 135 (7) | 244 (6) | 66 (2) |
| Therapeutic antibodies§ | 374 (19) | 437 (11) | 0 (0) |
| SMi‖ | 460 (24) | 503 (13) | 83 (3) |
| IMIDs¶ | 38 (2) | 191 (5) | 0 (0) |
| Other# | 180 (9) | 212 (5) | 0 (0) |
| Combination | 225 (12) | 248 (6) | 931 (33) |
| Calendar period of publication | |||
| Before 2009 | 98 (5) | 375 (10) | 33 (1) |
| 2009-2015 | 507 (28) | 1603 (42) | 86 (3) |
| 2016 and after | 1186 (66) | 1840 (48) | 2663 (96) |
| Treatment setting | |||
| Upfront** | 256 (14) | 1205 (32) | 2482 (89) |
| Relapsed | 1498 (84) | 2439 (64) | 300 (11) |
| Upfront + relapsed | 37 (2) | 174 (5) | 0 (0) |
IMIDs, immunomodulatory drugs.
Cytotoxic chemotherapy arm included anthracycline-, ifosfamide-, gemcitabine-, and platinum-based treatments.
Epigenetic modifiers included histone deacetylase inhibitor (romidepsin, belinostat, chidamide), DNA methyltransferase inhibitor (azacytidine and decitabine), and EZH1/2 inhibitor (tazemetostat and valmetostat).
Antibody-drug conjugates included brentuximab vedotin and camidanlumab tesirine.
Therapeutic antibodies included alemtuzumab, nivolumab, pembrolizumab, durvalumab, avelumab, and anti-CD47 monoclonal antibody TTI621 and TTI622.
SMis included inhibitor of PI3K/AKT/mTOR, JAK/STAT, ALK (duvelisib, tenalisib, everolimus, ruxolitinib, cerdulatinib, crizotinib), aurora kinase (alisertib), farnesyl transferase, and proteosome pathways (tipifarnib, fenritinide, bortezomib).
IMIDs included cereblon inhibitors (lenalidomide and CPI 818).
Drugs in the “other” category included: ixazomib, avadomide, E777, darinaparsin, RH IL-15, valganciclovir, denileukin, bortezemib, carfilzomib, selinexor, 13 cis-retinoic acid, and interferon α.
Although data were collected for these trials, newly diagnosed patients were not included in the overall meta-analysis and subgroup analyses.
Treatment outcomes in R/R T-cell lymphoma
Response rates in phase I, II, and III trials of SA relative to chemotherapy.
We first compared the ORR between SA and CC for patients with R/R TCL regardless of the histological subtype. The estimated ORR for novel SA was 37.4% (95% confidence interval [CI], 33.5%, 41.4%) relative to 54.6% for CC (95% CI, 42.0%, 66.6%; P = .006); 61.7% (95% CI, 40.4%, 79.3%) for the SA plus CC; and 51.2% (95% CI, 42.2%, 60.1%) for the SA plus SA group, highlighting higher responses in the chemotherapy and combination of chemotherapy with single-agent subgroups in comparison with SA alone (P = .001) (Figure 2A). We then stratified ORR by phase of the trial. Fifty-two trials in phase I, of which 36 administered novel SA, 3 delivered CC, 3 delivered combinations of CC and SA, and 10 delivered novel SA with other SA were included in this analysis. The degree of heterogeneity among the phase I trials for ORR was 50.7% (supplemental Figure 1A). For phase I trials, the ORR across the 4 groups were comparable, with a P value of .35. In the markedly varied phase II trials, including 47 trials of SA, 9 trials of CC, 4 trials of CC with SA, and 6 trials of SA with other SA, higher ORR was noted in the CC (59.0%; 95% CI, 44.6%, 72.0%) relative to SA alone (36.8%; 95% CI, 32.1%, 41.8%; P = .004) (supplemental Figure 1B). Also, when the SA group was compared with the group of SA with other SA (51.0%; 95% CI, 38.5%, 63.3%), lower ORR yielding statistical significance (P = .04) was observed. No statistically significant differences were observed when comparisons were made with other groups for this phase of trials. Only 1 phase III trial of CC was eligible for analysis opposite 5 trials of SA, and the ORR between the 2 groups were comparable (P = .25) (supplemental Figure 1C).
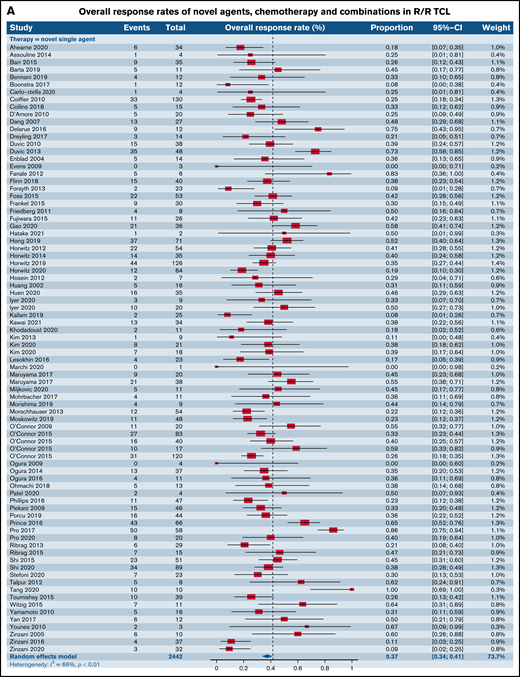
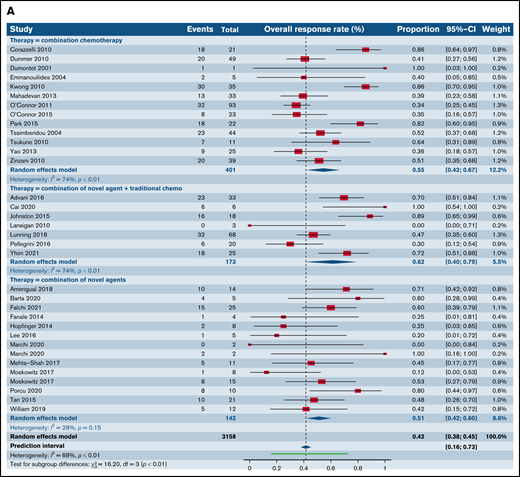
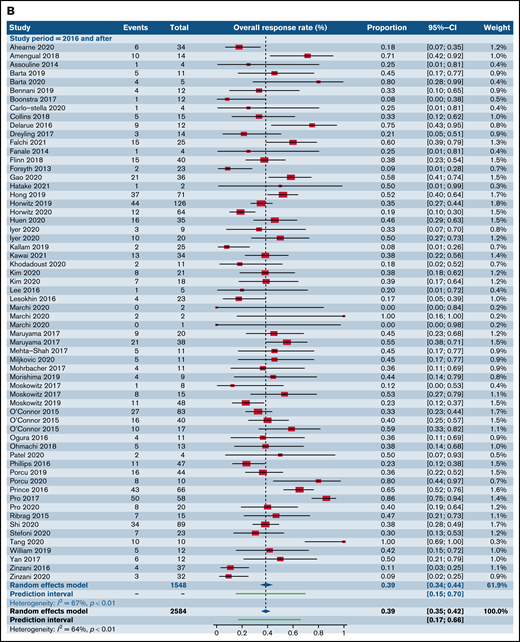
Forest plots of ORR between novel SA, chemotherapy, and their combinations stratified by histological type. ORR across all trials in patients with R/R TCL (A), ORR across all trials in patients with R/R PTCL (B), and ORR across all trials in patients with R/R CTCL (C). Forest plots are arranged in alphabetical order by author’s last name. Squares represent estimated proportions, with the size of the squares representing the weight of each trial according to the inverse variance method. Horizontal lines through the squares indicate 95% CIs. The points of the diamond indicate the 95% CI of the pooled mean. Horizontal line at the bottom indicates the prediction interval. Blank lines indicate missing information from the trial manuscript.
Forest plots of ORR between novel SA, chemotherapy, and their combinations stratified by histological type. ORR across all trials in patients with R/R TCL (A), ORR across all trials in patients with R/R PTCL (B), and ORR across all trials in patients with R/R CTCL (C). Forest plots are arranged in alphabetical order by author’s last name. Squares represent estimated proportions, with the size of the squares representing the weight of each trial according to the inverse variance method. Horizontal lines through the squares indicate 95% CIs. The points of the diamond indicate the 95% CI of the pooled mean. Horizontal line at the bottom indicates the prediction interval. Blank lines indicate missing information from the trial manuscript.
Response rates in phase I, II, and III trials of SA relative to CA subdivided by histological type.
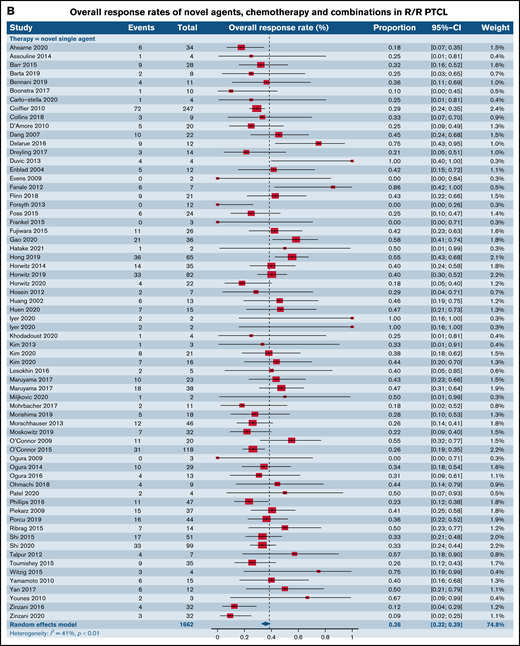
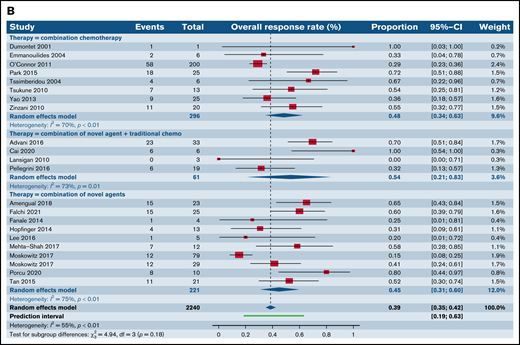
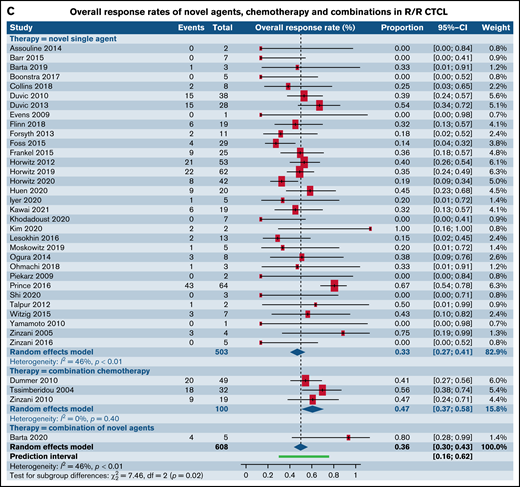
We then contrasted ORR for SA and CA stratified by histological types such as PTCL and CTCL. Of note, 56 (16 phase I, 27 phase II, and 13 phase III) out of the 178 total trials, accounting for 31.6% of the trials in our analysis, did not report ORR stratified by histological subtype of the TCL. For patients with R/R PTCL, 66 trials administering SA were compared with 8 trials of CC, 4 trials of SA plus CC, and 10 trials of SA plus SA. This demonstrated ORR of 35.7% for SA (95% CI, 32.2%, 39.4%) relative to 48.4% for CC (95% CI, 34.5%, 62.6%), 53.6% (95% CI, 21.1.%, 83.3%) for SA plus CC, and 44.9% for SA plus SA groups (95% CI, 30.7%, 60.0%), rendering no statistical difference (P = .18) (Figure 2B). However, for patients with R/R CTCL, estimated response rates were lower at 33.3% across 32 trials of SA (95% CI, 26.6%, 40.7%) as opposed to 47.2% for 3 trials of CC (95% CI, 37.0%, 57.6%) and 80.0% (95% CI, 30.9%, 97.3%) for 1 trial of SA plus SA, resulting in statistical significance (P = .02) (Figure 2C).
We next analyzed studies stratified by both trial phase and histological subtype of TCL. When examining patients with R/R PTCL, comparable response rates were found in 32 phase I trials of SA (40.7%; 95% CI, 34.7%, 46.9%) and 3 phase I trials of CC (41.0%; 95% CI, 27.4%, 56.2%; P = .97) (Figure 3A; supplemental Table 2). No statistical difference was observed between response rates in 38 phase II trials of patients with R/R PTCL treated with SA (34.5%; 95% CI, 30.4%, 38.8%) when contrasted with 5 phase II trials of CC (55.3%; 95% CI, 31.0%, 77.3%; P = .10) (Figure 3B). Response rates in 18 phase II trials for patients with R/R CTCL was estimated at 34.3% (95% CI, 27.1%, 42.3%) for SA, whereas it was higher at 47.0% (95% CI, 37.4%, 56.9%) for the 3 CC trials, rendering statistical significance (P = .05) (Figure 3C). Comparative analysis for SA or CC in phase III trials in patients with R/R PTCL, phase I and phase III trials for patients with R/R CTCL could not be made due to either absence of eligible trials or extremely small numbers. No statistical difference was observed between response rates for novel SA relative to CC in phase I and III clinical trials that did not report histological subtype-specific responses(Table 3). However, statistically higher responses were observed for patients in phase II trials upon treatment with CC.
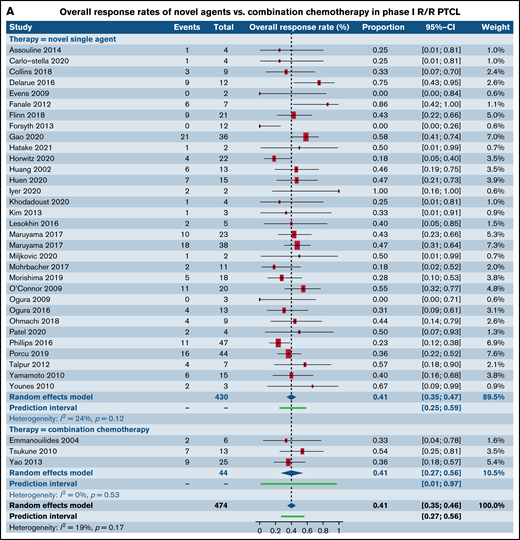
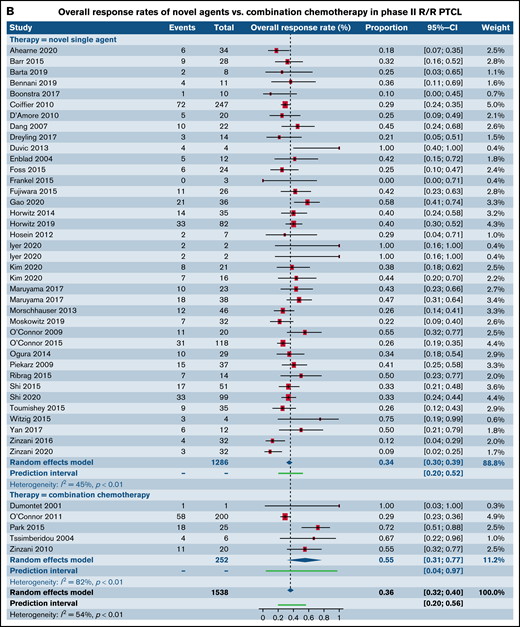
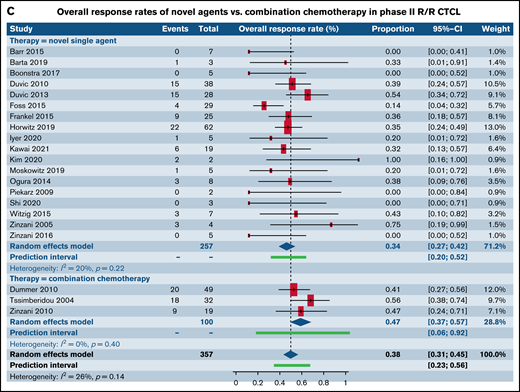
Forest plots of ORR between novel SA and CA stratified by phase. ORR in phase I trials in patients with R/R PTCL (A), ORR in phase II trials in patients with R/R PTCL (B), and ORR in phase II trials in patients with R/R CTCL (C). Forest plots are arranged in alphabetical order by author’s last name. Squares represent estimated proportions, with the size of the squares representing the weight of each trial according to the inverse variance method. Horizontal lines through the squares indicate 95% CIs. The points of the diamond indicate the 95% CI of the pooled mean. Horizontal line at the bottom indicates the prediction interval. Blank lines indicate missing information from the trial manuscript.
Forest plots of ORR between novel SA and CA stratified by phase. ORR in phase I trials in patients with R/R PTCL (A), ORR in phase II trials in patients with R/R PTCL (B), and ORR in phase II trials in patients with R/R CTCL (C). Forest plots are arranged in alphabetical order by author’s last name. Squares represent estimated proportions, with the size of the squares representing the weight of each trial according to the inverse variance method. Horizontal lines through the squares indicate 95% CIs. The points of the diamond indicate the 95% CI of the pooled mean. Horizontal line at the bottom indicates the prediction interval. Blank lines indicate missing information from the trial manuscript.
Overall response rate stratified by novel SA vs CA in patients with R/R TCL in phase I, II, and III clinical trials lacking histological subtype–specific responses
| Novel SA | CC | P value | |
|---|---|---|---|
| Phase I | 0.43 [0.32, 0.54] (n = 6)* | 0.40 [0.10, 0.80] (n = 1) | .9 |
| Phase II | 0.30 [0.18, 0.44] (n = 7) | 0.75 [0.5, 0.92] (n = 4) | .002 |
| Phase III | 0.40 [0.28, 0.54] (n = 3) | 0.35 [0.18, 0.56] (n = 1) | .64 |
| Novel SA | CC | P value | |
|---|---|---|---|
| Phase I | 0.43 [0.32, 0.54] (n = 6)* | 0.40 [0.10, 0.80] (n = 1) | .9 |
| Phase II | 0.30 [0.18, 0.44] (n = 7) | 0.75 [0.5, 0.92] (n = 4) | .002 |
| Phase III | 0.40 [0.28, 0.54] (n = 3) | 0.35 [0.18, 0.56] (n = 1) | .64 |
Numbers in parenthesis represent number of clinical trials included for analysis in that category.
We also analyzed differences utilizing various permutations and combinations of SA and CC in phase I and II trials of PTCL (supplemental Figure 2). Pairwise comparisons across 4 groups (SA, CC, SA plus CC, and SA plus SA) in phase I trials demonstrated no superior subgroup (P = .74) (supplemental Figure 2A). However, within phase II trials in patients with R/R PTCL, combination of SA plus SA exhibited higher ORR (55.2%; 95% CI, 43.9%, 66.0%) relative to SA alone (34.5%; 95% CI, 30.6%, 38.6%; P = .0006) but was comparable to the CC group (P = .94) (supplemental Figure 2B).
Response rates of SA relative to CA stratified by histological subtype of PTCL.
Having observed comparable response rates in patients with R/R PTCL in phase I and II trials between SA and CC, we wanted to further characterize the responses in the most common histological subtypes such as PTCL-NOS, AITL, ALCL, and natural killer/T-cell lymphoma (NK/TCL). Although the numbers of trials administering CA was disproportionately lower than those administering SA, comparable responses were seen between the 2 groups across all the 4 common histologies (Figure 4A-D; Table 4).
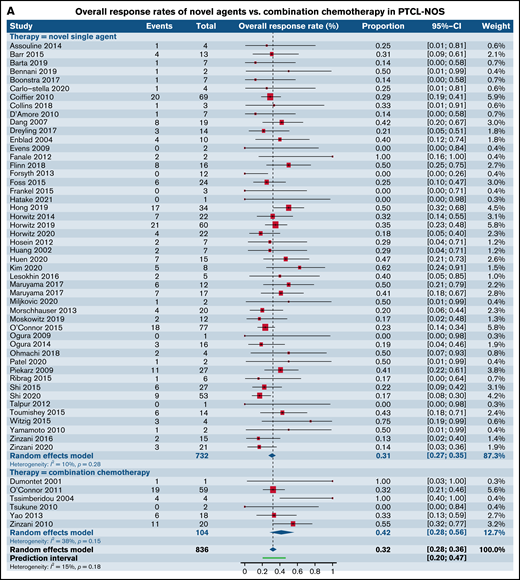
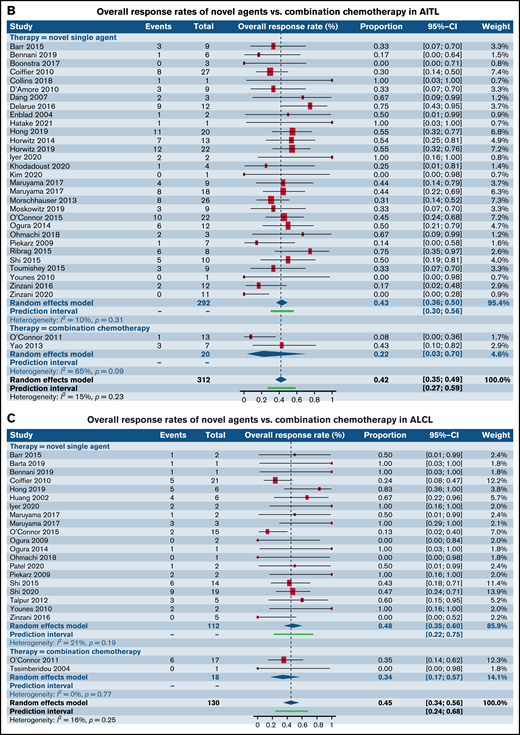
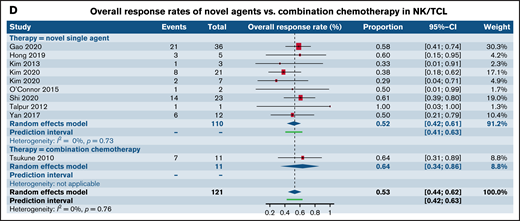
Forest plots of ORR between novel SA and CA stratified by histological subtype of PTCL. ORR in patients with R/R PTCL-NOS (A), ORR in patients with R/R AITL (B), ORR in patients with R/R ALCL (C), and ORR in patients with R/R extranodal NK/TCL (D). Forest plots are arranged in alphabetical order by author’s last name. Squares represent estimated proportions, with the size of the squares representing the weight of each trial according to the inverse variance method. Horizontal lines through the squares indicate 95% CIs. The points of the diamond indicate the 95% CI of the pooled mean. Horizontal line at the bottom indicates the prediction interval. Blank lines indicate missing information from the trial manuscript.
Forest plots of ORR between novel SA and CA stratified by histological subtype of PTCL. ORR in patients with R/R PTCL-NOS (A), ORR in patients with R/R AITL (B), ORR in patients with R/R ALCL (C), and ORR in patients with R/R extranodal NK/TCL (D). Forest plots are arranged in alphabetical order by author’s last name. Squares represent estimated proportions, with the size of the squares representing the weight of each trial according to the inverse variance method. Horizontal lines through the squares indicate 95% CIs. The points of the diamond indicate the 95% CI of the pooled mean. Horizontal line at the bottom indicates the prediction interval. Blank lines indicate missing information from the trial manuscript.
Overall response rate stratified by novel SA vs CA in patients with R/R PTCL in phase I, II, and III clinical trials subdivided by histological subtype
| Novel SA | Combination chemotherapy | P value | |
|---|---|---|---|
| PTCL-NOS | 0.31 [0.27, 0.35] (n = 49)* | 0.42 [0.28, 0.58] (n = 6) | .16 |
| AITL | 0.43 [0.36, 0.50] (n = 30) | 0.22 [0.03, 0.70] (n = 2) | .37 |
| ALCL | 0.48 [0.36, 0.60] (n = 20) | 0.34 [0.17, 0.57] (n = 2) | .31 |
| NK/TCL | 0.52 [0.42, 0.61] (n=9) | 0.63 [0.34, 0.86] (n=1) | .46 |
Numbers in parenthesis represent number of clinical trials included for analysis in that category.
Response rates of SA relative to CA stratified by histological subtype and class of drug.
We next investigated differences in response rates based on drug class in patients with R/R PTCL-NOS and AITL, the 2 most common histological subtypes of PTCL. We specifically compared responses between CC and epigenetic modifiers involving histone deacetylase, DNA methyltransferase, and EZH1/2 inhibitors. Among patients with PTCL-NOS, across 9 trials utilizing CC and 13 trials administering epigenetic therapies, higher response rates were seen in the CC arm (49.8%; 95% CI, 36.7%, 62.9%) in comparison with the epigenetic therapies (29.1%; 95% CI, 23.9%, 34.8%; P = .004) (Figure 5A). However, among patients with AITL where 5 trials of CC were compared with 11 trials of epigenetic therapies, comparable responses were seen between the 2 (P = .35) (Figure 5B). Next, we contrasted responses in patients with R/R PTCL-NOS and AITL between CC and SMis. Within the PTCL-NOS subtype, 9 CC trials and 11 SMi trials were eligible for analysis. When contrasted with each other, response rates were comparable between the 2 groups (CC, 49.8%; 95% CI, 36.7%, 62.9%; vs SMi, 34.4%; 95% CI, 26.0%, 43.9%), and no statistical difference was seen (P = .06) (Figure 5C). Similar results were observed for patients with AITL between CC and SMi trials (P = .67) (Figure 5D).
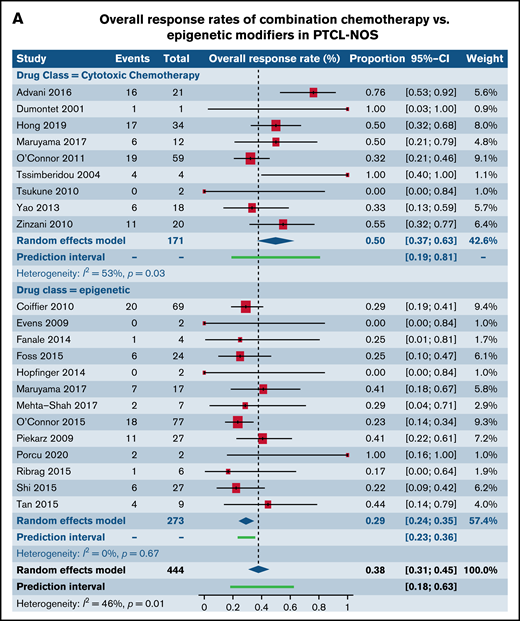
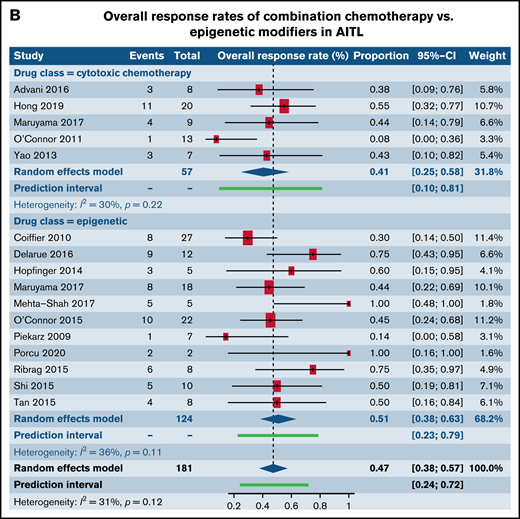
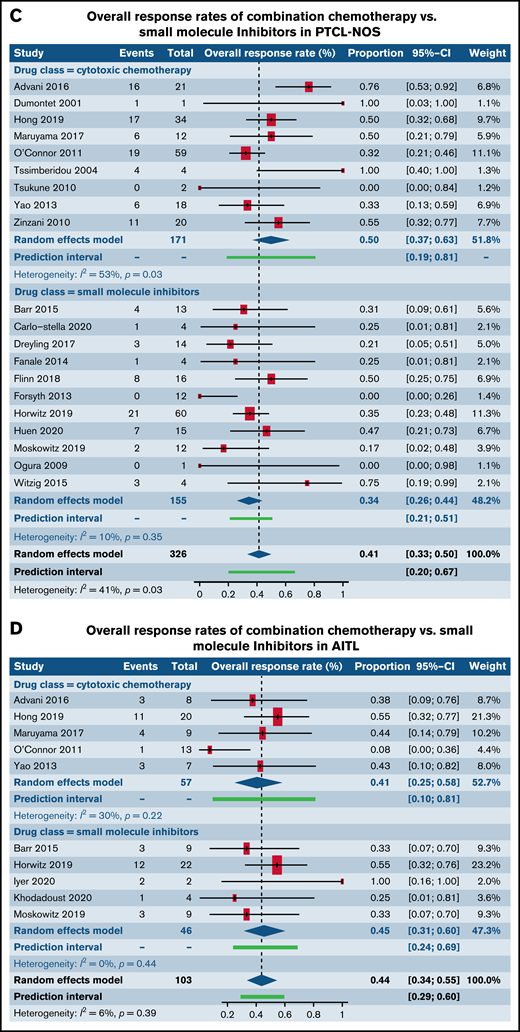
Forest plots of ORR stratified by drug class. ORR between cytotoxic chemotherapy and epigenetic modifiers in patients with R/R PTCL-NOS (A), ORR between cytotoxic chemotherapy and epigenetic modifiers in patients with R/R AITL (B), ORR between cytotoxic chemotherapy and SMis in patients with R/R PTCL-NOS (C), and ORR between cytotoxic chemotherapy and SMis in patients with R/R AITL (D). Forest plots are arranged in alphabetical order by author’s last name. Squares represent estimated proportions, with the size of the squares representing the weight of each trial according to the inverse variance method. Horizontal lines through the squares indicate 95% CIs. The points of the diamond indicate the 95% CI of the pooled mean. Horizontal line at the bottom indicates the prediction interval. Blank lines indicate missing information from the trial manuscript.
Forest plots of ORR stratified by drug class. ORR between cytotoxic chemotherapy and epigenetic modifiers in patients with R/R PTCL-NOS (A), ORR between cytotoxic chemotherapy and epigenetic modifiers in patients with R/R AITL (B), ORR between cytotoxic chemotherapy and SMis in patients with R/R PTCL-NOS (C), and ORR between cytotoxic chemotherapy and SMis in patients with R/R AITL (D). Forest plots are arranged in alphabetical order by author’s last name. Squares represent estimated proportions, with the size of the squares representing the weight of each trial according to the inverse variance method. Horizontal lines through the squares indicate 95% CIs. The points of the diamond indicate the 95% CI of the pooled mean. Horizontal line at the bottom indicates the prediction interval. Blank lines indicate missing information from the trial manuscript.
Response rates of SA relative to CA stratified by calendar period.
We also assessed ORR for all trials involving CC and combinations of SA with other SA stratified by year of publication across 3 time distributions: prior to 2009, 2010 through 2015, and following 2016. There were no statistically significant differences between the ORR across the 3 individual time distributions within the categories of CC (Figure 6A) and SA with other SA (Figure 6B) (supplemental Table 3).
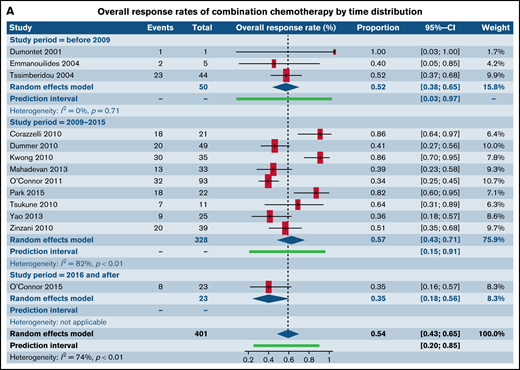
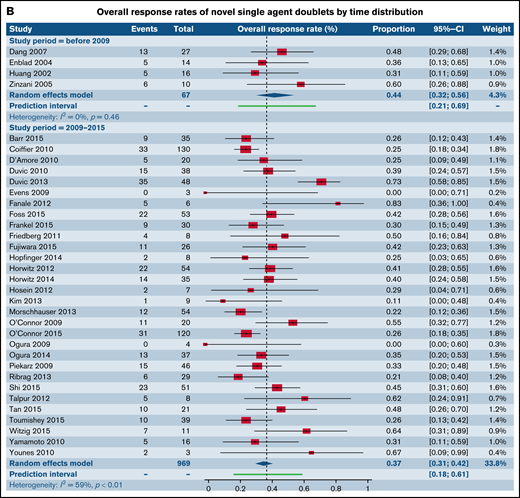
Forest plots of ORR between novel SA doublets and CA in patients with R/R TCL stratified by calendar period of publication. ORR for CA (A) and ORR for novel SA and its combinations with other SA (B). Forest plots are arranged in alphabetical order by author’s last name. Squares represent estimated proportions, with the size of the squares representing the weight of each trial according to the inverse variance method. Horizontal lines through the squares indicate 95% CIs. The points of the diamond indicate the 95% CI of the pooled mean. Horizontal line at the bottom indicates the prediction interval. Blank lines indicate missing information from the trial manuscript.
Forest plots of ORR between novel SA doublets and CA in patients with R/R TCL stratified by calendar period of publication. ORR for CA (A) and ORR for novel SA and its combinations with other SA (B). Forest plots are arranged in alphabetical order by author’s last name. Squares represent estimated proportions, with the size of the squares representing the weight of each trial according to the inverse variance method. Horizontal lines through the squares indicate 95% CIs. The points of the diamond indicate the 95% CI of the pooled mean. Horizontal line at the bottom indicates the prediction interval. Blank lines indicate missing information from the trial manuscript.
Toxicities in R/R T-cell lymphoma
Rate of DLTs in phase I trials, drug discontinuation in phase I and II trials, deaths attributable to study drugs, and incidence of grade 3 or higher adverse events (AEs) were collected as surrogate markers of important drug-related side effects for patients with R/R TCL. Twenty-six of the total 60 phase I trials reported DLTs, 22 did not report, and 12 did not reach DLT. Percentage of patients with DLT’s among the studies reporting DLTs ranged from 0 to 17, with a median of 5. We were able to gather drug discontinuation data secondary to study drugs for 24 phase II trials of novel SA and 4 phase II trials of CC for R/R patients with TCL. The estimated incidence of drug discontinuations for the SA group was 16.3% (95% CI, 13.5%, 19.6%) vs 10.6% (95% CI, 3.7%, 26.7%) for the CC group (P = .40) (supplemental Figure 3A). Deaths across phase II trials for patients with R/R TCL reported as secondary to study drugs were compared between 17 trials of SA (4.9%; 95% CI, 2.7%, 8.8%) relative to 3 trials of CC (3.6%; 95% CI, 1.3%, 9.2%) and demonstrated no statistical difference (P = .58) (supplemental Figure 3B). No subgroup differences were observed for rates of drug discontinuation and deaths between CC and SA when stratified by drug class. We also performed a comparative evaluation of the most common grade 3 or higher hematologic and nonhematologic toxicities across all phase trials administering novel SA and CC. The most common hematological and nonhematological toxicities reported in >5% of patients are exhibited in supplemental Tables 4 and 5. Comparable grade 3 cytopenias were exhibited by both groups. When examining grade 3 or higher nonhematologic toxicities in >5% of the patients, nausea and vomiting were most common AEs among trials of SA. In contrast, transaminitis, infusion reaction, and decreased appetite were the most common AEs for the CC group. Of note, the rates of these several high-grade toxicities were comparable in both groups.
Discussion
No prospective trials have directly compared the efficacy and toxicity of SA with CC in TCL. This meta-analysis investigating responses and AEs of novel compounds and established regimens offered a unique opportunity to probe this critical question, albeit in a retrospective manner.
Our systematic and comprehensive meta-analysis exhibited that in patients with R/R PTCL, novel agents have comparable efficacy, in terms of response rates, to traditional chemotherapy regimens, thereby situating SA as a very attractive outpatient treatment alternative to chemotherapy for patients. We did not find statistical evidence of a difference between the 2 groups, which could be due to lack of sufficient power when we considered 5% and 10% difference as the true difference between the 2 groups. This was despite the aggregation of data from multiple studies. As expected, the number of trials of CA in subjects with R/R CTCL was too small to derive definitive conclusions about its relative efficacy in comparison with SA. Our study confirmed that both number of trials and number of study participants per trial have increased over time for patients with R/R TCL, which parallels current clinical impressions. Within the limitations of this retrospective analysis, our subgroup analyses demonstrated comparable response rates between epigenetic therapies and SMis of signaling pathways when contrasted with CC for the PTCL-NOS and AITL subgroups, commensurate with other recent reports. Due to the small number of studies that met eligibility, it was challenging to draw definitive impressions about comparative efficacy of novel agent doublets or combinations of novel agents and chemotherapy to CA alone.
As a surrogate marker for important drug-related toxicities, we chose the rate of DLTs, drug discontinuations and deaths in trials. There were comparable rates of DLTs, drug discontinuations, and deaths between SA and CC. With the advent of targeted therapies and immune therapies, the linear relationship between dose and efficacy, as well as dose and toxicity, are less apparent. The toxicity results are confounded by the differential AE profile for SA vs CC. Historically, CC-related DLTs and drug discontinuations are mostly secondary to reversible side effects. However, long-term nonimmune and immune consequences of novel drugs remain poorly understood.
Despite limitations inherent in a retrospective review of data from multiple studies over a range of treatment years, we believe that this meta-analysis demonstrates patterns of responses that exist among patients with TCL with increased statistical power compared with individual studies. This study population of 6209 patients allowed us to test our hypothesis that contemporary agents can have comparable efficacy when contrasted with CA combinations. It also rendered the feasibility to assess toxicities including DLTs, drug discontinuations, and deaths attributable to study drugs, although the number of CC trials was small. Biases associated with publications were graded and examined utilizing appropriate biostatistical tools, enabling us to include least biased studies. Thorough and careful assessment of various studies longitudinally from initial abstracts to final manuscript publications helped resolve inconsistencies in research and identified potential moderating or mediating variables such as those involved in IPI score generation, a useful practical tool for prognosticating outcomes. Of note, we found that up to 43% of the trials accruing patients with R/R TCL did not report any details on prior therapies at the time of study enrollment. We also found that 40% to 80% of the trials did not report IPI scores or information on variables used for its calculation. At least one-third of the trials did not report ORR by histological subtype of TCL, thereby creating considerable uncertainty and bias to the development and execution of next-phase clinical trials. It is to be noted that when comparisons were made across all phase trials, and specifically for phase II trials b.w SA and CC, we noted statistically higher ORR for CC. This could be due to heterogeneity in the included trials, diversity in the histological-subtype of patient populations enrolled over the last 2 decades, averaging of results across various dose levels, the very small number of phase III trials administering CC among others.
A major limitation of this and other similar retrospective meta-analyses evaluating outcome differences based on treatment strategies is the considerable heterogeneity that exists between individual trials because of the prior drug exposure of patients. This is reflected not only by differences in the median line of therapies received before participating in a trial, but the response to the experimental drug also depends on the type of drugs a patient has received at initial diagnosis and subsequent relapses. In addition, regimens and treatment strategies have not only changed considerably over the past decade but have been influenced by factors such as region of the world the patient is treated in and availability of conventional and novel agents. Therefore, trial results are dependent on how, when, and where a patient was treated previously. As such, the heterogeneity in patient populations between trials poses limitations on the generalizability of our findings. Therefore, we considered it inappropriate to provide a single estimate of the response rates as a mean of all early-phase trials. Instead, we provided the 95% CI of the estimated mean and the prediction intervals. The 95% CI presents a summary of the treatment effect, whereas the prediction interval shows the range of effects that can be expected in future similar studies. We would like to acknowledge another limitation which is that the toxicity and efficacy data from the dose escalation portion of phase I studies may not be representative of the true profile of the agent(s) studied, due to subtherapeutic doses, resulting in potential skewing of results.
Another shortcoming when including early phase clinical trials is that the primary outcome is the best response, which is a surrogate marker for improved OS. Although ORR and OS are associated, higher ORR might not necessarily translate to an improvement in OS. Progression-free survival, OS, and time to next treatment are better measurements of clinical benefit but are not consistently reported for early-phase clinical trials and as such were not included in our analysis. The results of our meta-analysis may also be limited by inclusion of an albeit small cohort of trials of SA that have only reported preliminary results in an abstract format and not the final study data. Given the nature of our meta-analysis and the rarity of T-cell lymphomas, most included trials had expected small sample sizes, and many of the trials did not report overall response rates stratified by histological subtype of PTCL, hence portending the potential to be led to imprecise conclusions about specific efficacy of drugs in any subtype of TCL. Given that the studies included in the meta-analysis spanned across at least 2 decades, there was considerable heterogeneity of methods used in studies that may lead to erroneous inferences. Another limitation of this meta-analysis is lack of centralized pathological review in most of the trials and ongoing revision of the World Health Organization classification of PTCL over the 20 years of this review. Lack of reporting of intent of therapy and differential response rates in relapsed vs primary refractory patients were observed through all phases of trials.
In summary, this meta-analysis represents the most comprehensive review of treatment for R/R TCL patients over the last 2 decades. We found that the ORR of SA in early-phase clinical trials is highly variable but may be comparable to other approaches, such as combination chemotherapies, and should be considered early in the treatment algorithm for R/R T cell lymphomas. Conversely, lack of access to novel SA in several countries does not seem to jeopardize outcomes for these patients. In the era of highly effective SA therapies which present an evolution of treatment strategies over CC for patient with R/R TCL, our findings support early participation in clinical trials of novel SA. It also provides preliminary information to propel a prospective randomized clinical trial comparing combinations of SA to CC to ultimately address this central question.
Acknowledgments
This work was supported by Acrotech Biopharma, LLC. S.J. is supported by the National Institutes of Health National Cancer Institute K08 Career Development Award (K08CA230498).
Authorship
Contribution: S.J. designed the research; N.S., M.J.K., L.B., H.J.P., R.S., P.B., F.M.F., C.S., and S.J. performed the research; M.J.K., H.J.P., C.S., and S.J. analyzed data; R.S., P.B., F.M.F., and C.S. reviewed the manuscript; and N.S. and S.J. wrote the manuscript.
Conflict-of-interest disclosure: S.J. receives research funding from Abcuro, Inc and SIRPant Immunotherapeutics; and honorarium for scientific advisory board participation from SIRPant Immunotherapeutics, Daiichi Sankyo, and Secura Bio and for consulting from Abcuro, Inc. The remaining authors declare no competing financial interests.
Correspondence: Salvia Jain, Jon and Jo Ann Hagler Center for Lymphoma, Massachusetts General Hospital Cancer Center, Harvard Medical School, 55 Fruit Street, Boston, MA 02114-2696; e-mail: salvia.jain@mgh.harvard.edu.

