

Key Points
We use IMC to demonstrate that among homogenous tumors such as DLBCL, there are pockets of tumor cells that escape immune penetration.
We identify TME features that correlate with chemo-resistance and mutational signatures and identify an immunological structure in DLBCL.

Abstract
Multiplexed immune cell profiling of the tumor microenvironment (TME) in cancer has improved our understanding of cancer immunology, but complex spatial analyses of tumor-immune interactions in lymphoma are lacking. Here, we used imaging mass cytometry (IMC) on 33 cases of diffuse large B-cell lymphoma (DLBCL) to characterize tumor and immune cell architecture and correlate it to clinicopathological features such as cell of origin, gene mutations, and responsiveness to chemotherapy. To understand the poor response of DLBCL to immune checkpoint inhibitors (ICI), we compared our results to IMC data from Hodgkin lymphoma, a cancer highly responsive to ICI, and observed differences in the expression of PD-L1, PD-1, and TIM-3. We created a spatial classification of tumor cells and identified tumor-centric subregions of immune activation, immune suppression, and immune exclusion within the topology of DLBCL. Finally, the spatial analysis allowed us to identify markers such as CXCR3, which are associated with penetration of immune cells into immune desert regions, with important implications for engineered cellular therapies. This is the first study to integrate tumor mutational profiling, cell of origin classification, and multiplexed immuno-phenotyping of the TME into a spatial analysis of DLBCL at the single-cell level. We demonstrate that, far from being histopathologically monotonous, DLBCL has a complex tumor architecture, and that changes in tumor topology can be correlated with clinically relevant features. This analysis identifies candidate biomarkers and therapeutic targets such as TIM-3, CCR4, and CXCR3 that are relevant for combination treatment strategies in immuno-oncology and cellular therapies.
Introduction
Diffuse large B-cell lymphoma (DLBCL) is the most common subtype of non-Hodgkin lymphoma. Although many patients are cured with standard chemo-immunotherapy, up to 40% of patients with DLBCL ultimately succumb to their disease.1 The composition of the tumor microenvironment (TME) has emerged as an important predictor of DLBCL outcome in gene expression profiling studies.2-5 Additional studies have highlighted the importance of individual populations of immune cells such as CD4 and CD8 T cell, macrophages, dendritic cells, and regular regulator T cells (TREG), but none of these studies have simultaneously profiled the TME in a comprehensive manner.4,6 ,, -11 Recent methodological advances now allow highly multiplexed single-cell immunophenotypic characterization of TME in cancer, but studies focused on DLBCL have not been reported.12-15
Early attempts to subclassify DLBCL relied on gene expression or immunohistochemistry, and these approaches identified 2 major subgroups with prognostic significance: a favorable germinal center B-cell (GCB) type and an unfavorable activated B-cell, or non-GCB, type.16,17 More recent attempts using DNA mutations, structural variants, and/or gene expression in combination have revealed 5 or 6 subtypes.18,19 However, integration of mutational analysis with functional and spatial parameters derived from DLBCL TME analyses has not yet been reported.
Programmed cell death receptor 1 ligand (PD-L1) is a member of the B7 family that is expressed on tumor cells and is a predictor of poor survival in multiple epithelial and hematologic malignancies, including DLBCL.20-23 Blockade of PD-1/PD-L1 signaling with monoclonal antibodies such as nivolumab and pembrolizumab in patients with relapsed/refractory Hodgkin lymphoma has resulted in high and durable clinical response rates.24-26 Unlike in Hodgkin lymphoma, the response rate to PD-1/PD-L1 blockade in relapsed/refractory DLBCL has been disappointingly low (≤10%), even though PD-L1 is expressed in a significant subset of DLBCL and is associated with poor prognosis.27 The reasons for this discrepancy between PD-L1 expression and the failure of PD-1/PD-L1 pathway inhibition in relapsed/refractory DLBCL represent a major knowledge gap in the field.
In this study, we characterize the TME in 33 cases of DLBCL, including the cell types, frequency, functional state, and spatial topology using imaging mass cytometry (IMC).28 We perform spatial analysis of the DLBCL tumor architecture to reveal immunologic subregions of tumor immune interaction at single-cell resolution. Finally, using our previous study of Hodgkin lymphoma, we identify key differences between the Hodgkin lymphoma and DLBCL TME components that might explain their differential responses to immune checkpoint inhibitor (ICI) therapy.29
Methods
Image analysis pipeline
Image segmentation
Segmentation was performed using probability maps from cropped images and pixel classification trained on selected channels corresponding to background/nuclei/cytoplasm.32-34
Statistical analysis
Phenotype classification used hyperbolic arc-sine transformation and Min/Max scaling relative to the 99th percentile.14,35 Phenotype expression for annotations used mixed-effects linear model and Z-scale standardization with Benjamini-Hochberg (BH) test corrections (α-level 0.05).
Analysis workflow
Image quality control used histoCAT.36 Spatial interaction parameters were n = 1000, α-level = 0.01, r = 15 µm (https://github.com/BodenmillerGroup/neighbouRhood). Neighborhoods of at least 4% were compared between groups via analysis of variance (ANOVA; BH q < 0.05).
Phenotype identification
Phenotype components/states applied meta-clustering over lineage, inducible and morphological features (k1 = 45, k2 = 15).
TMA/replicate batch analysis
Kullback-Leibler divergence scores were computed for replicate regions of interest (ROIs) using TME proportions across tissue microarray (TMA). Phenotype association between treatment refractory, IPI, and double expressor profile
One multivariate linear model was fit using model parameters including treatment refractory, each Chapuy coordinate signature (C1-C5), high IPI (≥ 3), sex, double expressor, and replicates corresponding to each participant. Top features were identified using BH p adjustment.37
BCL2 and MYC protein were measured by immune-histochemistry. BCL2 overexpression was measured using a 40% cutoff judged by IHC, and MYC overexpression was determined as 70% threshold. Patients classified as double expressors were identified as BCL2 above the 40% and MYC above the 70% threshold.
Phenotype association with mutation signatures (C1-C5)
The molecular variants of a limited gene panel (Cancer Genetics Inc.) were obtained in 22 subjects and used in concordance with the list recently reported.19 The overlapping mutations allowed for the reconstruction of each signature (ie, 9/14 top-ranked mutations in our panel overlapped with C1, 1/1 per C2, 9/10 per C3, 15/24 per C4, and 6/10 per C5). Statistical testing using the described linear model design identified significant differences of cluster abundance and expression (BH q < 0.05).
Cross-cohort analysis
The integration analysis between cohorts Z-standardized each ROI and adjusted for the batch effect. The Pearson χ2 test was used to assess homogeneity of expression by randomly sampling (n = 100 iterations)38 and cross-validated using 2-way ANOVA. Rigorous statistical testing of phenotypic enrichments used β regression models for case proportions and enriched spatial neighborhoods (P < .01) were compared using ANOVA (BH q < 0.05).
Spatial classification
The tumor-centric neighborhood used 5-NN (centroid) average distances that were meta-clustered (k1 = 45, k2 = 15).39 The spatial modeling of the tumor topologies included all cases except case 20 because this case had approximately 97% immune cells and less than 5% tumor cells. Spatial regularity testing applied the Clark-Evans aggregation index and the comparisons used Student t-test (Tukey test α-level 0.05). Tumor-centric topological classes required 10% prevalent across cohort. The genetic signature association with topological proportions used logistic regression.
Results
IMC analysis of DLBCL TME identifies heterogeneity of immune infiltration and cellular subtypes
To comprehensively quantify the cellular and spatial heterogeneity in DLBCL, we designed an IMC panel to broadly cover T cells, B cells, macrophages, and structural markers as well as markers for immune activation and/or exhaustion (supplemental Table 1). We performed IMC on 41 representative tumor samples from 33 cases that were selected from a previously described cohort based on adequacy of residual tissue for analysis (supplemental Figure 1).40 IMC-derived features were correlated with clinical features such as cell-of-origin (COO) by IHC Hans criteria, presence of mutations, and responses to chemotherapy (Table 1; supplemental Figure 1; supplemental Figure 2). In the cohort, 22 (67%) of the patients achieved a sustained complete response to rituximab-based chemoimmunotherapy, whereas 7 (21%) were primary refractory (REF) or relapsed within 1 year. Four patients did not receive chemotherapy and were excluded from response to therapy analysis.
Clinicopathological characteristics of the cohort
| Parameters | n (%) |
|---|---|
| Age, mean ± SD (range) | 49 ± 15 (20-82) |
| Sex | |
| F | 9 (27) |
| M | 24 (73) |
| Ethnicity | |
| Black | 1 (3) |
| Asian | 5 (15) |
| Caucasian | 2 (6) |
| Hispanic | 25 (76) |
| LDH | |
| Not elevated | 16 (49) |
| Elevated | 17 (51) |
| IPI score | |
| 0-2 | 23 (70) |
| 3-5 | 10 (30) |
| EBER | |
| Positive | 6 (18) |
| Negative | 27 (82) |
| Hans COO | |
| GCB | 17 (51) |
| Non-GCB | 16 (49) |
| Mutation status | 22 (67) |
| TP53 | 8 (24) |
| BCL2 | 3 (9) |
| BCL6 | 2 (6) |
| CD79b | 6 (18) |
| SGK1 | 1 (3) |
| MYD88.L265P | 2 (6) |
| NOTCH1 | 3 (9) |
| NOTCH2 | 3 (9) |
| EZH2 | 4 (12) |
| 9p24 chromosomal gain | 8 (24) |
| Stage | |
| I/II | 15 (45) |
| III/IV | 18 (55) |
| Response status | |
| CR | 22 (67) |
| Non-CR | 7 (21) |
| Unknown | 4 (12) |
| Treatment | |
| Chemo-immunotherapy | 29 (88) |
| Not done/LTF | 4 (12) |
Double-hit tumors were excluded from this data set.
COO, cell of origin; CR, complete response; EBER, Epstein-Barr virus-encoded small RNAs; GCB: germinal center B cell; LDH, lactate dehydrogenase serum levels; LTF, lost to follow-up; non-GCB, non-germinal center B cell; REF, refractory to treatment.
IMC produces images similar to immunohistochemistry or immunofluorescence with the added advantage of increased multiplex staining. The images were segmented using pixel classification training into single cells yielding on average 16,889 (SD = 4,393) cells per ROI, as previously described (supplemental Figure 3).32,34,36 Cellular expression of cell lineage, inducible states, and spatial features were hierarchically clustered with Phenograph to identify major phenotype clusters such as endothelial, TREG, CD8 T cells, CD4 T cells, macrophages, and B-cell tumors (Figure 1A).

IMC analysis of DLBCL TME identifies heterogeneity of immune infiltration and cellular subtypes. (A) The complete single-cell network uniform manifold approximation and projection (UMAP) depicts the manifold approximation for each cell and shows the lineage marker intensity correspondence to each manifold. UMAP (left) depicts the identified tumor, CD4, CD8, TREG, macrophage, and endothelial components generated by PhenoGraph clustering. Each PhenoGraph subpopulation is denoted with a color organized by TME compartments related to the primary lineage marker. The adjacent UMAP (right) depicts the primary lineage marker (min/max) intensity of each major phenotype. The corresponding heatmap depicts the min/max normalized expression intensity summarized by major cell components. (B) Of the 39.5% of cells composing the TME, the composition was dominated by CD4, CD8, and macrophages, which make up 92.3% of the immune microenvironment. In a multivariate beta model adjusted for each Chapuy signature class, cell-of-origin, and high IPI (≥ 3), CD4 T cell-relative TME proportion was 2.88 (95% CI, 1.26-6.57; P = .012) times increased among cases in C4 coordinate signature compared with cases not in C4. CD8 T-cell TME proportion was 1.96 (95% CI, 1.11-3.48; P = .02) times increased among C2 cases compared with other signatures, whereas TREG TME proportions were 0.40 (95% CI, 0.19-0.86; P = .019) times that of those not in C2. These data suggest, holding other terms as constant, that there is heterogeneity of TME abundances associated with molecular signatures. (C) Left: Initial pathologist review revealed various degrees of immune infiltrate in DLBCL. Pseudo-colored images representative of cases with low (top), medium (middle), and high (bottom) degree of immune infiltrate. Right: Cases ranked in order of absolute proportion of immune cells (9.42%-90.14%). See Supplemental Figure 7 for all cases. (D) Analysis of the TME composition showed marked heterogeneity in the distribution of CD4, CD8, TREG, and macrophages across cases, such that the proportion of CD4 increases with the increasing proportion of immune infiltrate, but the proportion of macrophages decreases with the increasing proportion of immune infiltrate. (E) Negative correlation between the proportion of CD4 T cells and that of macrophages. The x-axis denotes CD4 T-helper case proportions and the y-axis denotes the macrophage case proportions.
IMC analysis of DLBCL TME identifies heterogeneity of immune infiltration and cellular subtypes. (A) The complete single-cell network uniform manifold approximation and projection (UMAP) depicts the manifold approximation for each cell and shows the lineage marker intensity correspondence to each manifold. UMAP (left) depicts the identified tumor, CD4, CD8, TREG, macrophage, and endothelial components generated by PhenoGraph clustering. Each PhenoGraph subpopulation is denoted with a color organized by TME compartments related to the primary lineage marker. The adjacent UMAP (right) depicts the primary lineage marker (min/max) intensity of each major phenotype. The corresponding heatmap depicts the min/max normalized expression intensity summarized by major cell components. (B) Of the 39.5% of cells composing the TME, the composition was dominated by CD4, CD8, and macrophages, which make up 92.3% of the immune microenvironment. In a multivariate beta model adjusted for each Chapuy signature class, cell-of-origin, and high IPI (≥ 3), CD4 T cell-relative TME proportion was 2.88 (95% CI, 1.26-6.57; P = .012) times increased among cases in C4 coordinate signature compared with cases not in C4. CD8 T-cell TME proportion was 1.96 (95% CI, 1.11-3.48; P = .02) times increased among C2 cases compared with other signatures, whereas TREG TME proportions were 0.40 (95% CI, 0.19-0.86; P = .019) times that of those not in C2. These data suggest, holding other terms as constant, that there is heterogeneity of TME abundances associated with molecular signatures. (C) Left: Initial pathologist review revealed various degrees of immune infiltrate in DLBCL. Pseudo-colored images representative of cases with low (top), medium (middle), and high (bottom) degree of immune infiltrate. Right: Cases ranked in order of absolute proportion of immune cells (9.42%-90.14%). See Supplemental Figure 7 for all cases. (D) Analysis of the TME composition showed marked heterogeneity in the distribution of CD4, CD8, TREG, and macrophages across cases, such that the proportion of CD4 increases with the increasing proportion of immune infiltrate, but the proportion of macrophages decreases with the increasing proportion of immune infiltrate. (E) Negative correlation between the proportion of CD4 T cells and that of macrophages. The x-axis denotes CD4 T-helper case proportions and the y-axis denotes the macrophage case proportions.
Hierarchical meta-clustering across ROIs first identified 14 meta-clusters which were well distributed across cases and quality control analysis ensured that cluster annotations were appropriately defined (supplemental Figures 4-6). The major cell components across the 33 cases included 58.2% malignant B cells, 39.5% TME, and 2.32% endothelial cells (Figure 1B). Within the TME, we identified 7.70% TREG, 24.3% CD8 T cells, 28.8% macrophages, and 39.2% CD4 T cells. Similar to previous reports, macrophage proportions were 3.96% (P = .069) higher in non-GCB compared with GCB cases.41 In tumors with low immune infiltration (Figure 1C-D; supplemental Figure 7) macrophages were the predominant immune cell type, whereas in cases with greater immune infiltrate, CD4+ cells predominated. This resulted in a significant negative association between the macrophage and CD4+ cell proportions (Pearson R = -0.75, P < .001) across the 33 cases (Figure 1E) as was similarly reported for solid tumors.12
Association of molecular classification, chemo responsiveness, and spatial resolved cell phenotypes in the TME
We next performed subclassification of each major cell component by including inducible markers and morphological features, which identified the functional states of tumor and immune subphenotypes in the TME (Figure 2A). We then identified spatial interactions between the various subcluster pairs using a distance radius of 15 µm and an α-level of 0.01 to determine attraction/repulsions. We associated these TME subclusters and their spatial interactions with IPI, the 5 Chapuy genetic subtypes (C1-C5), double expressor phenotype, and response to chemotherapy to gain insights into the biological significance of the observed tumor and immune heterogeneity.
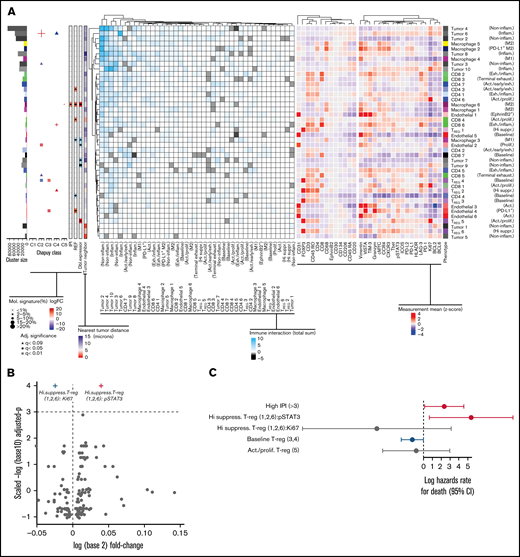
Association between genetic mutations, cell of origin, and abundance of subcellular phenotypes in DLBCL TME. (A) Subphenotypes were created and labeled by reclustering cells using all markers. (Left) heatmap depicts the significant spatial colocalizations are depicted on the using an interaction distance of 15 microns and a permutation test (1000; P < .01) comparing significant spatial colocalizations (cyan), or significant avoidance (black) for each pairwise subpopulation as a total sum of signed interaction scores. (Right) Heatmap depicts the heterogeneity state/inducible marker expression (Z-score). The left-most adjacent graphs include cluster size correspondence, differential abundance association with molecular subtypes (C1-C5), IPI, treatment refractory, and double expressor status (|logFC|<10), and the average nearest neighbor distance to tumor per cluster is included (<15 microns). Statistically significant differences of cluster abundances/states were denoted following adjusted significance legend including shapes such as a triangle denoting BH q < 0.09, a cross shape denoting BH q < 0.05, and a box/cross denoting BH q < 0.01. For hypothesis testing cluster abundances related to Chapuy signatures, the size of a given significance shape represents abundance of a given phenotypic cluster relative to the abundance among other Chapuy signatures (%). Baseline TREG ( cluster 4) (logFC=17.4, BH q = 3.2e-03) abundance was significantly enriched in C3 coordinate signature, with negative association in C2 (logFC= −20.4, BH q = 1.9e-04). PD-L1+ endothelial cell (4) abundance were positively associated with C3 (logFC = 23.4, BH q = 3.2e-03) and REF subjects (logFC = 10.9, BH q = 0.033). Proliferative endothelial cells (2) had increased abundance in C2 (logFC = 20.9, BH q = 5.1e-03) and inflammatory tumor (6) (logFC = 22.7, BH q = 0.024). Exhausted/inflammatory CD8 (6) had increased abundance (logFC = 29.4, BH q = 0.024). The expression intensity for each sample was standardized into a Z-scores, and the subsequent phenotype cluster expression profiles are depicted. (B) The volcano representation of the multivariate linear model identified pSTAT3 as statistically significantly overexpressed on highly suppressive TREG comparing refractory to responders (BH q = 0.0295), similarly Ki67 on the same phenotype was underexpressed (BH q = 0.0295). The shapes of these 2 markers correspond to the adjusted significance legend (BH q < 0.05) used in cluster abundance hypothesis testing. (C) The multivariate Cox proportional hazards model indicates the x-axis as the log hazards estimate, and the y-axis are the Treg family included in the model (95% CI). For each patient, the relative case proportions for a given phenotype, and the average pSTAT3/Ki67 expression (Z-score) corresponding to the given phenotype, were fit into the Cox hazards model using these patient level features.
Association between genetic mutations, cell of origin, and abundance of subcellular phenotypes in DLBCL TME. (A) Subphenotypes were created and labeled by reclustering cells using all markers. (Left) heatmap depicts the significant spatial colocalizations are depicted on the using an interaction distance of 15 microns and a permutation test (1000; P < .01) comparing significant spatial colocalizations (cyan), or significant avoidance (black) for each pairwise subpopulation as a total sum of signed interaction scores. (Right) Heatmap depicts the heterogeneity state/inducible marker expression (Z-score). The left-most adjacent graphs include cluster size correspondence, differential abundance association with molecular subtypes (C1-C5), IPI, treatment refractory, and double expressor status (|logFC|<10), and the average nearest neighbor distance to tumor per cluster is included (<15 microns). Statistically significant differences of cluster abundances/states were denoted following adjusted significance legend including shapes such as a triangle denoting BH q < 0.09, a cross shape denoting BH q < 0.05, and a box/cross denoting BH q < 0.01. For hypothesis testing cluster abundances related to Chapuy signatures, the size of a given significance shape represents abundance of a given phenotypic cluster relative to the abundance among other Chapuy signatures (%). Baseline TREG ( cluster 4) (logFC=17.4, BH q = 3.2e-03) abundance was significantly enriched in C3 coordinate signature, with negative association in C2 (logFC= −20.4, BH q = 1.9e-04). PD-L1+ endothelial cell (4) abundance were positively associated with C3 (logFC = 23.4, BH q = 3.2e-03) and REF subjects (logFC = 10.9, BH q = 0.033). Proliferative endothelial cells (2) had increased abundance in C2 (logFC = 20.9, BH q = 5.1e-03) and inflammatory tumor (6) (logFC = 22.7, BH q = 0.024). Exhausted/inflammatory CD8 (6) had increased abundance (logFC = 29.4, BH q = 0.024). The expression intensity for each sample was standardized into a Z-scores, and the subsequent phenotype cluster expression profiles are depicted. (B) The volcano representation of the multivariate linear model identified pSTAT3 as statistically significantly overexpressed on highly suppressive TREG comparing refractory to responders (BH q = 0.0295), similarly Ki67 on the same phenotype was underexpressed (BH q = 0.0295). The shapes of these 2 markers correspond to the adjusted significance legend (BH q < 0.05) used in cluster abundance hypothesis testing. (C) The multivariate Cox proportional hazards model indicates the x-axis as the log hazards estimate, and the y-axis are the Treg family included in the model (95% CI). For each patient, the relative case proportions for a given phenotype, and the average pSTAT3/Ki67 expression (Z-score) corresponding to the given phenotype, were fit into the Cox hazards model using these patient level features.
To aid in interpretation, we grouped subclusters with similar marker expression patterns and assigned putative functional labels to these groups. We pooled subclusters into functional groups based on phenotypic similarity observed in hierarchical clustering and expert review (supplemental Figure 8A; supplemental Methods).
Having grouped TME elements into functional groups, we then looked for associations and spatial interactions that corresponded with Chapuy molecular subgroups C1-C5, and clinical features such as IPI and refractory disease (Figure 2A). For example, baseline TREG (4) abundance had significant positive association with C3 (BH adjusted P < .01), negative association with C2 (BH q < 0.01), and had significant spatial attraction with inflammatory and noninflammatory tumors (tumor clusters 3, 4, 10; P < .01). PD-L1+endothelial cells (endothelial cluster 4) had significant positive association with C3 (BH q < 0.01), REF (BH q < 0.05), and formed spatial neighborhoods with inflammatory tumor (tumor cluster 10; P < .01) while avoiding noninflammatory tumors (3; P < .01).
Proliferative endothelial cells (2) had significantly positive association with C2 (BH q < 0.01) and negative association with double expressor phenotype (BH q < 0.05) with overall spatial attractions to noninflammatory tumors (tumor cluster 2,4; P < .01). Inflammatory tumor cluster 6 had a positive association with C2 (BH q < 0.05) and predominantly homotypic spatial attractions with inflammatory tumors (tumor cluster 6; P < .01), and noninflammatory tumor (2,4; P < .01), followed by PD-L1+M2 MAC (MAC cluster 2; P < .01).
Among those in C2, the proportions of CD8 T cells were 1.96 (95% confidence interval [CI], 1.11-3.48; P = .02) times increased comparing participants in other mutational signatures, whereas exhausted/inflammatory CD8 subtypes (cluster 6) had a significantly positive association with C4 (BH q < 0.05) with spatial colocalization with noninflammatory (clusters 2,3; P < .01) and inflammatory tumors (6; P < .01). Generally, participants with C4 genetic signature had CD4 T-cell TME proportions increased 2.88 (95% CI, 1.26-6.57; P = .012) times that among those in other Chapuy signatures but did not identify any specific CD4 subtype associated the molecular signatures.
To understand the clinical significance of these clusters, we looked for associations between markers and response to chemotherapy. M2-MAC (6) had a significantly positive association with REF (BH q < 0.05), whereas M1-MAC (3) had a significantly negative association with REF (BH q < 0.05). We failed to observe statistically significant linear association between macrophage abundances and Chapuy molecular groups.
Refractory participants showed significantly increased PD-L1, PD-L2, ICOS, VISTA, and pSTAT3 compared with responder participants (t test P < .05; supplemental Figure 8B). Additionally, highly suppressive TREG phenotype showed significantly increased pSTAT3 intensity (BH q < 0.03) in refractory subjects but decreased Ki67 (BH q < .03) compared with responders (Figure 2B). Participants with increasing pSTAT3 expression on highly suppressive TREG observed significantly shorter time to the event of death (log hazards rate 5.38 [95% CI, 0.65-10.10]; P = .026), whereas an increase of Ki67 intensity on highly suppressive TREG showed a protective trend (Figure 2C).
Spatial analyses reveal differences in tumor topology between GCB and non-GCB
We next quantified the level of spatial clustering across each case, using the Clark-Evans aggregation index, a measure of spatial organization.42,43 Here, we used the standardized Clark-Evans index to compare the B cells in reactive lymph nodes (RLN) to the malignant B cells by Chapuy molecular clusters or cell of origin by Hans criteria (Figure 3). Compared with the highly organized B cells in a reactive lymph node, none of the 5 Chapuy molecular clusters showed a significant difference in spatial organization, although coordinate signatures in C1 had increased spatial regularity (Tukey P = .06) and in C2 had increased spatial irregularity (Tukey P = .06). When compared with GC and non-GC defined by Hans criteria, we observed that non-GC tumors demonstrated less spatial organization when comparted to GC (Tukey P = .058), and significantly less compared with RLN (Tukey P = .03) (Figure 3).
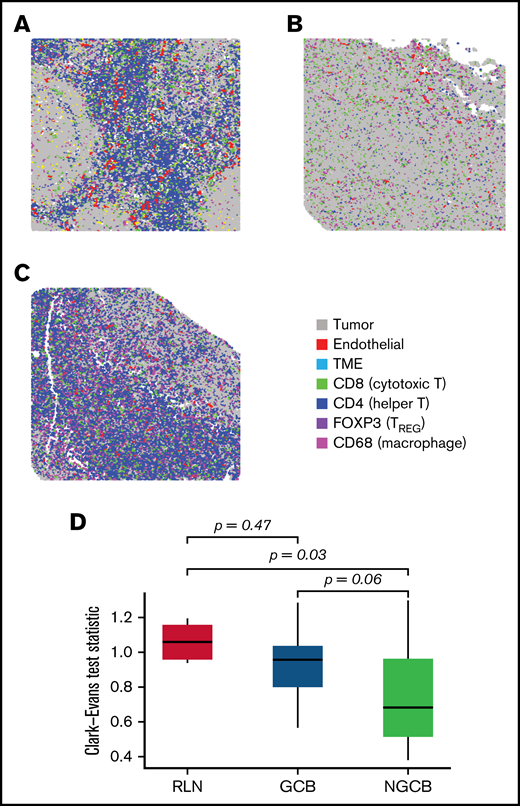
Spatial clustering reveals differences in tumor topology that associate with COO and TME abundance. (A-C) The spatial distribution corresponding to B cells were examined in reactive lymph nodes, and in NGCB/GCB tumor environments (A, B, and C, respectively). By visual examination, heterogeneous spatial arrangements of tumor differed by COO classification (GCB/NGCB). The Clark-Evans aggregation index quantifies the level of spatial regularity (index > 1), or clustering (index < 1), and was applied to the B-cell topology classes in reactive lymph node (RLN) and DLBCL (GCB and NGCB). (D) The Clark-Evans index was standardized and compared against the RLN. This indicated the B-cell topology classes in non-GCB cases were significantly more irregularly clustered compared with RLN (Tukey P = .03), whereas GCB had spatial regularity similar to RLN (Tukey P = .47). There was marginal difference comparing GCB with NGCB (Tukey P = .058). This indicates that the spatial distribution of the malignant B cells in GCB tumors more closely resembles the B-cell architecture of normal follicles, whereas malignant B cells in non-GCB tumors were more dispersed. A further multivariate linear model identified that NGCB tumors were significantly more clustered compared with GCB cases after adjusting for each Chapuy molecular signature (C1-C5), and IPI (P = .034, estimate = −0.1974; 95% CI, -0.374 to -0.012). Representative ROIs of highest spatially organized RLN (left, Clark-Evans Index = 1.16), most organized GCB case (middle, Clark-Evans Index = 1.29), and least spatially organized in NGCB (right, Clark-Evans Index = 0.54).
Spatial clustering reveals differences in tumor topology that associate with COO and TME abundance. (A-C) The spatial distribution corresponding to B cells were examined in reactive lymph nodes, and in NGCB/GCB tumor environments (A, B, and C, respectively). By visual examination, heterogeneous spatial arrangements of tumor differed by COO classification (GCB/NGCB). The Clark-Evans aggregation index quantifies the level of spatial regularity (index > 1), or clustering (index < 1), and was applied to the B-cell topology classes in reactive lymph node (RLN) and DLBCL (GCB and NGCB). (D) The Clark-Evans index was standardized and compared against the RLN. This indicated the B-cell topology classes in non-GCB cases were significantly more irregularly clustered compared with RLN (Tukey P = .03), whereas GCB had spatial regularity similar to RLN (Tukey P = .47). There was marginal difference comparing GCB with NGCB (Tukey P = .058). This indicates that the spatial distribution of the malignant B cells in GCB tumors more closely resembles the B-cell architecture of normal follicles, whereas malignant B cells in non-GCB tumors were more dispersed. A further multivariate linear model identified that NGCB tumors were significantly more clustered compared with GCB cases after adjusting for each Chapuy molecular signature (C1-C5), and IPI (P = .034, estimate = −0.1974; 95% CI, -0.374 to -0.012). Representative ROIs of highest spatially organized RLN (left, Clark-Evans Index = 1.16), most organized GCB case (middle, Clark-Evans Index = 1.29), and least spatially organized in NGCB (right, Clark-Evans Index = 0.54).
Tumor topology
Having observed spatial heterogeneity among tumor cells, we aimed to further establish distinct tumor-centric areas to investigate the spatial relationship with immune phenotypes. To better quantify the single-cell topology of DLBCL, we developed an algorithm for tumor cell-TME distance classification that subclusters a population based on distances to neighboring cell types (Figure 4A). We tested it using synthetic images and B cells in normal lymph nodes (supplemental Figures 9 and 10) and then applied it to the tumor cells in DLBCL. Using this approach, we identified 9 spatial clusters, or tumor neighborhoods, based on tumor distance to the TME (Figure 4B). The rarest topology was class “a”, or “tumor_a” (0.93% prevalent), whereas tumor_f (21.1%), tumor_d (15.3%), and tumor_c (15.2%) were the most common (Figure 4C-D). From visual inspection, it was clear that some tumor cells were dispersed among immune cells such as tumor_b and tumor_e (Figure 4C, inset 1), whereas other tumor cells formed tight layered clusters such as tumor_d, tumor_f, and tumor_i (Figure 4C, inset 2).
![Spatial clustering reveals differences in tumor topology that associate with COO and TME abundance. (A) Neighborhood analysis of cells describes the local arrangement of the TME within the tumor area. The metric is calculated for each cell by locating the 5 nearest cells belonging to the immune TME, locating the centroid of those nearest neighbors, and measuring the distance from the centroid to the original cell. A smaller distance metric indicates that a cell is embedded within the immune TME; a longer distance denotes exclusion of tumor cells from immune cells. (B) The tumor neighborhoods were constructed relative to their distance to the TME, which can identify themes of immune activity or nonactivity within distinct tumor-centric regions. The histogram showing the ordered average distance from each tumor topology class to its nearest immune cells. Tumor topology classes were ordered by their distance/proximity to the TME (microns). Tumor_d (average centroid distance to immune [dist] = 47.9 µm) was defined as the “core” based on its furthest distance to immune cells. Tumor_f (dist = 30.9 µm), followed by tumor_i (dist = 24.1 µ) were next nearest clusters to immune cells and were labeled as the “mantle.” Tumor_c (dist = 18.9 µm) and tumor_h (dist = 18.9 µm) represented the boundary to the immune interface and subsequently labeled as “crust” because they were adjacent to both the TME and the mantle regions. Tumor_g (dist = 13.8 µm), tumor_e (dist = 13.7 µm), tumor_a (dist = 13.2 µm), and tumor_b (dist = 12.2 µm) had the shortest distance to nearest to TME but formed unorganized clusters and were labeled as “dispersed.” The x-axis denotes the topology cluster, and the y-axis denotes the average centroid distance to the TME (microns). (C) Intratumor spatial heterogeneity is depicted in a representative annotated image from case 26. The first inset shows tumor classes that are more intermixed with the immune cells. The second inset shows tumor spatial arrangement structures similar to the geological topography, with tumor_d situated at the “core,” tumor_f at the inner “mantle,” tumor_i at the outer “mantle,” and tumor_c at the “crust” of tumor clusters. (D) Nine classes of tumor topology were identified and were well distributed across cases, ordered from immune-cold to immune-hot. The y-axis denotes case proportion (%), and x-axis denote the cases. All cases were included that had less than 79% immune cell sample proportion present; case 20 was excluded in this analysis because it had approximately 97.5% immune cells with very sparse tumor cells present indicating that this topological model describes cases with at most 79% TME proportion. (E) Within the tumor-centric zones, the total significant attractions/repulsions (P < .01) of each major cell component (CD4/CD8/MAC/TREG) were summed in each tumor topology. The x-axis denotes the topological regions ordered by distance to the TME from closest (tumor_b) to furthest (tumor_d). The y-axis denotes the total sum of the significant signed interactions (P < .01). Positive values indicate attraction, whereas negative values indicate significant repulsions. The CD4 were enriched within tumor core and dispersed regions but depleted in the mantle neighborhoods, whereas CD8 were depleted in the core and mantle regions but enriched in the crust and dispersed regions. Macrophages were found in the dispersed and crust regions but decreased in the mantle and core areas. The total signed interactions of each TME compartment significantly differed across tumor topologies (ANOVA P = 1.14e-02, F = 1.71, DF = 32) indicated significant heterogeneity of TME interaction across each topological zone. The line graph summarizes the trends of the observed spatial estimates depicted, with 95% CIs in Supplemental Figure 11A,F. Within each tumor-centric neighborhood, the total case proportion per subphenotype with significant neighborhood interaction (radius of interaction = 15 micron, P < .01) was computed. The x-axis denotes interactions for each tumor topology such that “a”/“b”/“e”/“g” were summarized into as “dispersed” topology, the “c”/“h”/“I”/“f” were summarized into as “mantle/crust” topology, and tumor “d” as the “core.” The y-axis denotes the case proportion of statistically significant interactions from the tumor topology (reference) to the TME phenotype (P < .01) and corresponding 95% CI. Supplemental Figure 11B depicts the TREG subtypes. There was a statistically significant association between the total CD4/CD8/macrophage/TREG spatial interactions per the mantle/core and crust/dispersed regions (P = .019, χ2 = 9.3, df = 3). CD8 T cells and macrophages were 0.33 (95% CI, 0.15-0.61; P = .001) and 0.44 (95% CI, 0.19-0.91; P = .037) times as likely to form neighborhoods in the core/mantle compared with the crust/dispersed regions. (G) The tumor core had the fewest significant interactions with the immune phenotypes (radius of interaction = 15 microns). Averaging the number of significant attractions between the CD4 family level phenotypes and the tumor core (P < .01), there is a significant association with corresponding CD4 phenotype average CXCR3 (Z-score) expression level (P = .00198, adjusted R2 = 0.9941, CXR3 estimate = 2.94; 95% CI, 2.37-3.50). The x-axis denotes the average CXCR3 (Z-score) expression corresponding to CD4 family phenotypes. The y-axis denotes the average number of significant interactions between the CD4 family and the tumor core (P < .01). Both the reference CD4 interaction with the tumor core, and the reference tumor core interaction with the CD4 phenotype directions of spatial interactions were averaged.](https://ash.silverchair-cdn.com/ash/content_public/journal/bloodadvances/6/16/10.1182_bloodadvances.2022007493/4/m_advancesadv2022007493f4a.png?Expires=1769817822&Signature=YyCOmEG8IqhW~mGrf8xlcztvUxNtCRDLYfRE45~V1inNEw981X3nxN-kDd8sB2AI75TUr-9CCJI4vZZVz9JsC9pyWzQXsq3hzi8W6~AdJWYM5Fw0RnQcSjVvk4cmFwxjgrYtzpOoD8zDDYb5hhkRT41GNa0ND6Na939cIdd0aytPjP56kQ2kK2a1K3y91ZdqDOCNzs1gwQWQisptK3k4GF3bY-Jtp-6k86GPPS9cXDcK9KGNh6R9W1YtKMDoAME8UFxCcPHVofqD1-TBGYK4pcUK26JnOr~ZNVgtwimCzClWo3SidjcmLFLoEdgcp1tawwO-FhAKFsxVU25QWq0Wwg__&Key-Pair-Id=APKAIE5G5CRDK6RD3PGA)
![Spatial clustering reveals differences in tumor topology that associate with COO and TME abundance. (A) Neighborhood analysis of cells describes the local arrangement of the TME within the tumor area. The metric is calculated for each cell by locating the 5 nearest cells belonging to the immune TME, locating the centroid of those nearest neighbors, and measuring the distance from the centroid to the original cell. A smaller distance metric indicates that a cell is embedded within the immune TME; a longer distance denotes exclusion of tumor cells from immune cells. (B) The tumor neighborhoods were constructed relative to their distance to the TME, which can identify themes of immune activity or nonactivity within distinct tumor-centric regions. The histogram showing the ordered average distance from each tumor topology class to its nearest immune cells. Tumor topology classes were ordered by their distance/proximity to the TME (microns). Tumor_d (average centroid distance to immune [dist] = 47.9 µm) was defined as the “core” based on its furthest distance to immune cells. Tumor_f (dist = 30.9 µm), followed by tumor_i (dist = 24.1 µ) were next nearest clusters to immune cells and were labeled as the “mantle.” Tumor_c (dist = 18.9 µm) and tumor_h (dist = 18.9 µm) represented the boundary to the immune interface and subsequently labeled as “crust” because they were adjacent to both the TME and the mantle regions. Tumor_g (dist = 13.8 µm), tumor_e (dist = 13.7 µm), tumor_a (dist = 13.2 µm), and tumor_b (dist = 12.2 µm) had the shortest distance to nearest to TME but formed unorganized clusters and were labeled as “dispersed.” The x-axis denotes the topology cluster, and the y-axis denotes the average centroid distance to the TME (microns). (C) Intratumor spatial heterogeneity is depicted in a representative annotated image from case 26. The first inset shows tumor classes that are more intermixed with the immune cells. The second inset shows tumor spatial arrangement structures similar to the geological topography, with tumor_d situated at the “core,” tumor_f at the inner “mantle,” tumor_i at the outer “mantle,” and tumor_c at the “crust” of tumor clusters. (D) Nine classes of tumor topology were identified and were well distributed across cases, ordered from immune-cold to immune-hot. The y-axis denotes case proportion (%), and x-axis denote the cases. All cases were included that had less than 79% immune cell sample proportion present; case 20 was excluded in this analysis because it had approximately 97.5% immune cells with very sparse tumor cells present indicating that this topological model describes cases with at most 79% TME proportion. (E) Within the tumor-centric zones, the total significant attractions/repulsions (P < .01) of each major cell component (CD4/CD8/MAC/TREG) were summed in each tumor topology. The x-axis denotes the topological regions ordered by distance to the TME from closest (tumor_b) to furthest (tumor_d). The y-axis denotes the total sum of the significant signed interactions (P < .01). Positive values indicate attraction, whereas negative values indicate significant repulsions. The CD4 were enriched within tumor core and dispersed regions but depleted in the mantle neighborhoods, whereas CD8 were depleted in the core and mantle regions but enriched in the crust and dispersed regions. Macrophages were found in the dispersed and crust regions but decreased in the mantle and core areas. The total signed interactions of each TME compartment significantly differed across tumor topologies (ANOVA P = 1.14e-02, F = 1.71, DF = 32) indicated significant heterogeneity of TME interaction across each topological zone. The line graph summarizes the trends of the observed spatial estimates depicted, with 95% CIs in Supplemental Figure 11A,F. Within each tumor-centric neighborhood, the total case proportion per subphenotype with significant neighborhood interaction (radius of interaction = 15 micron, P < .01) was computed. The x-axis denotes interactions for each tumor topology such that “a”/“b”/“e”/“g” were summarized into as “dispersed” topology, the “c”/“h”/“I”/“f” were summarized into as “mantle/crust” topology, and tumor “d” as the “core.” The y-axis denotes the case proportion of statistically significant interactions from the tumor topology (reference) to the TME phenotype (P < .01) and corresponding 95% CI. Supplemental Figure 11B depicts the TREG subtypes. There was a statistically significant association between the total CD4/CD8/macrophage/TREG spatial interactions per the mantle/core and crust/dispersed regions (P = .019, χ2 = 9.3, df = 3). CD8 T cells and macrophages were 0.33 (95% CI, 0.15-0.61; P = .001) and 0.44 (95% CI, 0.19-0.91; P = .037) times as likely to form neighborhoods in the core/mantle compared with the crust/dispersed regions. (G) The tumor core had the fewest significant interactions with the immune phenotypes (radius of interaction = 15 microns). Averaging the number of significant attractions between the CD4 family level phenotypes and the tumor core (P < .01), there is a significant association with corresponding CD4 phenotype average CXCR3 (Z-score) expression level (P = .00198, adjusted R2 = 0.9941, CXR3 estimate = 2.94; 95% CI, 2.37-3.50). The x-axis denotes the average CXCR3 (Z-score) expression corresponding to CD4 family phenotypes. The y-axis denotes the average number of significant interactions between the CD4 family and the tumor core (P < .01). Both the reference CD4 interaction with the tumor core, and the reference tumor core interaction with the CD4 phenotype directions of spatial interactions were averaged.](https://ash.silverchair-cdn.com/ash/content_public/journal/bloodadvances/6/16/10.1182_bloodadvances.2022007493/4/m_advancesadv2022007493f4b.png?Expires=1769817822&Signature=Yf3m-z~z6QIt9ttWUl~GijhmumXfrep9~xpxk7U~E3yWUPI17IUCGgWEsBeDDRuBmUwcXyGtmBXnFVa0KInBaPGQj921oDKslTtv1e~EMvAuq5OdhHJ96I7KDJV1Nmk59njQLe17B2P-vfe~J2TrVhD6MVhPKn5wq2UrRxf6ZJOagzp8yhKuK6FtCO64jllbPMYHDRom-X4LyghWpRq78cPFm1GboF9B0J54pYpnOaoQZT625aAubL4rftmW44xyjsBHkH3Ev~lJMhqGF1jnCiLl2ecO1Q87rTifaNy6fzZr2bAroL135IXHdJdT7n7PztkFnCrrswND2j9ES2qmpw__&Key-Pair-Id=APKAIE5G5CRDK6RD3PGA)
Spatial clustering reveals differences in tumor topology that associate with COO and TME abundance. (A) Neighborhood analysis of cells describes the local arrangement of the TME within the tumor area. The metric is calculated for each cell by locating the 5 nearest cells belonging to the immune TME, locating the centroid of those nearest neighbors, and measuring the distance from the centroid to the original cell. A smaller distance metric indicates that a cell is embedded within the immune TME; a longer distance denotes exclusion of tumor cells from immune cells. (B) The tumor neighborhoods were constructed relative to their distance to the TME, which can identify themes of immune activity or nonactivity within distinct tumor-centric regions. The histogram showing the ordered average distance from each tumor topology class to its nearest immune cells. Tumor topology classes were ordered by their distance/proximity to the TME (microns). Tumor_d (average centroid distance to immune [dist] = 47.9 µm) was defined as the “core” based on its furthest distance to immune cells. Tumor_f (dist = 30.9 µm), followed by tumor_i (dist = 24.1 µ) were next nearest clusters to immune cells and were labeled as the “mantle.” Tumor_c (dist = 18.9 µm) and tumor_h (dist = 18.9 µm) represented the boundary to the immune interface and subsequently labeled as “crust” because they were adjacent to both the TME and the mantle regions. Tumor_g (dist = 13.8 µm), tumor_e (dist = 13.7 µm), tumor_a (dist = 13.2 µm), and tumor_b (dist = 12.2 µm) had the shortest distance to nearest to TME but formed unorganized clusters and were labeled as “dispersed.” The x-axis denotes the topology cluster, and the y-axis denotes the average centroid distance to the TME (microns). (C) Intratumor spatial heterogeneity is depicted in a representative annotated image from case 26. The first inset shows tumor classes that are more intermixed with the immune cells. The second inset shows tumor spatial arrangement structures similar to the geological topography, with tumor_d situated at the “core,” tumor_f at the inner “mantle,” tumor_i at the outer “mantle,” and tumor_c at the “crust” of tumor clusters. (D) Nine classes of tumor topology were identified and were well distributed across cases, ordered from immune-cold to immune-hot. The y-axis denotes case proportion (%), and x-axis denote the cases. All cases were included that had less than 79% immune cell sample proportion present; case 20 was excluded in this analysis because it had approximately 97.5% immune cells with very sparse tumor cells present indicating that this topological model describes cases with at most 79% TME proportion. (E) Within the tumor-centric zones, the total significant attractions/repulsions (P < .01) of each major cell component (CD4/CD8/MAC/TREG) were summed in each tumor topology. The x-axis denotes the topological regions ordered by distance to the TME from closest (tumor_b) to furthest (tumor_d). The y-axis denotes the total sum of the significant signed interactions (P < .01). Positive values indicate attraction, whereas negative values indicate significant repulsions. The CD4 were enriched within tumor core and dispersed regions but depleted in the mantle neighborhoods, whereas CD8 were depleted in the core and mantle regions but enriched in the crust and dispersed regions. Macrophages were found in the dispersed and crust regions but decreased in the mantle and core areas. The total signed interactions of each TME compartment significantly differed across tumor topologies (ANOVA P = 1.14e-02, F = 1.71, DF = 32) indicated significant heterogeneity of TME interaction across each topological zone. The line graph summarizes the trends of the observed spatial estimates depicted, with 95% CIs in Supplemental Figure 11A,F. Within each tumor-centric neighborhood, the total case proportion per subphenotype with significant neighborhood interaction (radius of interaction = 15 micron, P < .01) was computed. The x-axis denotes interactions for each tumor topology such that “a”/“b”/“e”/“g” were summarized into as “dispersed” topology, the “c”/“h”/“I”/“f” were summarized into as “mantle/crust” topology, and tumor “d” as the “core.” The y-axis denotes the case proportion of statistically significant interactions from the tumor topology (reference) to the TME phenotype (P < .01) and corresponding 95% CI. Supplemental Figure 11B depicts the TREG subtypes. There was a statistically significant association between the total CD4/CD8/macrophage/TREG spatial interactions per the mantle/core and crust/dispersed regions (P = .019, χ2 = 9.3, df = 3). CD8 T cells and macrophages were 0.33 (95% CI, 0.15-0.61; P = .001) and 0.44 (95% CI, 0.19-0.91; P = .037) times as likely to form neighborhoods in the core/mantle compared with the crust/dispersed regions. (G) The tumor core had the fewest significant interactions with the immune phenotypes (radius of interaction = 15 microns). Averaging the number of significant attractions between the CD4 family level phenotypes and the tumor core (P < .01), there is a significant association with corresponding CD4 phenotype average CXCR3 (Z-score) expression level (P = .00198, adjusted R2 = 0.9941, CXR3 estimate = 2.94; 95% CI, 2.37-3.50). The x-axis denotes the average CXCR3 (Z-score) expression corresponding to CD4 family phenotypes. The y-axis denotes the average number of significant interactions between the CD4 family and the tumor core (P < .01). Both the reference CD4 interaction with the tumor core, and the reference tumor core interaction with the CD4 phenotype directions of spatial interactions were averaged.
Spatial clustering reveals differences in tumor topology that associate with COO and TME abundance. (A) Neighborhood analysis of cells describes the local arrangement of the TME within the tumor area. The metric is calculated for each cell by locating the 5 nearest cells belonging to the immune TME, locating the centroid of those nearest neighbors, and measuring the distance from the centroid to the original cell. A smaller distance metric indicates that a cell is embedded within the immune TME; a longer distance denotes exclusion of tumor cells from immune cells. (B) The tumor neighborhoods were constructed relative to their distance to the TME, which can identify themes of immune activity or nonactivity within distinct tumor-centric regions. The histogram showing the ordered average distance from each tumor topology class to its nearest immune cells. Tumor topology classes were ordered by their distance/proximity to the TME (microns). Tumor_d (average centroid distance to immune [dist] = 47.9 µm) was defined as the “core” based on its furthest distance to immune cells. Tumor_f (dist = 30.9 µm), followed by tumor_i (dist = 24.1 µ) were next nearest clusters to immune cells and were labeled as the “mantle.” Tumor_c (dist = 18.9 µm) and tumor_h (dist = 18.9 µm) represented the boundary to the immune interface and subsequently labeled as “crust” because they were adjacent to both the TME and the mantle regions. Tumor_g (dist = 13.8 µm), tumor_e (dist = 13.7 µm), tumor_a (dist = 13.2 µm), and tumor_b (dist = 12.2 µm) had the shortest distance to nearest to TME but formed unorganized clusters and were labeled as “dispersed.” The x-axis denotes the topology cluster, and the y-axis denotes the average centroid distance to the TME (microns). (C) Intratumor spatial heterogeneity is depicted in a representative annotated image from case 26. The first inset shows tumor classes that are more intermixed with the immune cells. The second inset shows tumor spatial arrangement structures similar to the geological topography, with tumor_d situated at the “core,” tumor_f at the inner “mantle,” tumor_i at the outer “mantle,” and tumor_c at the “crust” of tumor clusters. (D) Nine classes of tumor topology were identified and were well distributed across cases, ordered from immune-cold to immune-hot. The y-axis denotes case proportion (%), and x-axis denote the cases. All cases were included that had less than 79% immune cell sample proportion present; case 20 was excluded in this analysis because it had approximately 97.5% immune cells with very sparse tumor cells present indicating that this topological model describes cases with at most 79% TME proportion. (E) Within the tumor-centric zones, the total significant attractions/repulsions (P < .01) of each major cell component (CD4/CD8/MAC/TREG) were summed in each tumor topology. The x-axis denotes the topological regions ordered by distance to the TME from closest (tumor_b) to furthest (tumor_d). The y-axis denotes the total sum of the significant signed interactions (P < .01). Positive values indicate attraction, whereas negative values indicate significant repulsions. The CD4 were enriched within tumor core and dispersed regions but depleted in the mantle neighborhoods, whereas CD8 were depleted in the core and mantle regions but enriched in the crust and dispersed regions. Macrophages were found in the dispersed and crust regions but decreased in the mantle and core areas. The total signed interactions of each TME compartment significantly differed across tumor topologies (ANOVA P = 1.14e-02, F = 1.71, DF = 32) indicated significant heterogeneity of TME interaction across each topological zone. The line graph summarizes the trends of the observed spatial estimates depicted, with 95% CIs in Supplemental Figure 11A,F. Within each tumor-centric neighborhood, the total case proportion per subphenotype with significant neighborhood interaction (radius of interaction = 15 micron, P < .01) was computed. The x-axis denotes interactions for each tumor topology such that “a”/“b”/“e”/“g” were summarized into as “dispersed” topology, the “c”/“h”/“I”/“f” were summarized into as “mantle/crust” topology, and tumor “d” as the “core.” The y-axis denotes the case proportion of statistically significant interactions from the tumor topology (reference) to the TME phenotype (P < .01) and corresponding 95% CI. Supplemental Figure 11B depicts the TREG subtypes. There was a statistically significant association between the total CD4/CD8/macrophage/TREG spatial interactions per the mantle/core and crust/dispersed regions (P = .019, χ2 = 9.3, df = 3). CD8 T cells and macrophages were 0.33 (95% CI, 0.15-0.61; P = .001) and 0.44 (95% CI, 0.19-0.91; P = .037) times as likely to form neighborhoods in the core/mantle compared with the crust/dispersed regions. (G) The tumor core had the fewest significant interactions with the immune phenotypes (radius of interaction = 15 microns). Averaging the number of significant attractions between the CD4 family level phenotypes and the tumor core (P < .01), there is a significant association with corresponding CD4 phenotype average CXCR3 (Z-score) expression level (P = .00198, adjusted R2 = 0.9941, CXR3 estimate = 2.94; 95% CI, 2.37-3.50). The x-axis denotes the average CXCR3 (Z-score) expression corresponding to CD4 family phenotypes. The y-axis denotes the average number of significant interactions between the CD4 family and the tumor core (P < .01). Both the reference CD4 interaction with the tumor core, and the reference tumor core interaction with the CD4 phenotype directions of spatial interactions were averaged.
The 9 tumor spatial clusters were tested for association with COO and after adjusting for IPI. Tumor_e (odds = 4.47 [1.49-22.23], P = .026), was significantly positively associated with non-GCB (supplemental Figure 15A). Next, fitting multiple logistic regression models of Chapuy cluster onto tumor topology case proportions accounting for IPI and COO, the odds of C4 and C3 DLBCL subtype increased 3.33 (95% CI, 1.43-13.99; P = .025) and 2.45 (95% CI, 1.15-7.23; P = .046) times for an increase in tumor_e proportions, respectively. Tumor_i was associated with a 2.76 (95% CI, 1.31-8.85; P = .029) fold increase in C2 DLBCL subtype. Upon omitting COO from the logistic models, tumor_e and tumor_i remained associated with C4 (odds = 2.71; 95% CI, 1.32-7.44; P = .018), and C2 (odds = 2.14; 95% CI, 1.14-5.85; P = .0496), respectively. Tumor_e was marginally associated with C3 after dropping COO (odds = 1.97; 95% CI, 1.01-4.78; P = .074). Tumor_c and tumor_d did not observe an association with genetic subtypes.
We next grouped the 9 tumor spatial clusters into 3 zones, inspired by the geological structure of the earth: dispersed (tumor_b, tumor_a, tumor_e, and tumor_g), crust/mantle (tumor_c, tumor_h, tumor_f, and tumor_i), and core (tumor_d) We then plotted the number of significant spatial attractions or repulsions (P < .01) between each tumor spatial cluster and the major immune clusters (Figure 4E; supplemental Figure 11A).36 CD8 cells were enriched in the crust and dispersed regions and depleted in the core and mantle regions while macrophages were most enriched in the transition (crust) regions. CD4 cells were found in the immune rich areas with CD8 cells or in the immune desert regions but were depleted in regions with high macrophages.
We then examined the depletion or enrichment of specific immune phenotypes in each region (Figure 4F; supplemental Figure 11B). The dispersed tumor regions were heterogeneous and enriched for terminally exhausted CD8, active/proliferating CD8, and M1-MAC, suggesting a robust immune response. The tumor crust/mantle region was dominated by macrophages with some CD8 and depleted for activated/early exhausted CD4 cells. The most striking finding from the spatial analysis was a correspondence between CD4 cells’ CXCR3 coexpression, and the average number of significant spatial attractions with the tumor core (P = 2e-03, R2 = 0.99; Figure 4G). This suggests that CXCR3 plays a role in granting CD4 cells entry into otherwise restricted tumor sites and suggests a possible target for enhancing immune cell penetration into the tumor core regions.
Cross-cohort analysis shows differences in proportion and functional states of immune cell subsets between DLBCL and Hodgkin lymphoma
PD-1/PD-L1 immune checkpoint inhibitors have demonstrated very poor response rates (<10%) in relapsed DLBCL; however, they achieve close to 90% response rates in Hodgkin lymphoma, a related aggressive lymphoma also of B-cell origin.24,44 Therefore, we hypothesized that comparing the TME between reactive lymph nodes, Hodgkin lymphoma, and DLBCL might reveal the basis for the difference in clinical responses to checkpoint inhibitors. We previously reported our analysis of the TME in 5 reactive lymph nodes and 22 cases of Hodgkin lymphoma using a 36 marker IMC panel, of which 21 markers overlapped with the IMC DLBCL panel (supplemental Figure 12A).29 We integrated the TME analysis from both diseases after subsetting each experiment to include only CD4, CD8, MAC, and TREG cells, and identified the joint TME phenotypes (Figure 5A).
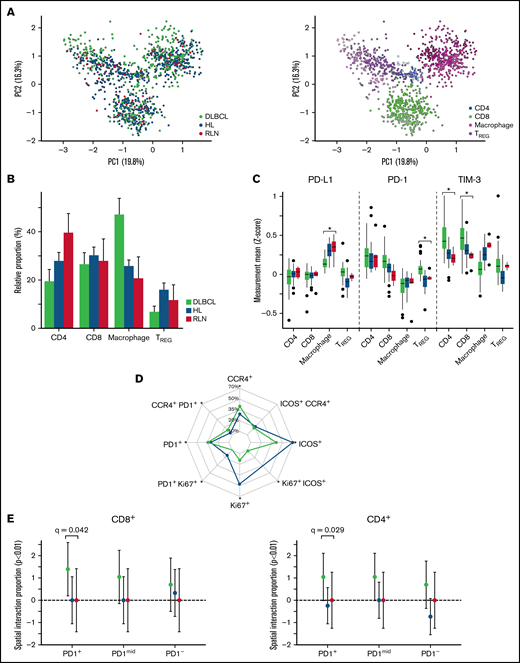
Cross-cohort analysis shows differences in proportion and functional states of immune subphenotypes between DLBCL and Hodgkin lymphoma (HL). (A) After batch normalization, the PCA visually confirms the immune subphenotypes identified are well distributed across the 2 cohorts, indicating no cohort bias. Visual inspection confirmed using k-nearest neighbor quantitative batch effect test (kBET) (see supplemental Figure 12). (B) TME compartment proportions (%) relative to each cohort (DLBCL/HL/RLN) are denoted on the y-axis, and the x-axis denotes major phenotypes. Comparing differences with RLN, macrophages were increased 21.3% (95% CI, 12.4-30.2; BH q < 1e-03) in DLBCL compared with differences between HL and RLN. Comparing TREG relative differences between RLN, DLBCL showed a 9.1% (95% CI, -13.6 to -4.7; q = 3.2e-04) less enriched abundance compared with differences between HL and RLN. (C) Analyses of cell-state protein expression (Z-score) on each immune subset across the 2 cohorts show differences in functional states of immune subsets in DLBCL compared with HL. PD-L1 expression on macrophages is significantly lower in DLBCL compared with HL (logFC= -0.08, q < 1e-05), whereas PD-1 expression is higher on TREG (logFC = 0.23, q < 1e-04) in DLBCL compared with HL. TIM-3 expression is significantly higher in CD8 T cells comparing DLBCL to HL (logFC = 0.57, q < 1e-05), and significantly higher in CD4 T cells compared DLBCL with HL (logFC = 0.31, q < 1e-05). (D) For each experiment, global expression gating identified CCR4+, ICOS+, Ki67+, PD1+ separately for each cohort, and relative proportions among +TREG cells are depicted. The grids on the radar denote the cohort proportion (%) among TREG phenotypes positive for a corresponding phenotype. Significant differences comparing TREG case relative proportions (P < .05) are denoted with an asterisk. There were significant higher case relative proportions of CCR4+PD-1+ TREG (6.087%; 95% CI, 2.56-9.62; P < .001) in DLBCL compared with HL, and significantly higher PD-1+ TREG relative proportions (6.85%; 95% CI, 3.76-9.93; P < .001). Alternatively, there were significantly fewer Ki67+ T-reg (-28.34%; 95% CI, -33.42 to -23.26%; P < .001) comparing DLBCL with HL relative proportions (supplemental Figure 15). (E) Spatial interactions between PD1+CCR4+ TREG and T cells were computed using a radius of interaction of 15 microns (1000 permutations, P < .01), and the relative proportion within each cohort of significant interactions/repulsions (P < .01) between PD1+CCR4+TREG and PD1+/mid/− CD8 (left) and CD4 (right) T cells were compared across cohorts using an ANOVA. The y-axis denotes the relative proportion of significant interactions (P < .01), and significant differences (BH adjusted p values) of proportions comparing DLBCL with HL and RLN are depicted.
Cross-cohort analysis shows differences in proportion and functional states of immune subphenotypes between DLBCL and Hodgkin lymphoma (HL). (A) After batch normalization, the PCA visually confirms the immune subphenotypes identified are well distributed across the 2 cohorts, indicating no cohort bias. Visual inspection confirmed using k-nearest neighbor quantitative batch effect test (kBET) (see supplemental Figure 12). (B) TME compartment proportions (%) relative to each cohort (DLBCL/HL/RLN) are denoted on the y-axis, and the x-axis denotes major phenotypes. Comparing differences with RLN, macrophages were increased 21.3% (95% CI, 12.4-30.2; BH q < 1e-03) in DLBCL compared with differences between HL and RLN. Comparing TREG relative differences between RLN, DLBCL showed a 9.1% (95% CI, -13.6 to -4.7; q = 3.2e-04) less enriched abundance compared with differences between HL and RLN. (C) Analyses of cell-state protein expression (Z-score) on each immune subset across the 2 cohorts show differences in functional states of immune subsets in DLBCL compared with HL. PD-L1 expression on macrophages is significantly lower in DLBCL compared with HL (logFC= -0.08, q < 1e-05), whereas PD-1 expression is higher on TREG (logFC = 0.23, q < 1e-04) in DLBCL compared with HL. TIM-3 expression is significantly higher in CD8 T cells comparing DLBCL to HL (logFC = 0.57, q < 1e-05), and significantly higher in CD4 T cells compared DLBCL with HL (logFC = 0.31, q < 1e-05). (D) For each experiment, global expression gating identified CCR4+, ICOS+, Ki67+, PD1+ separately for each cohort, and relative proportions among +TREG cells are depicted. The grids on the radar denote the cohort proportion (%) among TREG phenotypes positive for a corresponding phenotype. Significant differences comparing TREG case relative proportions (P < .05) are denoted with an asterisk. There were significant higher case relative proportions of CCR4+PD-1+ TREG (6.087%; 95% CI, 2.56-9.62; P < .001) in DLBCL compared with HL, and significantly higher PD-1+ TREG relative proportions (6.85%; 95% CI, 3.76-9.93; P < .001). Alternatively, there were significantly fewer Ki67+ T-reg (-28.34%; 95% CI, -33.42 to -23.26%; P < .001) comparing DLBCL with HL relative proportions (supplemental Figure 15). (E) Spatial interactions between PD1+CCR4+ TREG and T cells were computed using a radius of interaction of 15 microns (1000 permutations, P < .01), and the relative proportion within each cohort of significant interactions/repulsions (P < .01) between PD1+CCR4+TREG and PD1+/mid/− CD8 (left) and CD4 (right) T cells were compared across cohorts using an ANOVA. The y-axis denotes the relative proportion of significant interactions (P < .01), and significant differences (BH adjusted p values) of proportions comparing DLBCL with HL and RLN are depicted.
After integrating both experiments, we tested for the presence of batch effects and found the data to be well integrated (Figure 5A; supplemental Figures 12-14).38,45
Comparing the TME phenotype proportions among DLBCL, Hodgkin lymphoma, and RLN, macrophages were significantly enriched (BH q < 1e-03) in DLBCL compared with Hodgkin lymphoma, whereas TREG were depleted in DLBCL (BH q<3.2e-04) (Figure 5B). However, when we examined the expression of PD-L1, PD-1 and TIM-3 on key immune groups we observed that PDL-1 was highest in macrophages from HL (BH q < 1e-05), whereas PD-1 was the highest TREG cells in DLBCL (BH q < 1e-04) (Figure 5C). Finally, expression of the TIM-3, a checkpoint molecule of interest in PD-1/PD-L1-resistant tumors, was highest in CD4 and CD8 T cells in DLBCL (BH q < 1e-05).
TREG have been implicated in resistance to checkpoint inhibitors; therefore, we focused additional analysis on the TREG compartment.46 Proliferative and ICOS+ TREG populations were enriched in Hodgkin lymphoma (P < .001), whereas CCR4+ and PD-1+ populations were enriched in DLBCL (P < .001) (Figure 5D). To understand if the CCR4+PD1+ TREG in DLBCL could be exerting an immunosuppressive effect on CD4 and CD8 cells, we performed a spatial analysis and observed increased interaction with PD-1+ CD8 (BH q = 0.012) and PD-1+ CD4 (BH q = 0.03), whereas in Hodgkin lymphoma and RLN, these interactions were not present (BH q > 0.5) (Figure 5D-E; supplemental Figure 15D). In summary, these results present striking differences in the expression of PD-1 and PDL-1 molecules on immune cells in the TME of DLBCL and Hodgkin lymphoma and suggest a possible mechanism of ICI resistance observed in DLBCL.
Discussion
This multiplexed single-cell study of the tumor immune architecture in DLBCL is the first to integrate the intratumor heterogeneity of B-cell lymphoma architecture and identify immune phenotypes that correlate with COO, tumor mutation-defined clusters, and response to therapy. B-cell lymphoma has a previously unrecognized structure with areas of higher/lower immune density with specific functional phenotypes (Figure 6). Recent large-scale efforts to characterize the immune microenvironment in DLBCL demonstrate that the TME contains additional prognostic and predictive information beyond cell of origin or genetic subtypes.47-49 These studies differ in that they relied heavily on deconvolution of bulk transcriptomic data compared with the single-cell spatial proteomics data. Important future efforts harmonizing approaches between omics into a consensus framework are needed.
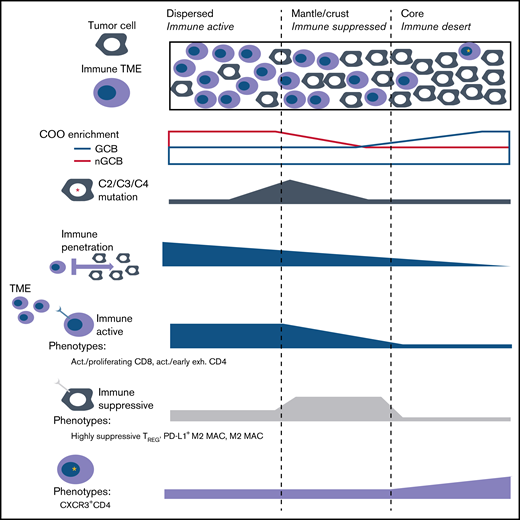
The tumor-centric neighborhoods which are defined by their proximity to their nearest immune cell, indicated that dispersed regions had the closest distances to the TME, and were significantly more likely to neighbor an immune-active phenotype compared with a suppressive/exhausted phenotype (Fisher exact test P = .047) (top). The mantle/crust regions were moderately further from the TME interface and immunosuppressive TME phenotypes were significantly more likely to neighbor within this district compared with an activate phenotype (Fisher exact P = .027). The tumor core neighborhood represented an immune desert that contained increased CXCR3 expression on CD4 subphenotypes (bottom). The tumor core proportions did not have an association with COO, or any DLBCL subtype, whereas the mantle (I), and dispersed tumor (E) neighborhoods were significantly positively associated with DLBCL subtypes C2 (P = .029), C3 (P = .046), and C4 (P = .025), respectively.
The tumor-centric neighborhoods which are defined by their proximity to their nearest immune cell, indicated that dispersed regions had the closest distances to the TME, and were significantly more likely to neighbor an immune-active phenotype compared with a suppressive/exhausted phenotype (Fisher exact test P = .047) (top). The mantle/crust regions were moderately further from the TME interface and immunosuppressive TME phenotypes were significantly more likely to neighbor within this district compared with an activate phenotype (Fisher exact P = .027). The tumor core neighborhood represented an immune desert that contained increased CXCR3 expression on CD4 subphenotypes (bottom). The tumor core proportions did not have an association with COO, or any DLBCL subtype, whereas the mantle (I), and dispersed tumor (E) neighborhoods were significantly positively associated with DLBCL subtypes C2 (P = .029), C3 (P = .046), and C4 (P = .025), respectively.
Spatial classification of tumor-infiltrating lymphocytes in solid tumors is well established; however, this is the first report to systematically characterize the immune cells in immune rich and poor areas within DLBCL tumors.50 This high density of cells within lymphoma tissue makes such a classification challenging and largely impossible by the techniques of diagnostic pathology.
Within DLBCL, a recent large-scale multiplexed study with a focus on the role of PD-L1 and PD-1 on CD20+ DLBCL cells was performed using immunofluorescence, but that study was limited to 13 markers.41 In that study, Xu-Monette et al identified that PD-1+CD8 cells were associated with poorer overall survival. PD-1 expression on CD4 also showed adverse prognosis on univariate analysis at low cutoffs, but a paradoxically better prognosis with a high-level cutoff. These results suggest that there may be subpopulations within the PD-1+CD4 population that have differential effects on survival. Indeed, in our study we observed that CD4 and CD8 T cells with PD-1 expression could be further divided into activated Ki67+T cells and terminally exhausted PD-1+TIM-3+LAG-3+ triple-positive T cells, highlighting the importance of multiplexed analysis.
Although this cohort consists of 91% Hispanic/Asian ethnicity representing a unique sample from the typical population in the United States, our results implicate various TREG populations as areas for further study. Baseline TREG were differentially expressed between Chapuy clusters C2 and C3, whereas pSTAT3+ TREG were most strongly associated with refractoriness to chemotherapy. CCR8+ TREG have been demonstrated to be “master regulators” of the immune response.51 Although CCR8 was not included in our panel, CCR8+ TREG are known to depend on STAT3 signaling suggesting that the pSTAT3+ TREG we observed associated with chemo-refractoriness may be that same CCR8+ population.
We observed that tumor core areas, areas that exclude immune cells, are found in most DLBCL cases and may have important implications for the clinical failure of ICI therapies and resistance to cellular therapies such as chimeric antigen receptor (CAR) T cells. Among the CD4 cells, we observed that CXCR3-high subsets, although rare, had infiltrating potential in lymphoma, similar to previous reports in other diseases.52-54 Importantly, Xu-Monette et al reported that upregulation of CXCL9, a ligand for CXCR3, was found in DLBCL with higher T-cell infiltration, further supporting the role of CXCR3 in T-cell homing to tumor core regions.41 We hypothesize that activating CXCR3 or enforcing expression of CXCR3 on CAR-T might improve immune cell penetration into lymphoma core regions. Applications of IMC analysis on treatment biopsies after CAR-T therapy could be particularly helpful to understanding treatment response and failure in this context.
Given the clinical failure of PD-1/PD-L1 inhibitors in DLBCL, identifying novel immuno-oncology targets for DLBCL remains critically important. DLBCL checkpoint therapy nonresponsiveness can be further understood by investigating alternative checkpoint molecules beyond PD-1/PD-L1 such as TIM-3, LAG3, and/or VISTA. Interestingly, DLBCL had higher levels of PD-1 on T cells compared with Hodgkin lymphoma, an observation that is consistent with PD-1 being a poor biomarker of checkpoint response. Additionally, the comparison between DLBCL to Hodgkin lymphoma identified TIM-3 as overexpressed primarily in CD4 and CD8 T cells, which highlights it as a therapeutic target.55 Furthermore, PD-1 was enriched in TREG in DLBCL, whereas TIM-3 on TREG was not, which demonstrates the importance of identifying therapeutic targets that are differentially enriched on specific CD4/CD8 immune subsets. Given the observed high level of PD-1 on TREG, anti-PD-1 antibodies may have led to increased activity of TREG resulting in paradoxical suppression of immune response after checkpoint therapy and clinical failure. Finally, PD-L1 expression on macrophages is a known biomarker of ICI response and we observed the highest levels of PD-L1 on macrophages in Hodgkin lymphoma, consistent with prior reports.56 These observations demonstrate that comparisons of TME between ICI responsive and nonresponsive subtypes of lymphoma can suggest potential mechanisms of ICI sensitivity and resistance.
To perform cross-comparisons between DLBCL and HL, we integrated IMC data from experiments performed using different antibody panels. The increased dynamic range of signal with IMC, compared with IHC, creates challenges with increased variability in signal intensity across experiments. Here, using approaches to normalize and standardize the data, we were able to demonstrate meaningful comparisons between different data sets. There were limitations to this method, however, and even after data integration several markers had to be excluded because of poor normalization. Because additional studies are published using imaging mass cytometry or other similar high-multiplexed single-cell imaging techniques, methods to measure uncertainty across experimental procedures will need to be developed.
One limitation of this study is our mapping of molecular signatures to the Chapuy clusters. We characterized our cohort using somatic copy number alteration into pseudo-molecular signatures that were largely concordant with genetic subtypes, whereas C2 inference is limited because of its definition including several structural variants. Another limitation is related to the examination of small portions of the tumor area (approximately 1 mm2) and may not have captured biologically relevant heterogeneity outside the region of interest. However, within that small area, we discern a high degree of spatial and functional heterogeneity and describe a complex tissue architecture of immune response and suppression that corresponds to clinical features. Optimal sample size will also depend on the specific tumor type and size of spatial feature of interest. In our data, 7 cases had at least 1 duplicate core on the TMA. Analysis by PCA suggested that most duplicates clustered together (supplemental Figure 1C). This is important because on-treatment and progression biopsies, which are critical to understand the kinetics of immune response and failure of immune-oncology agents, are often obtained as core needle biopsies, which are much smaller than the excision biopsies used in this study.
Finally, the multiplex analysis provided by IMC could help guide the next generation of combination ICI therapies, including newer agents targeting CCR4, LAG-3, and TIM-3, or novel cellular therapies and bispecific antibodies currently in development for lymphoma. Combining IMC with multi-omics profiling of pretreatment and on-treatment biopsies will improve our understanding of resistance and clinical failure for ICI and cellular therapies.
Acknowledgments
Access to the imaging mass cytometry system was obtained through the Fluidigm Early Access Program and support from the USC Michelson CSI-Cancer program. The content is solely the responsibility of the authors and does not necessarily represent the official views of the National Cancer Institute or the National Institutes of Health.
This project was supported by funding from the Ming Hsieh Institute at University of Southern California to A.M., J.H., and P.K. Additional support for this project was provided by the National Institutes of Health National Cancer Institute K08 CA154975-01A1 career development award to A.M., a Paul Allen Distinguished Investigator award (Frontiers Group, C. Steidl), and National Heart, Lung, and Blood Institute (HL138414-01A1) to A.M.
Authorship
Contribution: A.R.C. designed the research, analyzed the data, and wrote the paper; M.H. analyzed the data, performed experimental validation of tissues, and supported design concepts; A.X. analyzed the data; A.G. performed experimental validation and analyzed the data; T.L. assisted with writing the paper and finalized the high-quality figure editing; E.G. analyzed the data and provided initial software for analysis; M.S. performed the experimental validation, tissue staining, and assisted with the panel design; D.C. analyzed the data and helped conceptualize the design; J.H. supported the generation of the data and research design regarding mutational targeted panel; R.S. supported the generation of the data and research design regarding targeted panel; T.A., L.C, K.T, and E.A.C. analyzed the data; C.S. analyzed the data and supported the research design; J.H. and P.K. supported the research design and provided experimental design of the panel; I.S. designed the research, contributed vital tissues with important longitudinal patient follow-up clinical data, and supported the conceptualization of the design; and A.M. designed the study, conceptualized the research hypothesis, analyzed the data, wrote the manuscript, and performed vital supervision of the experimental panel design.
Conflict-of-interest disclosure: J.H. was employed by Cancer Genetics Inc., R.S. was employed by Cancer Genetics Inc., M.H. was employed by IonPath Inc., and E.G. was employed by Bionamic AB.
The current affiliation for J.H. is the Department of Pathology, Mount Sinai School of Medicine, New York, NY.
The current affiliation for R.S. is GRAIL, Incorporated, Menlo Park, CA.
Correspondence: Akil Merchant, Samuel Oschin Comprehensive Cancer Institute, Cedars-Sinai Medical Center, 8700 Beverly Blvd, A8103, Los Angeles, CA 90048; e-mail: akil.merchant@cshs.org.

