

Key Points
Outcomes of allo-HCT for ALL improved over 30 years, with an overall decrease in nonrelapse mortality and a decline in relapse among CR1.
Although the survival of Ph+ patients steadily improved, improvements for high-risk non-Ph patients were inadequate.

Abstract
Allogeneic hematopoietic cell transplantation (allo-HCT) is a promising treatment for adult acute lymphoblastic leukemia (ALL), an intractable hematological malignancy. The trends in allo-HCT outcomes over the past 30 years were examined to verify the efficacy of evolving treatment methods and to identify further challenges. We analyzed data from a registry database that included 8467 adult ALL patients who underwent their first allo-HCT between 1990 and 2019. The period was divided into three 10-year intervals for analysis. Five-year overall survival improved from 48.2% to 70.2% in the first complete remission (CR1), from 25.6% to 44.1% in subsequent CR, and from 10.0% to 22.7% in non-CR. Nonrelapse mortality improved over the 3 decades in each disease stage. However, the relapse rate only improved in CR1 every decade (26.3% to 15.9% in CR1, 33.4% to 32.8% in subsequent CR, and 53.6% to 54.8% in non-CR). Although there were continual improvements in adjusted survival for Philadelphia chromosome (Ph)-positive patients, the improvement was inadequate for Ph− patients with t(4;11), t(8;14), t(14;18), or hypodiploidy. Allo-HCT outcomes for adults with ALL have improved over the past 30 years. Improved outcomes in the future will require more effective prevention of relapse in patients with ALL not in CR1 and in those with high-risk chromosomal abnormalities.
Introduction
In adults, acute lymphoblastic leukemia (ALL) is an intractable hematological malignancy. Allogeneic hematopoietic cell transplantation (allo-HCT) has been performed for high-risk patients in the first complete remission (CR1) and with advanced stages of ALL.1-3 Over the past 30 years, remarkable developments have been made in both allo-HCT methods and treatments for ALL, which could improve patient outcomes. Advances in allo-HCT methods include decreased toxicity with the development of reduced-intensity conditioning (RIC) regimens especially in elderly patients, and improvements in graft-versus-host disease (GVHD) prophylaxis and infectious disease treatments.4,5 Additionally, developments in ALL treatments include the introduction of pediatric-inspired intensive chemotherapy for adult patients6,7 and tyrosine kinase inhibitors (TKIs) for Philadelphia chromosome–positive ALL (Ph+).8
Although some reports suggest changes in ALL treatment outcomes over time,9,10 there has been no large-scale study focusing on the results of allo-HCT for ALL. Furthermore, risk factors such as chromosomal abnormalities are well known in ALL.11-14 Therefore, analyzing changes in allo-HCT outcomes according to the known risk factors will clarify which groups experience insufficient treatment outcomes. That will clarify the patient groups that require further improvements in treatment strategies.
Methods
Data collection
Clinical data were provided by the Japan Society for Transplantation and Cellular Therapy and the Japanese Data Center for Hematopoietic Cell Transplantation using the Transplant Registry Unified Management Program (TRUMP) as described previously.15 Data from patients who were at least 16 years of age and had undergone their first allo-HCT for ALL between 1990 and 2019 were selected from the TRUMP database. This registration program covers nearly all transplantation centers nationwide and provides data regarding survival, disease status, and long-term complications, including chronic GVHD and secondary malignancies, which are updated annually. According to current ethical guidelines, an opt-out consent process is permitted for observational studies using existing data. Patients who declined to register were not included in this study. This study was approved by the data management committees of the Japan Society for Transplantation and Cellular Therapy as a study performed by the adult ALL Working Group and the Institutional Review Board of Nagoya University Hospital. It was conducted in accordance with the Declaration of Helsinki.
Definitions
Chromosomal abnormalities were classified with reference to previous reports11,16 : (1) t(9;22)/BCR-ABL1 fusion (Ph+); (2) t(4;11); (3) other KMT2A translocations; (4) t(1;19); (5) t(8;14); (6) t(14;18); (7) t(12;21); (8) monosomy 7 (-7), excluding patients with established translocations listed above; (9) complex karyotype (3 or more chromosomal abnormalities), excluding patients with established chromosomal abnormalities listed above; (10) hypodiploidy (<45 chromosomes); (11) hyperdiploidy (>50 chromosomes); (12) other abnormalities (any abnormal karyotype without any of the abnormalities listed above); and (13) normal karyotype.
Relapse was defined as the recurrence of hematological leukemia. Nonrelapse mortality (NRM) was defined as death during continuous remission. For analyses of overall survival (OS), failure was defined as death from any cause, and surviving patients were censored at the date of the last contact. We defined RIC with the following dosage levels: busulfan <9 mg/kg, melphalan <140 mg/m2, and total body irradiation ≤500 cGy (single) or 500 to 800 cGy (fractionated).17 Human leukocyte antigen (HLA)-matching of cord blood (CB) was performed using low-resolution typing for HLA-A, -B, and -C and high-resolution molecular typing for HLA-DRB1. In unrelated donors, HLA matching was performed using high-resolution typing for HLA-A, -B, -C, and HLA-DRB1.18-20 Unrelated donors with no known disparity for HLA-A, -B, -C, or -DRB1 were considered well matched, whereas those presenting 1 locus that demonstrated disparity with the donor were partially matched. Mismatched donors had disparities in ≥2 loci. For CB, well matched was defined as having no known disparities among HLA-A, -B, -C, or -DRB1, whereas partially matched was defined by at least 4 loci matches. CB with ≤3 loci matches was considered mismatched.21-24
Statistical analysis
Two-sided χ2 tests were used to compare categorical variables, and Mann-Whitney U tests or the Kruskal-Wallis tests were used to compare continuous variables. The Kaplan-Meier method was used to estimate OS and leukemia-free survival (LFS), and P values were calculated using a log-rank test.25,26 The cumulative incidence of relapse and NRM were calculated using Gray’s method.27,28 For relapse rate (RR), death without relapse was the competing event; for NRM, relapse was the competing event. Cox proportional hazards models were used to perform multivariate analyses of OS and LFS,29 and Fine-Gray proportional hazards models were used for multivariate analyses of events with competing risks. The adjusted probabilities of OS and LFS were estimated using a Cox proportional hazards regression model, considering other clinical variables in the final multivariate models. Similarly, the adjusted probabilities of RR and NRM were estimated using the Fine-Gray proportional hazards regression model, with the consideration of other clinical variables in the final multivariate models. For the multivariate analyses, potential covariates were included in the final multivariate model regardless of their statistical significances in univariate models: we included karyotype, patient age, and white blood cell count at diagnosis for potential risk factors of ALL,11,30,31 as well as conditioning intensity, donor source, and disease status for potential risk factors of allo-HCT in the multivariate analyses.32,33 A significance level of P < .05 was used for all analyses. All statistical analyses were conducted with Stata version 17.0 software (Stata Corp. LP, College Station, TX) and EZR version 1.53 (Jichi Medical University Saitama Medical Center),34 which is a graphical user interface for R (The R Foundation for Statistical Computing, version 4.1.0, Vienna, Austria).
Results
Patient characteristics
We analyzed the data of 8467 adult ALL patients: 1230 patients were transplanted between 1990 and 1999 (decade 1, D1), 3012 between 2000 and 2009 (decade 2, D2), and 4225 between 2010 and 2019 (decade 3, D3). Table 1 provides the patient characteristics by decade (patient characteristics by chromosomal risks are shown in supplemental Tables 1 and 2.). Patient age increased every decade, as did the number of allo-HCTs in CR1, with unrelated CB or with RIC.
Characteristics of patients with ALL according to the allo-HCT period
| 1990-1999 | 2000-2009 | 2010-2019 | P | |||||
|---|---|---|---|---|---|---|---|---|
| N = 1230 | N = 3012 | N = 4225 | ||||||
| Age at allo-HCT, y | Median (IQR) | 26 | (20-37) | 37 | (25-49) | 43 | (30-55) | <.001 |
| ≤16, <25 | 552 | (44.9%) | 714 | (23.7%) | 666 | (15.8%) | <.001 | |
| ≤25, <55 | 667 | (54.2%) | 1911 | (63.4%) | 2482 | (58.7%) | ||
| 55≤ | 11 | (0.9%) | 387 | (12.8%) | 1077 | (25.5%) | ||
| WBC at diagnosis | Median (IQR) | 14 600 | (4600-51 440) | 15 810 | (5000-58 900) | 15 500 | (5125-57 545) | .23 |
| Phenotype | B | 758 | (61.6%) | 2288 | (76.0%) | 3302 | (78.2%) | <.001 |
| T | 137 | (11.1%) | 373 | (12.4%) | 527 | (12.5%) | ||
| Other | 92 | (7.5%) | 196 | (6.5%) | 193 | (4.6%) | ||
| Missing | 243 | (19.8%) | 155 | (5.1%) | 203 | (4.8%) | ||
| Karyotype | Normal | 457 | (37.2%) | 1005 | (33.4%) | 1171 | (27.7%) | <.001 |
| t(9;22) | 226 | (18.4%) | 1062 | (35.3%) | 1726 | (40.9%) | ||
| t(4;11) | 13 | (1.1%) | 64 | (2.1%) | 100 | (2.4%) | ||
| t(1;19) | 10 | (0.8%) | 64 | (2.1%) | 94 | (2.2%) | ||
| Hyperdiploid (>50) | 27 | (2.2%) | 62 | (2.1%) | 75 | (1.8%) | ||
| −7 | 5 | (0.4%) | 30 | (1.0%) | 92 | (2.2%) | ||
| Complex | 6 | (0.5%) | 54 | (1.8%) | 67 | (1.6%) | ||
| Hypodiploid (<45) | 9 | (0.7%) | 19 | (0.6%) | 33 | (0.8%) | ||
| t(8;14) | 11 | (0.9%) | 25 | (0.8%) | 22 | (0.5%) | ||
| t(14;18) | 3 | (0.2%) | 10 | (0.3%) | 14 | (0.3%) | ||
| 11q23 | 0 | (0.0%) | 8 | (0.3%) | 19 | (0.4%) | ||
| t(12;21) | 0 | (0.0%) | 2 | (0.1%) | 12 | (0.3%) | ||
| Others | 102 | (8.3%) | 383 | (12.7%) | 652 | (15.4%) | ||
| Missing | 361 | (29.3%) | 224 | (7.4%) | 148 | (3.5%) | ||
| Status at allo-HCT | CR1 | 630 | (51.2%) | 1728 | (57.4%) | 2968 | (70.2%) | <.001 |
| Subsequent CR | 233 | (18.9%) | 426 | (14.1%) | 529 | (12.5%) | ||
| Nonremission | 303 | (24.6%) | 755 | (25.1%) | 713 | (16.9%) | ||
| Missing | 64 | (5.2%) | 103 | (3.4%) | 15 | (0.4%) | ||
| Sex | Female | 503 | (40.9%) | 1388 | (46.1%) | 1868 | (44.2%) | .008 |
| Male | 727 | (59.1%) | 1624 | (53.9%) | 2355 | (55.7%) | ||
| Missing | 0 | (0.0%) | 0 | (0.0%) | 2 | (0.0%) | ||
| Donor | Related donor | 801 | (65.1%) | 1206 | (40.0%) | 1325 | (31.4%) | <.001 |
| UBM | 407 | (33.1%) | 1256 | (41.7%) | 1756 | (41.6%) | ||
| UCB | 6 | (0.5%) | 538 | (17.9%) | 1143 | (27.1%) | ||
| Missing | 16 | (1.3%) | 12 | (0.4%) | 1 | (0.0%) | ||
| Source | BM | 1139 | (92.6%) | 1822 | (60.5%) | 2064 | (48.9%) | <.001 |
| PB | 69 | (5.6%) | 640 | (21.2%) | 1017 | (24.1%) | ||
| BM + PB | 16 | (1.3%) | 12 | (0.4%) | 1 | (0.0%) | ||
| CB | 6 | (0.5%) | 538 | (17.9%) | 1143 | (27.1%) | ||
| HLA disparity | Well matched | 679 | (55.2%) | 1424 | (47.3%) | 1952 | (46.2%) | <.001 |
| Partially matched | 172 | (14.0%) | 1060 | (35.2%) | 1788 | (42.3%) | ||
| Mismatched | 91 | (7.4%) | 318 | (10.6%) | 462 | (10.9%) | ||
| Missing | 288 | (23.4%) | 210 | (7.0%) | 23 | (0.5%) | ||
| Conditioning regimen | MAC | 1176 | (95.6%) | 2512 | (83.4%) | 3004 | (71.1%) | <.001 |
| RIC | 17 | (1.4%) | 439 | (14.6%) | 1207 | (28.6%) | ||
| Missing | 37 | (3.0%) | 61 | (2.0%) | 14 | (0.3%) | ||
| ATG-based conditioning | (+) | 25 | (2.0%) | 52 | (1.7%) | 355 | (8.4%) | <.001 |
| (−) | 1153 | (93.7%) | 2894 | (96.1%) | 3854 | (91.2%) | ||
| Missing | 52 | (4.2%) | 66 | (2.2%) | 16 | (0.4%) | ||
| GVHD prophylaxis | CyA based | 1044 | (84.9%) | 1582 | (52.5%) | 1211 | (28.7%) | <.001 |
| Tac based | 109 | (8.9%) | 1301 | (43.2%) | 2926 | (69.3%) | ||
| Other | 33 | (2.7%) | 57 | (1.9%) | 74 | (1.8%) | ||
| Missing | 44 | (3.6%) | 72 | (2.4%) | 14 | (0.3%) | ||
ATG, antithymocyte globulin; BM, bone marrow; CyA, cyclosporin A; IQR, interquartile range; MAC, myeloablative conditioning; PB, peripheral blood; Tac, tacrolimus; UBM, unrelated bone marrow or peripheral blood; UCB, unrelated cord blood; WBC, white blood cell.
Overall changes over the 3 decades
Patient OS and LFS evidently improved every decade among those transplanted in CR1 (Figure 1; supplemental Figure 1). RR improved every decade in patients transplanted in CR1: the 5-year adjusted RR was 26.4% (95% confidence interval [CI], 22.7% to 30.6%) during D1, 19.9% (95% CI, 18.0% to 22.0%) during D2, and 15.9% (95% CI, 14.6% to 17.4%) during D3 (Figure 2A). The most significant improvement in RR was observed among Ph+ patients transplanted in CR1: the 5-year adjusted RR was 39.9% (95% CI, 30.7% to 50.9%) during D1, 21.4% (95% CI, 18.5% to 24.8%) during D2, and 14.6% (95% CI, 12.7% to 16.7%) during D3 (Figure 3). NRM also improved every decade in patients transplanted in CR1: the 5-year adjusted NRM was 26.3% (95% CI, 22.3% to 30.9%) during D1, 23.5% (95% CI, 21.5% to 25.7%) during D2, and 16.8% (95% CI, 15.3% to 18.3%) during D3 (Figure 2B).
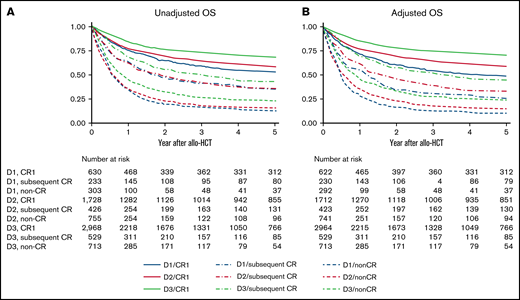
OS according to disease status and allo-HCT period. (A) Unadjusted OS. (B) Adjusted OS. Results are adjusted for age at allo-HCT, white blood cell at diagnosis, Ph chromosome, conditioning intensity (myeloablative conditioning, RIC), and donor source (related, unrelated bone marrow or peripheral blood, unrelated cord blood).
OS according to disease status and allo-HCT period. (A) Unadjusted OS. (B) Adjusted OS. Results are adjusted for age at allo-HCT, white blood cell at diagnosis, Ph chromosome, conditioning intensity (myeloablative conditioning, RIC), and donor source (related, unrelated bone marrow or peripheral blood, unrelated cord blood).

Relapse and NRM according to disease status and allo-HCT period. Results are adjusted for age at allo-HCT, white blood cell at diagnosis, Ph chromosome, conditioning intensity (myeloablative conditioning, RIC), and donor source (related, unrelated bone marrow, unrelated cord blood). (A) Adjusted RR. (B) Adjusted NRM.
Relapse and NRM according to disease status and allo-HCT period. Results are adjusted for age at allo-HCT, white blood cell at diagnosis, Ph chromosome, conditioning intensity (myeloablative conditioning, RIC), and donor source (related, unrelated bone marrow, unrelated cord blood). (A) Adjusted RR. (B) Adjusted NRM.

Relapse in CR1 according to Ph status. Results are adjusted for age at allo-HCT, white blood cell at diagnosis, conditioning intensity (myeloablative conditioning, RIC), and donor source (related, unrelated bone marrow, unrelated cord blood). (A) Adjusted RR of non-Ph patients in CR1. (B) Adjusted RR of Ph+ patients in CR1.
Relapse in CR1 according to Ph status. Results are adjusted for age at allo-HCT, white blood cell at diagnosis, conditioning intensity (myeloablative conditioning, RIC), and donor source (related, unrelated bone marrow, unrelated cord blood). (A) Adjusted RR of non-Ph patients in CR1. (B) Adjusted RR of Ph+ patients in CR1.
Patient OS and LFS also improved every decade among those transplanted in subsequent CR or non-CR. However, little improvement in RR was observed for patients other than CR1. The 5-year adjusted RR was 33.4% (95% CI, 26.7% to 41.2%) during D1, 37.8% (95% CI, 32.9% to 43.1%) during D2, and 32.8% (95% CI, 28.6% to 37.5%) during D3 for patients in subsequent CR and 53.6% (95% CI, 47.0% to 60.5%) during D1, 52.6% (95% CI, 48.7% to 56.5%) during D2, and 54.8% (95% CI, 50.9% to 58.8%) during D3 in non-CR (Figure 2A). Even in Ph+ patients, no continuous improvement in RR was observed other than CR1: the 5-year adjusted RR in subsequent CR was 38.3% (95% CI, 22.5% to 59.9%) during D1, 37.4% (95% CI, 27.4% to 49.7%) during D2, and 33.5% (95% CI, 25.7% to 43.0%) during D3 and 51.8% (95% CI, 40.9% to 63.7%) during D1, 46.7% (95% CI, 39.7% to 54.4%) during D2, and 50.1% (95% CI, 42.1% to 58.8%) during D3 in non-CR. On the other hand, NRM improved not only in CR1 but also in subsequent CR or non-CR over the 3 decades. The 5-year adjusted NRM for patients transplanted in subsequent CR was 42.5% (95% CI, 34.7% to 51.3%) during D1, 30.3% (95% CI, 25.8% to 35.5%) during D2, and 25.6% (95% CI, 21.8% to 29.8%) during D3. The 5-year adjusted NRM for non-CR was 36.9% (95% CI, 30.3% to 44.4%) during D1, 31.5% (95% CI, 28.1% to 35.3%) during D2, and 22.1% (95% CI, 19.1% to 25.5%) during D3 (Figure 2B).
The adjusted OS and LFS according to disease status, patient age, or donor source were summarized in Table 2.
Adjusted OS and LFS according to disease status, age, donor source, and Ph status
| 5-y OS (%) | 95% CI | 5-y LFS (%) | 95% CI | ||
|---|---|---|---|---|---|
| CR1 | 1990-1999 | 48.2 | 43.6-53.1 | 45.0 | 40.6-50.0 |
| 2000-2009 | 58.3 | 55.9-60.8 | 54.7 | 52.3-57.3 | |
| 2010-2019 | 70.2 | 68.4-72.2 | 65.5 | 63.6-67.5 | |
| Subsequent CR | 1990-1999 | 25.6 | 19.5-33.4 | 24.6 | 18.7-32.4 |
| 2000-2009 | 32.5 | 27.9-38.0 | 29.2 | 24.7-34.5 | |
| 2010-2019 | 44.1 | 39.2-49.5 | 37.7 | 33.1-42.9 | |
| Non-CR | 1990-1999 | 10.0 | 6.8-14.9 | 9.5 | 6.4-14.2 |
| 2000-2009 | 13.8 | 11.4-16.8 | 12.9 | 10.5-15.8 | |
| 2010-2019 | 22.7 | 19.2-26.8 | 17.9 | 14.7-21.7 | |
| ≤1, <25 y* | 1990-1999 | 45.1 | 40.2-50.6 | 40.8 | 36.0-46.3 |
| 2000-2009 | 49.8 | 45.9-54.2 | 46.7 | 42.7-51.0 | |
| 2010-2019 | 62.3 | 58.2-66.7 | 56.4 | 52.2-60.8 | |
| ≤25, <55 y* | 1990-1999 | 38.2 | 33.8-43.0 | 37.0 | 32.7-41.8 |
| 2000-2009 | 48.4 | 46.0-50.9 | 45.0 | 42.6-47.6 | |
| 2010-2019 | 58.9 | 56.6-61.4 | 53.1 | 50.8-55.5 | |
| ≤55 y* | 1990-1999 | 54.1 | 32.7-89.4 | 56.1 | 34.0-92.5 |
| 2000-2009 | 31.6 | 26.7-37.4 | 27.4 | 22.7-33.1 | |
| 2010-2019 | 46.7 | 43.1-50.6 | 41.4 | 37.9-45.2 | |
| Related donor* | 1990-1999 | 37.9 | 33.7-42.6 | 34.9 | 30.8-39.6 |
| 2000-2009 | 46.1 | 42.9-49.4 | 43.0 | 33.9-46.4 | |
| 2010-2019 | 57.3 | 54.1-60.7 | 50.6 | 47.5-54.0 | |
| Unrelated BM or PB* | 1990-1999 | 37.4 | 32.2-43.3 | 36.4 | 31.3-42.4 |
| 2000-2009 | 47.8 | 44.8-50.9 | 44.3 | 41.3-47.5 | |
| 2010-2019 | 60.4 | 57.6-63.3 | 55.3 | 52.5-58.2 | |
| Unrelated CB* | 1990-1999 | 79.5 | 59.6-100 | 77.6 | 56.0-100 |
| 2000-2009 | 40.1 | 35.6-45.1 | 36.5 | 32.2-41.4 | |
| 2010-2019 | 54.3 | 51.0-57.9 | 48.2 | 44.8-51.8 | |
| Non-Ph† | 1990-1999 | 38.3 | 34.0-43.2 | 36.3 | 32.1-41.1 |
| 2000-2009 | 45.4 | 42.9-48.1 | 43.3 | 40.8-46.0 | |
| 2010-2019 | 55.1 | 52.7-57.6 | 49.7 | 47.4-52.2 | |
| Ph+† | 1990-1999 | 27.1 | 20.9-35.2 | 25.9 | 19.8-33.9 |
| 2000-2009 | 46.1 | 42.9-49.5 | 40.7 | 37.5-44.1 | |
| 2010-2019 | 62.9 | 60.2-65.8 | 56.2 | 53.4-59.1 |
Adjusted for age at allo-HCT, white blood cell at diagnosis, Ph chromosome, conditioning intensity, and donor source.
Adjusted for age at allo-HCT, white blood cell at diagnosis, Ph chromosome, conditioning intensity, donor source, and disease status at allo-HCT.
Adjusted for age at allo-HCT, white blood cell at diagnosis, conditioning intensity, donor source, and disease status at allo-HCT.
Differences in transition between non-Ph and Ph+
Although improvements were observed for both non-Ph and Ph+ patients, adjusted OS and LFS were more markedly improved in Ph+ patients (Table 2; supplemental Figure 2). Furthermore, RR improved more apparently in Ph+ than in non-Ph patients every decade. The 5-year adjusted RR in non-Ph patients was 35.3% (95% CI, 31.0% to 39.9%) during D1, 31.5% (95% CI, 29.1% to 34.0%) during D2, and 30.2% (95% CI, 28.2% to 32.4%) during D3, whereas that in Ph+ patients was 35.4% (95% CI, 29.0% to 42.8%) during D1, 27.3% (95% CI, 24.4% to 30.4%) during D2, and 22.0% (95% CI, 19.8% to 24.4%) during D3 (supplemental Figure 3).
NRM improved every decade for both non-Ph and Ph+ patients. The 5-year adjusted NRM in non-Ph patients was 30.9% (95% CI, 26.6% to 35.8%) during D1, 26.4% (95% CI, 24.1% to 28.9%) during D2, and 20.8% (95% CI, 18.8% to 22.8%) during D3, and 5-year adjusted NRM in Ph+ patients was 35.0% (95% CI, 27.8% to 43.4%) during D1, 31.3% (95% CI, 28.3% to 34.7%) during D2, and 20.8% (95% CI, 18.5% to 23.4%) during D3 (supplemental Figure 3).
Transition differences due to chromosomal abnormalities in non-Ph patients
Continuous improvements in survival were not observed over these 3 decades in patients with t(4; 11), t(8; 14), t(14; 18), or hypodiploidy (supplemental Table 3). When analyzing these 4 chromosomal abnormalities as current high risk, little improvement was observed in either OS or LFS every decade (Figure 4; supplemental Figure 4). On the other hand, both OS and LFS improved every decade for other non-Ph patients (defined as current standard risk).
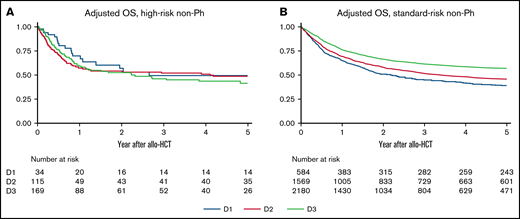
OS of non-Ph patients according to chromosomal risks and allo-HCT period. Results are adjusted for age at allo-HCT, white blood cell at diagnosis, conditioning intensity (myeloablative conditioning, RIC), donor source (related, unrelated bone marrow, unrelated cord blood), and disease status (CR1, subsequent CR, non-CR). (A) Adjusted OS of non-Ph patients with high-risk chromosomal abnormalities. (B) Adjusted OS of non-Ph patients with standard-risk chromosomal abnormalities.
OS of non-Ph patients according to chromosomal risks and allo-HCT period. Results are adjusted for age at allo-HCT, white blood cell at diagnosis, conditioning intensity (myeloablative conditioning, RIC), donor source (related, unrelated bone marrow, unrelated cord blood), and disease status (CR1, subsequent CR, non-CR). (A) Adjusted OS of non-Ph patients with high-risk chromosomal abnormalities. (B) Adjusted OS of non-Ph patients with standard-risk chromosomal abnormalities.
In multivariate analyses, high-risk non-Ph was not a significant risk factor for both survival and RR in D1 (standard-risk non-Ph as the reference). However, it became a significant risk factor for both survival and RR in D3, which contrasted with the decrease in relative risk of Ph+ each decade (Table 3).
Impact of chromosomal abnormalities among adult ALL patients according to the allo-HCT period: multivariate analyses
| 1990-1999 | 2000-2009 | 2010-2019 | ||||||
|---|---|---|---|---|---|---|---|---|
| Covariates | HR | 95% CI | Covariates | HR | 95% CI | Covariates | HR | 95% CI |
| Overall mortality | Overall mortality | Overall mortality | ||||||
| Standard non-Ph* | 1 | Ref | Standard non-Ph* | 1 | Ref | Standard non-Ph* | 1 | Ref |
| High-risk non-Ph† | 0.87 | 0.55-1.37 | High-risk non-Ph† | 1.19 | 0.93-1.52 | High-risk non-Ph† | 1.52 | 1.20-1.93 |
| Ph+ | 1.36 | 1.12-1.65 | Ph+ | 1.02 | 0.92-1.14 | Ph+ | 0.86 | 0.76-0.96 |
| Death or relapse | Death or relapse | Death or relapse | ||||||
| Standard non-Ph* | 1 | Ref | Standard non-Ph* | 1 | Ref | Standard non-Ph* | 1 | Ref |
| High-risk non-Ph† | 0.91 | 0.58-1.43 | High-risk non-Ph† | 1.23 | 0.97-1.57 | High-risk non-Ph† | 1.39 | 1.11-1.75 |
| Ph+ | 1.37 | 1.12-1.67 | Ph+ | 1.08 | 0.97-1.20 | Ph+ | 0.94 | 0.84-1.05 |
| RR | RR | RR | ||||||
| Standard non-Ph* | 1 | Ref | Standard non-Ph* | 1 | Ref | Standard non-Ph* | 1 | Ref |
| High-risk non-Ph† | 1.23 | 0.64-2.36 | High-risk non-Ph† | 1.09 | 0.75-1.61 | High-risk non-Ph† | 1.50 | 1.10-2.05 |
| Ph+ | 1.37 | 1.03-1.83 | Ph+ | 0.98 | 0.84-1.16 | Ph+ | 0.91 | 0.78-1.07 |
| NRM | NRM | NRM | ||||||
| Standard non-Ph* | 1 | Ref | Standard non-Ph* | 1 | Ref | Standard non-Ph* | 1 | Ref |
| High-risk non-Ph† | 0.59 | 0.26-1.35 | High-risk non-Ph† | 1.12 | 0.78-1.61 | High-risk non-Ph† | 0.97 | 0.67-1.40 |
| Ph+ | 1.02 | 0.74-1.40 | Ph+ | 1.11 | 0.95-1.29 | Ph+ | 0.98 | 0.85-1.14 |
Covariates included in the multivariate analyses were karyotype (standard non-Ph, high-risk non-Ph, Ph), patient age, white blood cell at diagnosis, conditioning (myeloablative conditioning, RIC), donor (related, unrelated bone marrow, unrelated cord blood), and disease status (CR1, subsequent CR, non-CR).
HR, hazard ratio.
Non-Ph other than t(8;14), t(4;11), t(14;18), hypodiploidy.
t(8;14), t(4;11), t(14;18), hypodiploidy.
Discussion
Over the past 30 years, the outcome of allo-HCT for adults with ALL has improved each decade. This trend was particularly notable among patients in CR1. Although survival improved in both non-Ph and Ph+ patients, the improvement was considered most evident in Ph+ patients as a result of TKI development.
Because non-Ph patients have various chromosomal abnormalities,35 we analyzed the transition of allo-HCT outcomes according to chromosomal abnormalities. There was a tendency for the transition of allo-HCT outcomes to differ depending on the chromosomal abnormalities. Among the known high-risk abnormalities,11,35-37 allo-HCT outcomes for patients with t(4; 11), t(8; 14), t(14; 18), or hypodiploidy showed no continuous improvement over 30 years, whereas outcomes for patients with other chromosomal abnormalities improved every decade. As hypodiploidy, KMT2A rearrangement, and immunoglobulin heavy chain translocation are also considered poor prognostic factors for pediatric or adolescent ALL,12,38 , -42 the benefits of improved outcomes from pediatric-inspired intensive chemotherapy might be inadequate in patients with such chromosomal abnormalities. Although the high-risk chromosomal abnormalities were as rare as 6.8% (323/4720) among non-Ph patients, analysis of large-scale registry data suggests this population has seen little improvement in allo-HCT outcomes. The improvement of allo-HCT outcomes for patients with such high-risk chromosomal abnormalities is desirable. Considering the success of TKIs for Ph+ patients, developing targeted agents may improve treatment results for non-Ph patients.43,44 Pretransplant molecular-targeted drugs may reduce not only relapse after allo-HCT but also NRM.45
The RR has not improved in Ph+ patients other than for those in CR1 (similar to non-Ph). The reason for the poor improvement in RR among Ph+patients (except for CR1) can be explained by the effect of TKI being inadequate in Ph+ patients other than CR1. The same situation was observed in non-Ph patients for which no specific molecular targeting drugs were available.
This study included data from patients who received their first allo-HCT between 1990 and 2019. As inotuzumab ozogamicin and blinatumomab were approved in 2018 and tisagenlecleucel was approved in 2019 for treating relapsed/refractory ALL in Japan, few patients received these drugs before their first allo-HCT. These drugs are effective as a bridge to allo-HCT46-48 ; therefore, it is expected that the allo-HCT outcomes for ALL will improve when using these drugs beforehand.
The continuous decline in NRM has played a major role in improving allo-HCT outcomes. It should be noted that NRM continues to decline despite an increase in allo-HCT for elderly patients and allo-HCT from HLA-mismatched and/or alternative donors. Although improvements in NRM have been reported previously,4 it is interesting to note that improvements in NRM were also observed among ALL patients, where intensive multidrug chemotherapy was given prior to allo-HCT.
This study had several limitations. Chemotherapy outcomes have improved with the introduction of pediatric-inspired intensive chemotherapy,7,49 and therefore, the indication for allo-HCT has changed over time for non-Ph patients. It is possible that some cases with good prognoses were included in earlier decades, especially during D1 or D2, and those cases would no longer be indicated for allo-HCT in CR1. Allo-HCT is performed in CR1 when it is expected to exceed the outcome of chemotherapy alone. During the last decade of this study (D3, 2010-2019), OS among patients transplanted in CR1 exceeded 70%. Although the transplant outcomes have been good in recent years, the results of chemotherapy for ALL have also improved. The 5-year OS was 73% among patients aged 15 to 24 who received a pediatric protocol in a Japanese study (22% transplanted in CR1).7 In addition, the 5-year LFS was 71% among standard-risk patients aged 25 to 40 (allo-HCT in CR1 were treated as censored cases).50 Adolescent and young adult patients without risk factors may achieve good results without allo-HCT in CR1.
Furthermore, limitations exist due to the retrospective nature of this study, which was performed using a database. A certain number of karyotype data were missing, and it amounted to nearly 30%, especially in 1990 to 1999 (D1). In addition, the options for numerical chromosomal abnormalities in the TRUMP database are only hypodiploid and hyperdiploid. It is impossible to accurately classify low hypodiploidy/near triploidy, which was reported as an adverse factor.11,35,51 Moreover, the measurable residual disease data, which is important as a strong predictor of relapse,52 were mainly available only among patients with Ph+ and therefore could not be incorporated as a covariate in this study. Although MRD detection using flow cytometry could be available in each institution, only limited MRD data for non-Ph was registered in the TRUMP database, and most of them were during 2010 to 2019 (D3). Because polymerase chain reaction–based MRD detection using immunoglobulin/T-cell receptor gene rearrangements was approved in 2018 in Japan in addition to the flow cytometry–based method, analysis including MRD will be possible in the future by accumulating more MRD data in the database.
Genetic abnormalities that have attracted attention in recent years were not included in this study.53-56 For example, although Ph-like ALL has been established as a non-Ph subset with a poor prognosis,57 Ph-like ALL could not be identified in the TRUMP database. In the near future, it will be necessary to plan a treatment strategy that considers genetic abnormalities, and an analysis of allo-HCT for ALL that includes genetic abnormalities as covariates is warranted.
In conclusion, allo-HCT outcomes for ALL have improved over the past 30 years. Over this time, NRM tended to improve in all stages, which may have contributed to the continuous improvement in transplant results regardless of disease stage. Furthermore, RR greatly improved in CR1 patients with Ph+. Given that the improvement in allo-HCT outcomes for patients with high-risk chromosomal abnormalities were inadequate, it is desirable to develop targeted strategies to improve allo-HCT outcomes for those patients.
Acknowledgment
This study was supported in part by Japan Society for the Promotion of Science KAKENHI grant number JP 20K08730.
Authorship
Contribution: S.N., Y. Akahoshi, M.M.-F., and Y. Arai designed the research, performed the statistical analysis, interpreted the data, and wrote the manuscript; H.S., N.U., Y.O., T.F., M.T., K.I., S.O., Y.K., S.T., T. Kawakita, T.A., and M.O. provided the data of patients; T. Kimura, J.T., T.F., and Y. Atsuta collected the data of patients; and all authors reviewed and approved the final draft.
Conflict-of-interest disclosure: The authors declare no competing financial interests.
A complete list of the members of the Adult Acute Lymphoblastic Leukemia Working Group of the Japan Society for Transplantation and Cellular Therapy appears in “Appendix.”
Correspondence: Satoshi Nishiwaki, Department of Advanced Medicine, Nagoya University Hospital, 65 Tsurumai-cho, Showa-ku, Nagoya 466-8560, Japan; e-mail: n-3104@tf7.so-net.ne.jp.
Appendix: group members
The Adult Acute Lymphoblastic Leukemia Working Group of the Japan Society for Transplantation and Cellular Therapy consists of Yasuyuki Arai, Kiyotoshi Imai, Yukiyasu Ozawa, Kazuhiko Kakihana, Shinichi Kako, Harumi Kato, Heiwa Kanamori, Takakazu Kawase, Junji Tanaka, Satoshi Nishiwaki, Shin Fujisawa, Tatsuo Furukawa, Shuichi Mizuta, Hisashi Yamamoto, Satoshi Yoshihara, Koji Nagafuji, Nobuo Masauzi, Akio Shigematsu, Kenjiro Mitsuhashi, Jun Aoki, Takayoshi Tachibana, Akihito Shinohara, Hiroaki Shimizu, Tomotaka Ugai, Shigeki Hirabayashi, Kenji Motohashi, Tadakazu Kondo, Yu Akahoshi, Yuho Najima, Kaito Harada, Satoshi Kaito, Kosei Kageyama, Shuhei Kurosawa, Yoshinobu Konishi, Shinichiro Oshima, Noriaki Tsuji, Emiko Sakaida, Mari Morita-Fujita, Akihito Nagata, Momoko Nakamura, Yasushi Onishi, Ryo Hanajiri, Atsushi Iwasaki, Marie Obiki, Tomoyasu Jo, Hiromi Hayashi, and Naoki Tamura.

