

Key Points
A reanalysis including donor age and using propensity score matching shows no major differences in survival or relapse.
Data sharing and collaborative reanalysis enhance our recognition of the nuances of complex statistical methodologies and published results.

Abstract
Blood or marrow transplantation (BMT) outcomes using haploidentical donors (Haplo) and posttransplant cyclophosphamide (PTCy)-based graft-versus-host disease (GVHD) prophylaxis compare favorably to HLA-matched donors using calcineurin inhibitor–based prophylaxis. A recent Center for International Blood and Marrow Transplant Research analysis of patients receiving homogenous PTCy-based prophylaxis found that, with reduced intensity conditioning, Haplo BMTs had worse outcomes than matched unrelated donor (MUD) BMTs. Due to significant differences between groups, we reanalyzed the dataset using propensity score matching and, additionally, added a donor age variable. After matching MUD BMTs to Haplo BMTs in a 1:5 ratio, no significant differences were found between groups across all measured baseline characteristics. Outcomes analyses demonstrated no significant differences in overall survival (hazard ratio [HR] of mortality with MUD vs Haplo [95% confidence interval], 0.95 [0.65-1.16], P = .75), disease-free survival (HR of relapse or death, 0.98 [0.73-1.18], P = .89), relapse rate (HR, 1.06 [0.77-1.38], P = .69), or nonrelapse mortality (NRM) (HR, 0.85 [0.42-1.13], P = .49) between groups. After stratification by conditioning intensity, MUD BMTs in the reduced-intensity cohort had lower risk of NRM (HR, 0.56 [0.14-0.99], P = .05), with no significant difference in other clinical outcomes. These results suggest the effect of HLA matching on BMT outcomes with PTCy is less meaningful than previously reported. Timely identification of a young, at least half-matched (related or unrelated) donor may be more important than finding a fully matched donor if the latter leads to a delay in BMT or use of an older donor.
Introduction
Allogeneic blood or marrow transplantation (BMT) is a potentially curative therapy for a variety of malignant and nonmalignant hematologic conditions, but its use has historically been limited to patients for whom an HLA-matched related donor or HLA-matched unrelated donor (MUD) could be identified. The development of posttransplant cyclophosphamide (PTCy)-based graft-versus-host disease (GVHD) prophylaxis has allowed for the safe and effective use of related haploidentical (Haplo) donors,1-6 thereby expanding transplant eligibility and the donor pool. Subsequent prospective studies have shown that PTCy-based GVHD prophylaxis produces comparable outcomes to other GVHD prophylactic regimens in matched donors7,8 as well as mismatched unrelated donors,9 leading to its widespread adoption for all donor types.
However, the studies showing similar outcomes for Haplo BMT and matched donor BMTs were comparing PTCy for Haplo BMTs with calcineurin inhibitor–based GVHD prophylaxis for BMTs using matched donors. Although these studies demonstrate the effectiveness of PTCy in mitigating the adverse effect of HLA mismatching relative to other GVHD regimens, it remained unclear whether HLA mismatch exerts an adverse effect within a homogenous group of patients who all received PTCy-based prophylaxis. Accordingly, the Center for International Blood and Marrow Transplant Research (CIBMTR) examined this question by comparing outcomes between Haplo and MUD BMTs for patients with acute myeloid leukemia (AML), acute lymphoblastic leukemia (ALL), or myelodysplastic syndrome (MDS), using homogenous PTCy-based GVHD prophylaxis.10 This analysis found that Haplo BMTs were associated with a higher incidence of acute GVHD and worse nonrelapse mortality (NRM), disease-free survival (DFS), and overall survival (OS) compared with their MUD counterparts but only after stratification and comparison of patients that received reduced-intensity conditioning (RIC).10 Of note, there were no statistically significant differences among patients receiving myeloablative conditioning (MAC). The authors of the latter study concluded that, “These data extend and confirm the importance of donor-recipient HLA matching for allogeneic transplantation,” and that MUDs should be favored over Haplos, without restricting their conclusion to the RIC patients.
Retrospective analyses are susceptible to confounding (ie, the treatment groups might differ in terms of important confounding variables). Multivariable regression analyses are often used to correct for imbalances between cohorts, as was done in the CIBMTR analysis10 ; however, it is well recognized that standard multivariable regression adjustment may not be able to adequately control for significant imbalances between cohorts, particularly when there is substantial nonoverlap of confounders between treatment groups.11,12 Mismatch between treatment groups leads to greater reliance on extrapolation, and all of the assumptions that come with it, to generate an estimated treatment effect.13 In such situations, alternative approaches using propensity score matching or weighting may be more appropriate.14,15 Some of the baseline characteristic differences between the MUD and Haplo BMT groups likely stem from treatment selection bias. Ethnic and racial minorities are less likely to have an identifiable MUD,16 and recipient age, family structure, and family support may impact the availability of Haplos.13 Most importantly, the accuracy of any multivariable regression model depends upon appropriate variable selection for inclusion. The CIBMTR dataset did not include donor age, which can have a significant impact on BMT outcome.17-23
Herein, we present a reanalysis of the same CIBMTR dataset used to determine the impact of HLA matching on transplant outcomes on PTCy-based GVHD prophylaxis, considering the separate effect of donor age and using propensity score matching and weighting methods to correct for the imbalances between cohorts.
Methods
Patients
The dataset was provided by the CIBMTR for their analysis of MUDs vs Haplo BMTs receiving PTCy, which posts datasets from its published analyses on its public website.10 Donor age was not considered in the published CIBMTR analyses, but the variable was added to the dataset for this analysis, at the authors’ request, by the CIBMTR. Patient recruitment and data collection were described in the original manuscript.10 Briefly, patients included in the cohort were transplanted at one of 111 US-based transplant centers between 2011 and 2018. For inclusion, patients had to be 18 years of age or older with AML, ALL, or MDS in first or second remission. All patients received GVHD prophylaxis consisting of PTCy, a calcineurin inhibitor, and mycophenolate mofetil. Haplo donors were defined as those who were related and mismatched at ≥2 HLA loci, and MUDs were unrelated and matched at the allele level at HLA-A, -B, -C, and -DRB1. Patients provided written informed consent, and the Institutional Review Board of the National Marrow Donor Program approved the study.
Outcomes
Outcome definitions were the same as those delineated by Gooptu et al.10 The primary outcome was OS, and additional outcomes studied included DFS, GVHD, NRM, relapse, grade 3 to 4 acute GVHD, and chronic GVHD.
Statistical analysis
Three cohorts were considered in our analyses: all patients (RIC plus MAC), RIC cohort alone, and MAC cohort alone. Owing to the substantial imbalance in characteristics between the MUD and Haplo BMTs, we assessed the treatment effects via propensity score–based methods. Propensity score analysis may overcome many of the issues associated with multivariable regression adjustment of highly imbalanced cohorts through pseudo-randomization.13,14,24 A propensity score estimates the probability of receiving a MUD (or Haplo) based upon patient and donor characteristics and thus can be used as a balancing metric. Matching patients using propensity scores mimics randomization (with respect to the measured characteristics) by excluding patients unlikely to be assigned to the other donor group and thus have no suitable crossgroup comparator. Our goal was to estimate the average treatment effect for various outcomes.25
The propensity scores were calculated based on a machine learning algorithm called gradient boosting machine (GBM), which predicted the propensity (probability) of receiving a MUD graft as a function of patient and donor characteristics. GBM starts with a simple tree model and gradually increases its complexity by adding simple tree models to it, 1 at a time, until the additional gain in prediction is minimal compared with the increase in model complexity. We fitted GBM with 3000 trees, allowing 3-way interactions, and with a learning parameter 0.01 for each tree in the expansion.26,27 The boosting algorithm automatically selects the optimal number of GBM iterations to minimize the differences between the treatment and control groups as measured by stopping criteria that assess the covariate balance. The stopping rule is based on the balance metric of either the absolute standardized mean difference or the Kolmogorov-Smirnov statistic. The R package “twang” was used to estimate the propensity scores.27 Variables for estimating propensity scores included all 13 patient characteristics variables listed in Table 1 of the Gooptu et al manuscript.10 Additionally, we included donor age. Recipient’s age and donor age were treated as continuous. A small number of patients (7%) who had missing data in patient characteristics such as donor age, recipient CMV serostatus, and disease risk index were excluded in the propensity score estimation. For stratified analyses, we estimated the propensity scores separately for RIC and MAC patients.
Patient and BMT characteristics by haploidentical and MUD BMT in the propensity-matched cohort
| Variables | Propensity score matching cohort in (RIC + MA) | P value | ||
|---|---|---|---|---|
| Matched (n = 837) | MUD (n = 200) | Haplo (n = 637) | ||
| Age at BMT | ||||
| Median (range) | 58 (18-80) | 60 (18-80) | 58 (19-78) | .07 |
| Race, n (%) | .41 | |||
| Caucasian | 742 (89) | 181 (91) | 561 (88) | |
| Other | 95 (11) | 19 (9) | 76 (12) | |
| Gender, n (%) | .86 | |||
| Female | 467 (56) | 110 (55) | 357 (56) | |
| Male | 370 (44) | 90 (45) | 280 (44) | |
| BMT Year, n (%) | .86 | |||
| 2011-2014 | 93 (11) | 21 (11) | 72 (11) | |
| 2015-2018 | 744 (89) | 179 (89) | 565 (89) | |
| Dx to BMT (month) | 10.15 (13.34) | 10.55 (16.22) | 10.02 (12.31) | .67 |
| Median (range) | 5.9 (1.45 165.16) | 5.92 (1.45 165.16) | 5.95 (1.61, 112.89) | .85 |
| Disease, n (%) | .71 | |||
| ALL | 201 (24) | 45 (22) | 156 (25) | |
| AML | 455 (54) | 108 (54) | 347 (54) | |
| MDS | 181 (22) | 47 (24) | 134 (21) | |
| Condition, n (%) | .44 | |||
| RIC | 455 (54) | 114 (57) | 341 (54) | |
| MAC | 382 (46) | 86 (43) | 296 (46) | |
| TBI, n (%) | .07 | |||
| No | 329 (39) | 90 (45) | 239 (38) | |
| Yes | 508 (61) | 110 (55) | 398 (62) | |
| Transplant source, n (%) | .84 | |||
| BM | 140 (17) | 32 (16) | 108 (17) | |
| PB | 697 (83) | 168 (84) | 529 (83) | |
| HCT, n (%) | .68 | |||
| ≤2 | 385 (46) | 89 (44.5) | 296 (47) | |
| ≥3 | 452 (54) | 111 (55.5) | 341 (53) | |
| KPS, n (%) | .73 | |||
| <90 | 504 (60) | 123 (62) | 381 (60) | |
| 90-100 | 333 (40) | 77 (38) | 256 (40) | |
| DRI, n (%) | .54 | |||
| Low/intermediate | 692 (83) | 162 (81) | 530 (83) | |
| High/very high | 145 (17) | 38 (19) | 107 (17) | |
| Recip. CMV, n (%) | .32 | |||
| Negative | 300 (36) | 78 (39) | 222 (35) | |
| Positive | 537 (64) | 122 (61) | 415 (65) | |
| Donor age | ||||
| Median (range) | 30 (13-71) | 29 (19-60) | 30 (13-71) | .84 |
CMV, cytomegalovirus; Dx, diagnosis; BM, bone marrow; PB, peripheral blood; HCT, recipient Sorror comorbidity score; Recip. CMV, recipient CMV serostatus.
After estimating the propensity score, we estimated the average treatment effect using 2 different methods: matching and inverse probability of treatment weighting (IPTW). The matching cohorts were constructed by matching each MUD recipient to the 5 nearest Haplo recipients, where proximity was defined to be propensity score value within one-fourth of the standard deviation (SD) of the estimated propensity scores. For sensitivity analysis, we varied the matching distance from 1/4*SD to 3*SD while ensuring balance across all patient characteristics between MUD and Haplo BMT groups.28 Results based on the largest matching cohorts were presented. The balance diagnostics were based on Wilcoxon test, or χ2 or Fisher’s exact test across all characteristics, as appropriate. In the IPTW analysis, each patient is given a weight equal to the reciprocal of the probability of receiving the treatment that they actually got. If the receipt of MUD was independent of any patient characteristics, the weight for each MUD recipient would simply be the reciprocal of the overall proportion of MUD recipients, and similarly, the weight for each Haplo recipient would simply be the reciprocal of the overall proportion of Haplo recipients. Here, weighting would balance the skewed numbers of MUD and Haplo BMT groups. If, on the other hand, the receipt of MUD were dependent on patient characteristics, say, for example, that men are twice as likely as women to receive MUD, each man in the MUD group would receive a weight of 1.5 (which is the reciprocal of two-thirds, their probability of receiving MUD), and each woman would receive a weight of 3.0. Here, weighting would not only balance the skewed numbers but will also completely equalize the 2 groups in terms of measured confounders. The IPTW can yield a more precise treatment effect estimate than the matching analysis because it makes use of the entire cohort, unlike matching, which discards unmatched patients. For IPTW, balance was assessed via the mean of the Kolmogorov-Smirnov statistic,29 and the weights for IPTW were trimmed at the 99th percentile.
Cox proportional hazard for mortality (complement of OS) and treatment failure (complement of DFS) and cause-specific hazard models for relapse and NRM were fitted using both matching (accounting for clustering) and IPTW methods. Confidence intervals with P values based on t statistics were reported using 1000 bootstrap resamples. Statistical significance was set at P < .05, and all P values were 2 sided. The statistical software R 4.1.0 was used throughout the analyses.
Results
Patient, disease, and BMT characteristics
Baseline patient, disease, and BMT characteristics for the overall cohort were previously published.10 Table 1 shows baseline characteristics for the Haplo and MUD BMT groups after exclusion of patients lacking matched counterparts. This propensity score–matched cohort includes 637 Haplo and 200 MUD BMTs, compared with 2036 and 284, respectively, in the original publication. Supplemental Figure 1A (raw) shows the distributions of donor age between the 2 cohorts before matching. Although donor age was widely distributed in the Haplo-BMT group over the range of 20 to 70 years, the majority of donors in the MUD BMT cohort were in the younger age group of 20 to 40 years. Supplemental Figure 1B (matched) depicts the impact of propensity score matching on donor age distribution between MUD and Haplo BMT cohorts. The distribution of other patient, disease, and BMT characteristics with propensity score matching in this study is shown in Figure 1A-C.
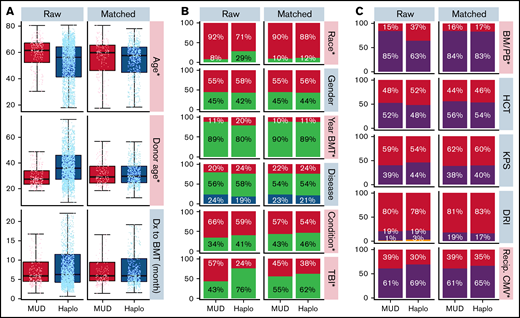
Distribution of patient, disease, and BMT-related characteristics before and after propensity score matching. (A) Box plots demonstrate the distribution of age, donor age, and time from diagnosis to BMT by donor type before (left) and after (right) propensity score matching. Age and donor age, marked by an asterisk and pink shading, were significantly different between the 2 groups before propensity score matching but not afterward. (B-C) Bar graphs demonstrate the frequency of other covariables by donor type before (left) and after (right) propensity score matching. Race, year of BMT, and conditioning covariables marked with an asterisk and colored pink were significantly different between the Haplo and MUD groups before propensity score matching. There were no significant differences between the Haplo and MUD groups for any of the covariables after propensity score matching. BM/PB, bone marrow/peripheral blood; Condition, conditioning; DRI, disease risk index; Dx, diagnosis; HCT, recipient's Hematopoietic Cell Transplantation-specific Comorbidity Index; KPS, Karnofsky performance score; Recip. CMV, recipient's CMV status; TBI, total body irradiation.
Distribution of patient, disease, and BMT-related characteristics before and after propensity score matching. (A) Box plots demonstrate the distribution of age, donor age, and time from diagnosis to BMT by donor type before (left) and after (right) propensity score matching. Age and donor age, marked by an asterisk and pink shading, were significantly different between the 2 groups before propensity score matching but not afterward. (B-C) Bar graphs demonstrate the frequency of other covariables by donor type before (left) and after (right) propensity score matching. Race, year of BMT, and conditioning covariables marked with an asterisk and colored pink were significantly different between the Haplo and MUD groups before propensity score matching. There were no significant differences between the Haplo and MUD groups for any of the covariables after propensity score matching. BM/PB, bone marrow/peripheral blood; Condition, conditioning; DRI, disease risk index; Dx, diagnosis; HCT, recipient's Hematopoietic Cell Transplantation-specific Comorbidity Index; KPS, Karnofsky performance score; Recip. CMV, recipient's CMV status; TBI, total body irradiation.
Prior to propensity score matching (raw), the Haplo BMT group was significantly younger (median 56 years vs 62 years, P < .001), had a lower proportion of Caucasians (71% vs 92%, P < .001), was more likely to have undergone transplant between 2011-2014 (20% vs 11%, P < .001), was less likely to have received RIC (59% vs 66%, P = .047), was less likely to have received TBI (24% vs 57%, P < .001), was more likely to have received a bone marrow source (37% vs 15%, P < .001), was less likely to have negative CMV serologies (30% vs 39%, P = .010), and had older donors (median, 36 years vs 28 years, P < .001) than the MUD BMT group (Figure 1). At baseline, there were no significant differences between groups in the time from diagnosis to BMT, gender, disease, Hematopoietic Cell Transplantation-specific Comorbidity Index (HCT-CI), KPS, or DRI. After propensity score matching, there were no significant differences in any of the measured baseline characteristics between the 2 groups (Figure 1A-C; Table 1).
The effect of donor choice on outcomes: matching and IPTW analyses
Kaplan-Meier and cumulative incidence curves for clinical outcomes for the overall matched cohort by donor type are shown in Figure 2. As shown in Table 2, there were no statistically significant differences in OS (hazard ratio [HR] of mortality with MUD vs Haplo [95% CI], 0.95 [0.65-1.16], P = .75), DFS (HR of relapse or death, 0.98 [0.73-1.18], P = .89), NRM (HR, 0.85 [0.42-1.13], P = .49), or relapse (HR, 1.06 [0.77-1.38], P = .69). Although relatively low in both groups, there were significant differences in grade 3 to 4 acute GVHD (HR, 0.47 [0.16-0.85], P = .02) and in chronic GVHD (HR, 0.65 [0.48-0.92], P = .02) favoring MUD (Figure 2). As described in “Methods,” we also evaluated the average effect of donor choice on the outcomes using a different propensity-based method, the IPTW. An advantage of this is that there is no need to exclude any MUD/Haplo recipient for whom a good match from the other group cannot be found. Instead, patients are given weights. For example, if a MUD recipient looks more like a typical Haplo recipient than like a typical MUD recipient, they will receive a relatively large weight, and vice versa. The IPTW analysis (Table 2) did not show any statistically significant differences between MUD and Haplo BMTs in OS (weighted HR of mortality, 0.83 [0.64-1.05], P = .07), DFS (weighted HR of relapse or death, 0.87 [0.71-1.06], P = .11), relapse (weighed HR, 0.92 [0.72-1.16], P = .39), or NRM (weighted HR, 0.78 [0.48-1.09], P = .13). Like the matched analysis, the IPTW also showed significant differences in grade 3 4 acute GVHD (weighted HR, 0.34 [0.15-0.60], P = .001) and in chronic GVHD (weighted HR, 0.72 [0.51-0.92], P = .008) favoring MUD BMT.
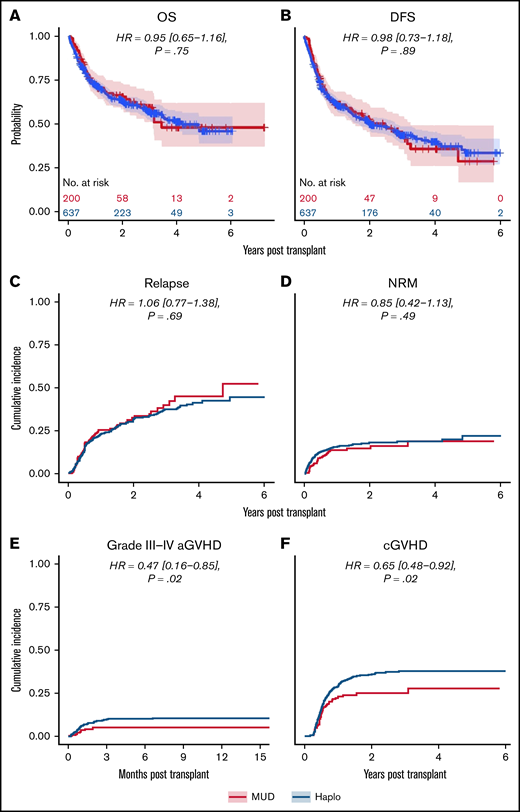
Outcomes for propensity-matched patients by haploidentical donor vs MUD. Data are for the whole cohort, including patients that received reduced-intensity and myeloablative conditioning. The HR for MUDs compared with Haplos: (A) OS was 0.95 (95% CI, 0.65-1.16), (B) DFS was 0.98 (95% CI, 0.73-1.18), (C) relapse was 1.06 (95% CI, 0.77-1.38), (D) NRM was 0.85 (95% CI, 0.42-1.13), (E) grade 3 to 4 aGVHD was 0.47 (95% CI, 0.16-0.85), and (F) cGVHD was 0.65 (95% CI, 0.48-0.92). aGVHD, acute graft-versus-host disease; BM/PB, bone marrow/peripheral blood; cGVHD, chronic graft-versus-host disease; Condition, conditioning; HCT, recipient Sorror comorbidity score; Recip. CMV, recipient CMV status.
Outcomes for propensity-matched patients by haploidentical donor vs MUD. Data are for the whole cohort, including patients that received reduced-intensity and myeloablative conditioning. The HR for MUDs compared with Haplos: (A) OS was 0.95 (95% CI, 0.65-1.16), (B) DFS was 0.98 (95% CI, 0.73-1.18), (C) relapse was 1.06 (95% CI, 0.77-1.38), (D) NRM was 0.85 (95% CI, 0.42-1.13), (E) grade 3 to 4 aGVHD was 0.47 (95% CI, 0.16-0.85), and (F) cGVHD was 0.65 (95% CI, 0.48-0.92). aGVHD, acute graft-versus-host disease; BM/PB, bone marrow/peripheral blood; cGVHD, chronic graft-versus-host disease; Condition, conditioning; HCT, recipient Sorror comorbidity score; Recip. CMV, recipient CMV status.
Summary table showing estimates by propensity-matching approach
| Overall | Estimate RIC | Estimate MAC | |
|---|---|---|---|
| OS | |||
| Matched cohort OS: HR (95% CI), P | 0.95 (0.65-1.16), P = .75 | 0.82 (0.54-1.26), P = .32 | 0.99 (0.59-1.48), P = .32 |
| IPTW OS: wtHR (95% CI), P | 0.83 (0.64-1.05), P = .07 | 0.79 (0.58-1.04), P = .07 | 1.01 (0.61-1.47), P = .95 |
| DFS | |||
| Matched cohort DFS: HR (95% CI), P | 0.98 (0.73-1.18), P = .89 | 0.88 (0.59-1.23), P = .43 | 1.10 (0.74-1.60), P = .66 |
| IPTW DFS: wtHR (95% CI), P | 0.87 (0.71-1.06), P = .11 | 0.84 (0.63-1.05), P = .09 | 1.12 (0.76-1.53), P = .41 |
| Relapse | |||
| Matched cohort relapse: HR (95% CI), P | 1.06 (0.77-1.38), P = .69 | 1.03 (0.69-1.58), P = .90 | 1.12 (0.68-1.85), P = .70 |
| IPTW relapse: wtHR (95% CI), P | 0.92 (0.72-1.16), P = .39 | 0.94 (0.70-1.23), P = .60 | 1.04 (0.65-1.57), P = .81 |
| NRM | |||
| Matched cohort NRM: HR (95% CI), P | 0.85 (0.42-1.13), P = .49 | 0.56 (0.14-0.99), P = .048 | 1.07 (0.52-1.82), P = .80 |
| IPTW NRM wtHR (95% CI), P | 0.78 (0.48-1.09), P = .13 | 0.56 (0.26-0.84), P = .04 | 1.22 (0.59-1.95), P = .39 |
| Acute grade 3-4 GVHD | |||
| Matched cohort aGVHD grade 3-4: HR (95% CI), P | 0.47 (0.16-0.85), P = .02 | 0.62 (0-1.08), P = .47 | 0.63 (0.10-1.20), P = .40 |
| IPTW aGVHD grade 3-4: wtHR (95% CI), P | 0.34 (0.15-0.60), P = .001 | 0.41 (0.12-0.73), P = .02 | 0.32 (0.06-0.62), P = .02 |
| Chronic GVHD | |||
| Matched cohort cGVHD: HR (95% CI), P | 0.65 (0.48-0.92), P = .02 | 0.65 (0.34-1.14), P = .08 | 0.66 (0.43-1.08), P = .10 |
| IPTW cGVHD: wtHR (95% CI), P | 0.72 (0.51-0.92), P = .008 | 0.79 (0.5-1.09), P = .16 | 0.52 (0.35-0.84), P = .002 |
(wt)HR, (weighted)hazard ratio; CI, confidence interval.
The effect of donor choice on outcomes stratified by conditioning regimen intensity
We next analyzed the dataset for differences in clinical outcomes stratified by intensity of conditioning regimen (ie, RIC or MAC, as done in the original analysis by Gooptu et al).10 Propensity score matching resulted in a RIC cohort of 371 patients, of whom 278 received a Haplo graft and 93 received a MUD graft. Baseline characteristics of these patients are tabulated in supplemental Table 1. As shown in Table 2, there were no statistically significant differences between the 2 groups matched by propensity scoring in OS (HR of mortality, 0.82 [0.54-1.26], P = .32), DFS (HR of relapse or death, 0.88 [0.59-1.23], P = .43), or relapse rate (HR, 1.03 [0.69-1.58], P = .90) (Figure 3). Grade 3 to 4 acute GVHD (HR, 0.62 [0-1.08], P = .47) and chronic GVHD (HR, 0.65 [0.34-1.14], P = .08) were also not significantly different (Figure 3). There was a significantly decreased risk of NRM with MUDs (HR, 0.56 [0.14-0.99], P = .048). A similar propensity-matching analysis was performed among the 492 (Haplo, 406; MUD, 86) patients who received MAC conditioning (supplemental Table 2). As shown in Figure 4, no statistically significant differences were noted in clinical outcomes of OS (HR, 0.99 [0.59-1.48], P = .32), DFS (HR, 1.10 [0.74-1.60], P = .66), NRM (HR, 1.07 [0.52-1.82], P = .80), relapse rate (HR, 1.12 [0.68-1.85], P = .70), grade 3 to 4 acute GVHD (HR, 0.63 [0.10-1.20], P = .40), or chronic GVHD (HR, 0.66 [0.43-1.08], P = .10). In the IPTW analysis within conditioning strata, there were no statistically significant differences in OS, DFS, or relapse for both the RIC and MA cohorts. The IPTW did show that MUDs had significantly less risk of NRM (weighted HR, 0.56 [0.26-0.84], P = .04) and acute grade 3 to 4 GVHD (weighted HR, 0.41 [0.12-0.73], P = .02) when compared with Haplo cohort in patients who received RIC (Table 2).
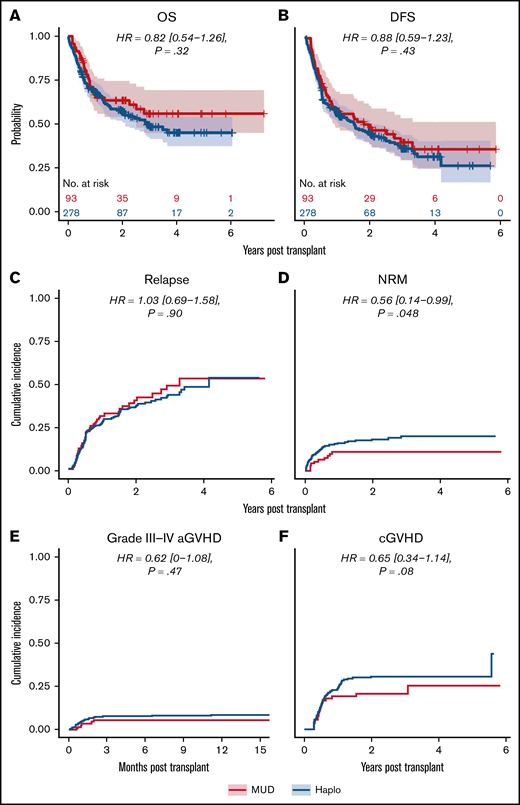
Outcomes for propensity-matched patients who received RIC. For patients that received RIC, the HR for MUDs compared with Haplos: (A) OS was 0.82 (95% CI, 0.54-1.26), (B) DFS was 0.88 (95% CI, 0.59-1.23), (C) relapse was 1.03 (95% CI, 0.69-1.58), (D) NRM was 0.56 (95% CI, 0.14-0.99), (E) grade 3 to 4 aGVHD was 0.62 (95% CI, 0.1-1.08), and (F) cGVHD was 0.65 (95% CI, 0.34-1.14). BM/PB, bone marrow/peripheral blood; Condition, conditioning; HCT, recipient Sorror comorbidity score; Recip. CMV, recipient CMV status.
Outcomes for propensity-matched patients who received RIC. For patients that received RIC, the HR for MUDs compared with Haplos: (A) OS was 0.82 (95% CI, 0.54-1.26), (B) DFS was 0.88 (95% CI, 0.59-1.23), (C) relapse was 1.03 (95% CI, 0.69-1.58), (D) NRM was 0.56 (95% CI, 0.14-0.99), (E) grade 3 to 4 aGVHD was 0.62 (95% CI, 0.1-1.08), and (F) cGVHD was 0.65 (95% CI, 0.34-1.14). BM/PB, bone marrow/peripheral blood; Condition, conditioning; HCT, recipient Sorror comorbidity score; Recip. CMV, recipient CMV status.
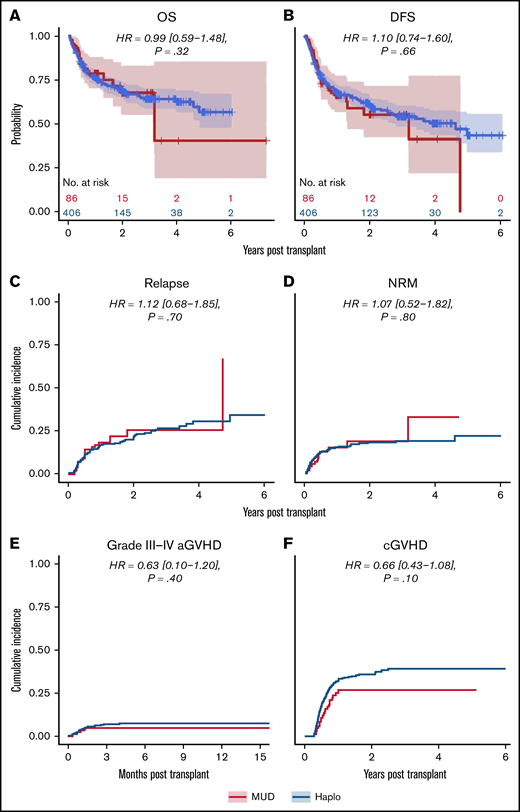
Outcomes for propensity-matched patients who received myeloablative conditioning. For patients that received myeloablative conditioning, the HR for MUDs compared with Haplos: (A) OS was 0.99 (95% CI, 0.59-1.48), (B) DFS was 1.10 (95% CI, 0.74-1.60), (C) relapse was 1.12 (95% CI, 0.68-1.85), (D) NRM was 1.07 (95% CI, 0.52-1.82), (E) grade 3 to 4 aGVHD was 0.63 (95% CI, 0.10-1.20), and (F) cGVHD was 0.66 (95% CI, 0.43-1.08). BM/PB, bone marrow/peripheral blood; Condition, conditioning; HCT, recipient Sorror comorbidity score; Recip. CMV, recipient CMV status.
Outcomes for propensity-matched patients who received myeloablative conditioning. For patients that received myeloablative conditioning, the HR for MUDs compared with Haplos: (A) OS was 0.99 (95% CI, 0.59-1.48), (B) DFS was 1.10 (95% CI, 0.74-1.60), (C) relapse was 1.12 (95% CI, 0.68-1.85), (D) NRM was 1.07 (95% CI, 0.52-1.82), (E) grade 3 to 4 aGVHD was 0.63 (95% CI, 0.10-1.20), and (F) cGVHD was 0.66 (95% CI, 0.43-1.08). BM/PB, bone marrow/peripheral blood; Condition, conditioning; HCT, recipient Sorror comorbidity score; Recip. CMV, recipient CMV status.
Discussion
The reanalysis of the CIBMTR dataset analyzed by Gooptu et al10 using propensity score matching and considering the effect of donor age did not show a significant treatment effect of donor type on OS, DFS, relapse, or NRM when analyzed as 1 cohort. This remained true within strata, with the exception of NRM within the RIC group, which favored MUDs. For the overall matched cohort, there were significantly higher cumulative incidences of grade 3 to 4 acute and chronic GVHD in the Haplo group compared with the MUD group. These differences were not statistically significant when analyzed within individual conditioning strata, though the HRs were similar. Overall, these results indicate that the effect of donor type per se suggested in the prior analysis, although not negligible, may have been influenced substantially by donor age and much less so by HLA matching.
Registries like the CIBMTR and the European Society for Blood and Marrow Transplantation (EBMT) have been powerful tools in the enormous progress that has occurred in the field of BMT over the last several decades. Their ability to collect essentially all the data on BMT in the United States and Europe have allowed for large retrospective analyses that play an important role in our understanding of BMT. In addition to our analysis and the original CIBMTR analysis, there are 3 other retrospective registry-based studies that examined the impact of HLA matching on BMT outcomes in patients receiving PTCy-based prophylaxis with differing conclusions. In a study of PTCy-treated BMT patients with lymphoma from the CIBMTR and EBMT registries, MUD recipients had reduced risk for aGVHD, cGVHD, and NRM and improved PFS and OS compared with Haplo recipients.30 The methods used in this study were the same as those used in Gooptu et al’s analysis, but it differed in that donor age was included as a covariate in this study. Two other studies of patients in the EBMT registry also used multivariable regression analysis to examine this question in patients with ALL and AML. In patients with ALL, there were no differences in outcomes between Haplo, matched related donor, and MUD recipients.31 In AML, Haplo recipients had higher rates of acute grade 3 to 4 GVHD and NRM but lower risk of relapse and no differences in DFS or OS.32
In order to leverage the power of these data registries, we need rigorous statistical methods for evaluating treatment effects. Multivariable outcome models are most commonly used to account for confounding in retrospective statistical analyses. However, they can be problematic when applied to treatment groups that are highly unbalanced for important confounding variables, as already discussed in “Introduction.”13 Not only are the Haplo and MUD BMT cohorts from the Gooptu et al analysis markedly skewed in size (284 MUDs and 2036 Haplos), but there were major imbalances in many of the confounding variables that are known to influence transplant outcomes, including age, race, era of BMT, type of disease, conditioning regimens, graft type, CMV serologies, and donor age.10 The imbalances between the groups are so large that there is inclusion of subpopulations with distinct characteristics within 1 group that simply have no counterpart for comparison (Figure 1; supplemental Figure 1). For example, MUD BMTs were more recent because the adoption of PTCy in the Haplo setting preceded its use in MUD transplants, so there were very few early BMTs in the MUD cohort. Additionally, the selection of which variables to consider in the analysis can have important effects on outcomes and conclusions. Donor age was not included as a variable in the CIBMTR study because it was felt that it reflected the real-world practices in selecting MUD and Haplo donors, where selection of MUDs focuses on younger donors, with >80% of MUDs under the age of 35 years. Donor age has not been as emphasized in selection of Haplo donors, as evidenced by high proportion of Haplo donors over the age of 60 in the Gooptu study. However, just as data on young MUDs changed practice and improved outcomes,20 the same is now happening with Haplo BMTs based on similar data on donor age.23 Because second- and third-degree Haplo relatives produce similar outcomes to first degree relatives,33 most patients have an available, young related donor (child, niece, nephew, grandchild).23
Propensity score–based methods have several advantages over outcome regression models.12,13,34 The treatment effect estimate is less sensitive to using an incorrect propensity score model when compared with the impact of using an incorrect outcome regression model. We used a powerful machine learning approach to estimate the propensity score, which diminished the possibility of an incorrect propensity score model. Propensity score–based approaches are not susceptible to extrapolation because they either exclude or down-weight outlying patients whose baseline characteristics make them unlikely to have received the alternative donor (ie, Haplo vs MUD).35 As demonstrated in Figure 2, this produces 2 groups that are far more similar, allowing for better isolation of the effect of HLA matching on outcomes. A potential drawback to the propensity score–based approach is increased variance of the treatment effect estimate due to a reduction in effective sample size (ie, reduced statistical power). If the outcome model is correct, the multivariable regression approach will have greater power to detect difference in outcomes. But the outcome regression model is more likely to yield a biased treatment effect. The IPTW analysis can help overcome issues with power associated with propensity score matching because it makes use of the entire cohort, unlike matching. However, there is still the possibility of increased variance due to extreme (very large or very small) weights. In our case, the weights were trimmed at the 99th percentile (the maximum weight was around 12 in IPTW analysis). In this analysis, there was still no statistically significant difference in OS between MUD and Haplo BMTs (weighted HR of mortality with MUD vs Haplo, 0.83; 95% CI, 0.64-1.05), supporting the results attained by matching. Another limitation of the propensity score approach, one that is also shared by the multivariable regression, is that it cannot remove the bias due to unmeasured confounders. This problem cannot be solved by any analytic strategy but only by randomizing the treatment assignment.
The CIBMTR should be commended for allowing easy access to its dataset. The ability to explore alternative approaches to analyzing large, robust datasets is critical to advancing the field. If different tools, used properly, provide different answers, then this either warrants further scrutiny or points to inherent uncertainty in answering the question.
Not only have different statistical methodologies on the same dataset provided different conclusions regarding the importance of HLA matching with using PTCy, but analyses of different datasets also came to different conclusions.10,30-32 Moreover, even the analysis by Gooptu et al showed better outcomes with MUDs only with RIC.10 Taken together, these data suggest that the effect of HLA matching on BMT outcomes with PTCy should be only 1 factor among several in clinical decision making. Placing too much emphasis on HLA matching may lead to the disregard of other important considerations such as donor age and timing of transplant, which, in the setting of PTCy, may have more profound impacts on BMT outcomes. Recent data suggest that use of HLA-mismatched unrelated donors using the PTCy platform is also an effective approach.9,36,37 Thus, the timely identification of young,20,23,38,39 at least half-matched (related or unrelated), donors is increasingly possible and may be more important than finding matched donors, especially if the search leads to substantial BMT delays or use of an older donor. Moving forward, the availability of potential donors that produce similar outcomes may even allow the selection of personalized donors based on other factors that may limit relapse (eg, specific HLAs) or disease predispositions.40
Acknowledgments
This work was supported by National Institutes of Health (NIH) National Cancer Institute (NCI) grants P01 CA225618 and P30 CA006973. The Center for International Blood and Marrow Transplant Research (CIBMTR) is supported primarily by Public Health Service U24CA076518 from the National Cancer Institute (NCI), the National Heart, Lung, and Blood Institute (NHLBI), and the National Institute of Allergy and Infectious Diseases (NIAID); HHSH250201700006C from the Health Resources and Services Administration (HRSA); and N00014-20-1-2832 and N00014-21-1-2954 from the Office of Naval Research. Support is also provided by Be the Match Foundation, the Medical College of Wisconsin, the National Marrow Donor Program, and from the following commercial entities: AbbVie; Actinium Pharmaceuticals, Inc.; Adaptive Biotechnologies Corporation; Adienne SA; Allogene; Allovir, Inc.; Amgen, Inc.; Anthem; Astellas Pharma US; Atara Biotherapeutics; bluebird bio, inc.; Bristol Myers Squibb Co.; CareDx Inc; CRISPR; CSL Behring; CytoSen Therapeutics, Inc.; Daiichi Sankyo Co., Ltd.; Eurofins Viracor; DBA Eurofins Transplant Diagnostics; Fate Therapeutics; Gamida-Cell, Ltd.; Gilead; GlaxoSmithKline; HistoGenetics; Incyte Corporation; Iovance; Janssen Research & Development, LLC; Janssen/Johnson & Johnson; Jasper Therapeutics; Jazz Pharmaceuticals, Inc.; Kadmon; Karius; Kiadis Pharma; Kite, a Gilead Company; Kyowa Kirin; Legend Biotech; Magenta Therapeutics; Mallinckrodt Pharmaceuticals; Medac GmbH; Medexus; Merck & Co.; Millennium; the Takeda Oncology Co.; Miltenyi Biotec, Inc.; MorphoSys; Novartis Pharmaceuticals Corporation; Omeros Corporation; OptumHealth; Orca Biosystems, Inc.; Ossium Health, Inc; Pfizer, Inc.; Pharmacyclics, LLC; Priothera; Sanofi Genzyme; Stemcyte; Takeda Pharmaceuticals; Talaris Therapeutics; Terumo Blood and Cell Technologies; TG Therapeutics; Tscan; Vertex; and Xenikos BV.
Authorship
Contribution: A.A., T.J., H.-L.T., M.M.H., R.J.J., and R.V. conceived the study; H.-L.T. and R.V. analyzed the data; and A.A., T.J., H.-L.T., M.M.H., R.J.J., and R.V. wrote the paper.
The views expressed in this article do not reflect the official policy or position of the National Institutes of Health, the Department of the Navy, the Department of Defense, Health Resources and Services Administration, or any other agency of the US Government.
Conflict-of-interest disclosure: T.J. has received institutional research support from CTI Biopharma, SyneosHealth, Incyte; consultancy with Targeted Healthcare Communications; and advisory board participation with Care Dx, Bristol Myers Squibb, Incyte, Abbvie, and CTI.
Correspondence: Alexander Ambinder, The Sidney Kimmel Comprehensive Cancer Center, 1650 Orleans Street, CRB1 Room 2M88, Baltimore, MD 21287; e-mail: aambind1@jhmi.edu.

