

Key Points
No variants were associated with anti-PF4/heparin antibody levels at a genome-wide significance level in European ancestry individuals.
Our data suggest that genetic variants are not primary drivers of anti-PF4/heparin antibody levels in patients suspected of HIT.

Abstract
Heparin, a widely used anticoagulant, carries the risk of an antibody-mediated adverse drug reaction, heparin-induced thrombocytopenia (HIT). A subset of heparin-treated patients produces detectable levels of antibodies against complexes of heparin bound to circulating platelet factor 4 (PF4). Using a genome-wide association study (GWAS) approach, we aimed to identify genetic variants associated with anti-PF4/heparin antibodies that account for the variable antibody response seen in HIT. We performed a GWAS on anti-PF4/heparin antibody levels determined via polyclonal enzyme-linked immunosorbent assays. Our discovery cohort (n = 4237) and replication cohort (n = 807) constituted patients with European ancestry and clinical suspicion of HIT, with cases confirmed via functional assay. Genome-wide significance was considered at α = 5 × 10⁻⁸. No variants were significantly associated with anti-PF4/heparin antibody levels in the discovery cohort at a genome-wide significant level. Secondary GWAS analyses included the identification of variants with suggestive associations in the discovery cohort (α = 1 × 10⁻⁴). The top variant in both cohorts was rs1555175145 (discovery β = −0.112 [0.018], P = 2.50 × 10⁻⁵; replication β = −0.104 [0.051], P = .041). In gene set enrichment analysis, 3 gene sets reached false discovery rate-adjusted significance (q < 0.05) in both discovery and replication cohorts: “Leukocyte Transendothelial Migration,” “Innate Immune Response,” and “Lyase Activity.” Our results indicate that genomic variation is not significantly associated with anti-PF4/heparin antibody levels. Given our power to identify variants with moderate frequencies and effect sizes, this evidence suggests genetic variation is not a primary driver of variable antibody response in heparin-treated patients with European ancestry.
Introduction
The favorable pharmacological properties of heparin have kept it a first-line anticoagulant for a number of indications. Heparin is prescribed in numerous clinical settings, including acute coronary syndromes, occlusive disease, dialysis, cardiac surgeries, and atrial fibrillation, among others.1,2 Despite its common use, heparin carries the risk for heparin-induced thrombocytopenia (HIT), a limb- and life-threatening antibody-mediated adverse drug reaction. HIT develops in up to 2.4% of patients receiving heparin, and the mortality rate of HIT patients can reach as high as 30%.3,4 The inability to predict HIT before the manifestation of symptoms poses a serious risk in heparin therapy. Heparin treatment is further complicated by the complex pathogenesis of the antibody response.
HIT pathogenesis is initiated when heparin, complexed with endogenous platelet factor 4 (PF4), exposes a neoepitope. This neoepitope is recognized by immunoglobulin G (IgG) antibodies that engage with platelets, leading to platelet activation and thrombocytopenia.5-8 Detectable levels of anti-PF4/heparin antibodies are observed in 8% to 50% of heparin-treated patients,9 and of those antibody-positive patients, only a small subset go on to develop full-blown HIT.10 Studies have identified that higher titers of anti-PF4/heparin IgG antibodies increase the risk of HIT, however higher antibody levels are not deterministic, and patients with lower titers can still develop HIT.11,12 In vitro studies have shown differences in the binding affinity of antibodies toward PF4/heparin complexes, but the clinical significance of nonpathogenic anti-PF4/heparin vs pathogenic anti-PF4/heparin IgG antibodies is still not fully understood.13 Studies have suggested differential binding affinities may be due to differences in antibody sequence structure within the antigen recognition site or antibody heterogeneity among patients,13,14 suggesting genetic variation may influence the anti-PF4/heparin IgG antibody response.
This disparate antibody response among patients presents challenges in the prediction and prevention of HIT. Studies have identified risk factors for HIT, such as female sex, clinical setting,15 and more recently, a genome-wide association study (GWAS) identified the O blood type as a risk factor for HIT.16 Using the serotonin release assay (SRA) and heparin-induced platelet aggregation (HIPA) assay for HIT determination, the GWAS investigated genomic polymorphisms that associated with platelet reactivity in HIPA and SRA functional assays among suspected HIT patients. However, this study did not interrogate associations of single nucleotide polymorphisms (SNPs) and anti-PF4/heparin antibody response. As antibodies are a necessary precursor for HIT to occur, potential influences on the antibody response could be valuable predictors for identifying patients at risk for HIT progression. Due to the lack of known genomic associations with anti-PF4/heparin antibody response, we conducted a GWAS in suspected HIT patients with laboratory testing for anti-PF4/heparin antibodies to identify genomic variants associated with antibody production. Associations were tested for replication in an independent, prospectively collected cohort of heparin-treated patients with anti-PF4/heparin antibody quantification.
Methods
Study populations
Discovery cohort.
An observational patient cohort was accrued from a central laboratory at Greifswald University (Greifswald, Germany). The Greifswald University central testing facility is used for HIT assessment across multiple institutions. Briefly, the central laboratory performs a polyclonal enzyme-linked immunosorbent assay (ELISA) for quantification of anti-PF4/heparin antibody levels and HIPA assay for HIT confirmation. These assays allowed for the division of the cohort into 3 distinct groups: (1) individuals with both negative anti-PF4/heparin antibody and negative HIPA assay results; (2) antibody-positive patients with a negative HIPA assay; and (3) antibody-positive patients with positive HIPA assay results. Samples were completely deidentified before genotyping, and as such only anti-PF4/heparin antibody optical density (OD) levels, HIPA test results, and basic demographic data such as age and sex were available. This research received ethical approval from the institutional ethics committee at Greifswald University and was conducted in accordance with the Declaration of Helsinki.
Replication cohort.
Two previously described cohorts prospectively recruited from the University of Tours (Tours, France) comprised the replication cohort.17,18 In the replication cohort, anti-PF4/heparin antibody OD levels were determined via polyclonal ELISA and HIT status by serotonin release assay (SRA). HIPA and SRA are both washed platelet assays and equivalent tests for diagnosing HIT.19 The replication cohort was divided into 3 groups in the same manner described above in the discovery cohort. All anti-PF4/heparin antibody controls (OD < 0.5) underwent cardiopulmonary bypass (CPB). Clinical data, including age, sex, platelet count before and after heparin treatment, type of heparin administered (unfractionated vs low molecular weight), and CPB surgery status, were available for analysis. This research received ethical approval from the University of Tours ethics committee and the Ministry of Research. Additional information on both the discovery and replication cohorts is provided in the supplemental Material.
Genotyping, quality control, and imputation
GWAS genotyping was performed at the Riken Laboratory for Genotyping Development Center for Integrative Medical Sciences. All samples in the discovery and replication cohorts were genotyped using the Illumina Infinium HumanOmniExpressExome BeadChip. Quality control (QC) was performed in R20 (www.R-project.org) using the PlinkQC package.21,22 Preimputation QC of individuals included cutoffs for genotyping rate, heterozygosity rates, and sex mismatch. Preimputation marker QC measures included Hardy-Weinberg equilibrium (HWE) cutoff, a variant missingness rate threshold, and a minor allele frequency (MAF) cutoff. Imputation was performed using Minimac23,24 version 4 with reference haplotype data from the 1000 genomes project (V3).25 Details on the imputation and phasing process are provided in the supplement. During GWAS analyses, more stringent cutoffs were implemented, including a MAF threshold of 0.01, genotyping rate cutoff of 0.01, and the removal of variants out of HWE (P < .001). Identification of related samples through identity by descent was also performed, and 1 individual of any pair showing relatedness closer than second cousins was removed.
Analysis and adjustment for ancestry
The PlinkQC ancestry pipeline was implemented for principal components analysis (PCA). In brief, genotyped SNPs were pruned for high-quality variants before PCA. The PCA analysis revealed the overwhelming majority of patients in both cohorts were of European descent (supplemental Figures 1 and 2). Given the population structure of our cohorts, primary analyses were restricted to individuals of European ancestry. In our secondary analysis, to include all individuals, we fit mixed models using the GEMMA (Genome-wide Efficient Mixed Model Association) program.26,27 This step allowed for the assessment of associations seen in the primary analysis across a wider spectrum of individuals while accounting for sample relatedness.
Statistical analyses
A power calculation was performed before GWAS analysis to determine the capability of the study to detect an association between anti-PF4/heparin antibody levels and genetic variants. The genpwr package in R was used for the power calculations.28 Assuming an allele frequency of 0.05, power analysis indicated that we had 80% power in the discovery cohort to detect a variant that resulted in a mean difference in antibody titers (OD) of ≥0.23 between the group possessing the risk allele vs the group which does not. This difference assumes an additive model at 2-sided α = 5 × 10⁻⁸ using the population standard deviation of 0.78.
The primary GWAS analysis featured linear regression of anti-PF4/heparin antibody levels. Regression models were adjusted for age, sex, and principal components (PCs) 1 to 3. Using an additive model, P values, betas, and 95% confidence intervals were generated for each variant after adjustment for covariates. Statistically significant results were determined with a Bonferroni-corrected 2-sided α = 5 × 10⁻⁸. The equivalent analysis, including removal of related and non-European individuals and adjustment for age, sex, and PCs 1 to 3, was performed in our replication cohort. Replication of an association was considered statistically significant at α = 0.05 with directionally agreeing β. Results were input into SNPnexus for functional annotation and interpretation of the top variants.29 We performed a meta-analysis of primary results from our 2 cohorts using a random-effects model. Meta-analysis was weighted using standard errors of β, adjusted for age, sex, and PCs 1 to 3. A secondary analysis was also conducted on genome-wide suggestive signals (α = 1 × 10⁻⁴) with replication at α = 0.05.
In assessing the assumptions of a linear regression model, including linearity, independent samples, normality, and equal variance in the residuals, our data did not meet the assumption of normality in our outcome variable. To meet these assumptions, we normalized our data using various transformations and tested each transformation using the Shapiro-Wilk test to choose the best transformation. Normalized (ordered quantile normalization [ORQ]) anti-PF4/heparin antibody levels were then used as the continuous outcome variable in a linear regression model using the same approach as in the primary analysis, adjusting for age, sex, and the first 3 PCs. The ORQ normalization is a rank procedure that calculates all values to their percentiles and maps those to the percentile of a normal distribution. We then performed a GWAS on the subset of individuals classified as antibody-positive (OD > 0.5) using a linear model, adjusting for the same covariates as our primary analysis. In this model, we sought to test whether genomic variants are associated with OD levels among antibody-positive patients. Second, we dichotomized our continuous variable to perform a case/control logistic regression with cases defined as those with an antibody OD ≥ 0.5 and controls with an antibody OD < 0.5.
Gene set enrichment analysis (GSEA)
The output of the GWAS analysis was investigated using GSEA. Gene set analysis is a common secondary analysis tool used to probe the results of a GWAS in a broader biological scope. GSEA aggregates SNPs surrounding gene regions, then aggregates genes into sets of genes based on commonalities (eg, involvement in pathways, functional properties, or biological properties). These gene sets are then analyzed, and sets that are statistically associated may indicate pathways or properties that have an influence on the phenotype of interest. We used the i-GSEA4GWAS (Improved Gene Set Enrichment Analysis for Genome-wide Association Studies)30 version 231 to interrogate our GWAS results. Parameters for the program included assignment of SNPs within 20 kilobases of a gene, a minimum of 20 genes to constitute a gene set, inclusion of functional annotation data, inclusion of the major histocompatibility complex region for analysis, and log transformation of SNP P values. The linkage disequilibrium reference population was 1000 genomes Europe (EUR). Gene sets from databases including BioCarta pathways, Gene Ontology (GO) pathways, and Kyoto Encyclopedia of Genes and Genomes (KEGG) were surveyed as references.
Results
The replication cohort was, on average, slightly older (68.4 vs 66.6 years old), had fewer female participants (35.5% vs 39.8%), and possessed higher levels of anti-PF4/heparin antibodies across all groups (mean, 1.05 vs 0.78 OD). Furthermore, although not a focus of this study, fewer individuals in the replication cohort had confirmed HIT diagnosis via function assay results (23.4% vs 29.6%). Table 1 shows the demographic data for the discovery and replication cohorts.
Demographic and laboratory characteristics of discovery and replication cohorts included in genome-wide association study
| Characteristic | Discovery cohort | Replication cohort |
|---|---|---|
| Total (n) | 4927 | 834 |
| Age, y (mean [SD]) | 66.65 (13.64) | 68.39 (12.55) |
| Female (%) | 1952 (39.8) | 294 (35.5) |
| OD, mean (SD) | 0.78 (0.77) | 1.05 (1.00) |
| Functional assay (positive %) | 1426 (29.6) | 195 (23.4) |
Anti-PF4/heparin antibody OD values were determined using ELISA in both discovery and replication cohorts. Functional assays (positive %) are results of the heparin-induced platelet activation assay (discovery cohort) or serotonin release assay (replication cohort).
Primary analysis of PF4/heparin antibody signals
In our primary GWAS analysis, a total of 8 520 656 variants and 4237 individuals of European ancestry (supplemental Figure 1) were included in the discovery cohort. No variants reached genome-wide statistical significance for association with anti-PF4/heparin antibody levels (Figure 1A). The top signal in our analysis was the rs34434227 CA allele (β = 0.1531 [standard error, 0.0566], P = 1.20 × 10⁻⁷), located in chromosome 10. The nearest gene, XRCC6P1 (X-ray repair cross-complementing 6 pseudogene 1), is located approximately 6 KB away. The MAF (0.103) was higher than reported in 1000 genomes EUR or Trans-Omics for Precision Medicine (TOPMED)(0.07835 and 0.06997, respectively). Within a 50 KB range of the top signal, 7 variants reached a suggestive significance threshold (P < 1 × 10⁻⁴). In addition to our top signal, we observed a total of 951 variants that reached our suggestive threshold (1 × 10⁻⁴) across the entire genome. Quantile–quantile plots show no evidence of genomic inflation (λ = 1.01) (Figure 2A).
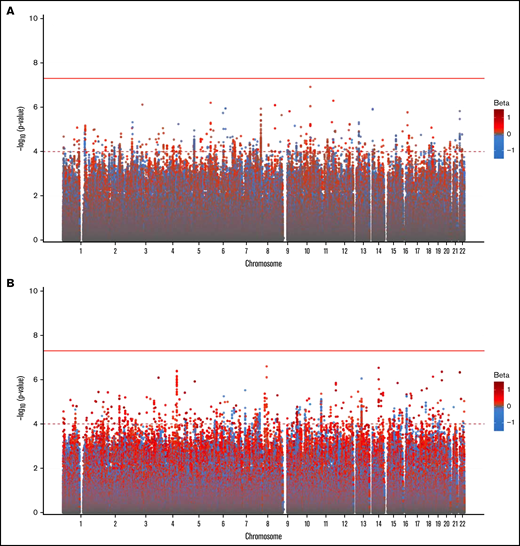
Genome-wide association of anti-PF4/heparin antibodies in the discovery cohort (A) and replication cohort (B).P values were generated using linear regression adjusted for sex, age, and PCs 1 to 3 in an additive model. P values on the −log10 scale are plotted on the left vertical axis, and the chromosomal position is plotted along the horizontal axis. The significance threshold of 5 × 10⁻⁸ is indicated by the solid red horizontal line, and the suggestive significance threshold of 1 × 10⁻⁴ is indicated by the dashed red line. Betas are indicated by dot color as described in the legend on the right.
Genome-wide association of anti-PF4/heparin antibodies in the discovery cohort (A) and replication cohort (B).P values were generated using linear regression adjusted for sex, age, and PCs 1 to 3 in an additive model. P values on the −log10 scale are plotted on the left vertical axis, and the chromosomal position is plotted along the horizontal axis. The significance threshold of 5 × 10⁻⁸ is indicated by the solid red horizontal line, and the suggestive significance threshold of 1 × 10⁻⁴ is indicated by the dashed red line. Betas are indicated by dot color as described in the legend on the right.
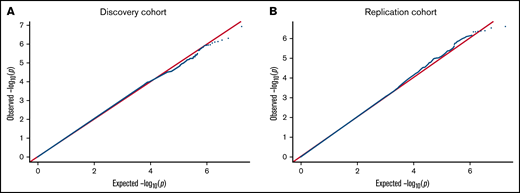
QQ plot for the genome-wide association of anti-PF4/heparin antibodies for discovery cohort (A) and replication cohort (B). QQ plots were generated from the primary GWAS analysis results. P values were generated using multivariate linear regression adjusted for age, sex, and principal components 1 to 3 in an additive model. Observed P values on the −log10 scale are plotted on the left vertical axis, and expected P values on the −log10 scale are plotted along the horizontal axis.
QQ plot for the genome-wide association of anti-PF4/heparin antibodies for discovery cohort (A) and replication cohort (B). QQ plots were generated from the primary GWAS analysis results. P values were generated using multivariate linear regression adjusted for age, sex, and principal components 1 to 3 in an additive model. Observed P values on the −log10 scale are plotted on the left vertical axis, and expected P values on the −log10 scale are plotted along the horizontal axis.
Replication of PF4/heparin antibody signals
We then performed a GWAS in our second cohort (n = 749) to replicate signals seen in our discovery cohort (Figure 1B). The primary replication GWAS analysis consisted of individuals of European ancestry as determined by PCA (supplemental Figure 2). We also did not observe any variants reaching genome-wide significance level, while a total of 1129 variants (Figure 2) reached the genome-wide suggestive threshold (α = 1 × 10⁻⁴). Quantile–quantile plots showed no evidence of genomic inflation (λ = 1.012) (Figure 2B). The top signal in the discovery cohort (rs34434227) did not replicate in our second cohort. The most significant signal in our discovery cohort that reached the replication threshold in our replication cohort (α = 0.05) was the rs1555175145 delCinsTCTG allele (discovery β = −0.076 [0.0181], P = 2.497 × 10⁻⁵; replication β = −0.104 [0.051], P = .041). SNPnexus identified this variant as an intergenic indel. The distribution of anti-PF4/heparin antibody levels across the 3 genotypes is shown in Figure 3A-B for the discovery and replication cohorts, respectively.
![Distribution of anti-PF4/heparin antibody titers. Antibody titer distribution by the genotype of the 2 most highly associated SNPs that passed the suggestive significance threshold in the discovery cohort and were associated in the replication cohort. Violin plots show the proportion of individuals across antibody titer values (optical density [OD]) within each genotype. The top panels show rs1555175145 in the discovery cohort (A) and replication cohort (B). The bottom panels show rs149530346 in the discovery cohort (C) and replication cohort (D). β, standard errors, and P values using linear regression adjusted for age, sex, and principal components 1 to 3 are listed at the bottom of each figure.](https://ash.silverchair-cdn.com/ash/content_public/journal/bloodadvances/6/14/10.1182_bloodadvances.2022007673/5/m_advancesadv2022007673f3.png?Expires=1767732708&Signature=c5QMfc7VDfyF0~p0QviDmTHLI02adxw8ccaZXvLx5rG7F2PmzXSZpxdPo20zy1myHa~v-d-tx4G6B7C9sxmG3H8Hwib5TECWHBpk-gsiyoyA3eZc3Qg5qKUGiuKQF9CtrtvNwkXBQ8NuvcX636mkk5MXCu~ihndYgJe74raZk1T90vy1lPCx8MYv-Lkz6S3qBpQZU3oHMYFWqbw2tlKG7UKik6NtamxNnYmvwewpD-1i8Yy3m44dbI3G3WFsky8X7vhEAxOguU1bNTg10dTy31S~oz6D76DFwiWFPe8ps8fmOxTVWkPYGjEB-MG5KHZjkh-LU-1F3~ql0gx9oFlh8A__&Key-Pair-Id=APKAIE5G5CRDK6RD3PGA)
Distribution of anti-PF4/heparin antibody titers. Antibody titer distribution by the genotype of the 2 most highly associated SNPs that passed the suggestive significance threshold in the discovery cohort and were associated in the replication cohort. Violin plots show the proportion of individuals across antibody titer values (optical density [OD]) within each genotype. The top panels show rs1555175145 in the discovery cohort (A) and replication cohort (B). The bottom panels show rs149530346 in the discovery cohort (C) and replication cohort (D). β, standard errors, and P values using linear regression adjusted for age, sex, and principal components 1 to 3 are listed at the bottom of each figure.
Distribution of anti-PF4/heparin antibody titers. Antibody titer distribution by the genotype of the 2 most highly associated SNPs that passed the suggestive significance threshold in the discovery cohort and were associated in the replication cohort. Violin plots show the proportion of individuals across antibody titer values (optical density [OD]) within each genotype. The top panels show rs1555175145 in the discovery cohort (A) and replication cohort (B). The bottom panels show rs149530346 in the discovery cohort (C) and replication cohort (D). β, standard errors, and P values using linear regression adjusted for age, sex, and principal components 1 to 3 are listed at the bottom of each figure.
We identified 2 other variants that reached the genome-wide suggestive threshold in the discovery cohort and replicated in the replication cohort (Table 2). Rs66867403 was identified as an intronic indel variant within the LPHN2 (ADGRL2 [adhesion G protein-coupled receptor L2]) gene (discovery β = 0.084 [0.021], P = 4.992 × 10⁻⁵; replication β = 0.154 [0.060], P = .01). A second indel variant (rs149530346) was located in the NAALADL2 (N-acetylated α-linked acidic dipeptidase-like 2) gene (discovery β = 0.118 [0.03], P = 8.115 × 10⁻⁵; replication β = 0.211 [0.092], P = .022). The distribution of anti-PF4/heparin antibody levels across this variant’s genotypes indicated that homozygous wild-type individuals had lower levels of antibodies in the discovery cohort (Figure 3C) with similar results in the discovery cohort (Figure 3D). In a meta-analysis of the 2 cohorts, we did not observe any variants which reached genome-wide significance (supplemental Figure 3). Supplemental Table 1 shows SNPnexus results of the top signals in the meta-analysis.
Top variants from discovery cohort GWAS, which reached statistical significance in the replication cohort
| Variant ID | REF | ALT | Discovery MAF | β (95% CI) | P value | Replication MAF | β (95% CI) | P value | Overlap Gene | Functional Annotation |
|---|---|---|---|---|---|---|---|---|---|---|
| rs1555175145 | C | TCTG | 0.393 | −0.076 (−0.112 to −0.041) | 2.497 × 10⁻⁵ | 0.435 | −0.104 (−0.204 to −0.004) | .041 | None | None |
| rs66867403 | A | — | 0.233 | 0.084 (0.044-0.125) | 4.992 × 10⁻⁵ | 0.244 | 0.154 (0.036-0.272) | .010 | ADGRL2 [LPHN2] | Intronic |
| rs2849940 | T | A, C, G | 0.150 | 0.098 (0.050-0.145) | 6.260 × 10⁻⁵ | 0.155 | 0.201 (0.071-0.061) | .005 | None | None |
| rs149530346 | TAAG | — | 0.096 | 0.118 (0.060-0.176) | 8.110 × 10⁻⁵ | 0.086 | 0.211 (0.031-0.390) | .022 | NAALADL2 | Intronic |
Summary statistics from the top variants in the discovery cohort GWAS as well as corresponding statistics in the replication cohort are provided. Additionally listed for the variants are the location and function. The “Overlap Gene” column indicates whether the variant is located in a coding region (introns and exons). The “Functional Annotation” column lists the location classification of each variant located in a gene: coding, intronic, or untranslated regions of transcript isoforms of the gene.
ADGRL2, adhesion G protein-coupled receptor L2; ALT, alternative allele; Discovery MAF, frequency of the minor allele in discovery cohort; Replication MAF, frequency of the minor allele in the replication cohort; NAALADL2: N-acetylated α-linked acidic dipeptidase-like 2; REF, reference allele.
Sensitivity analyses for genomic association
To meet the assumptions of a linear regression model, we normalized our outcome variable and then performed a GWAS on the normalized data. In the discovery and replication cohort, we observed results consistent with the primary analysis and did not identify any signals in our GWAS that reached genome-wide significance (supplemental Figures 4 and 5). In a meta-analysis of the subset of individuals classified as antibody-positive (OD > 0.5), no variants reached genome-wide significance (supplemental Figure 6). Next, we dichotomized anti-PF4/heparin antibody values (antibody-positive, OD ≥ 0.5 and antibody negative, OD < 0.5), and we observed no signals that reached genome-wide significance in the meta-analysis (supplemental Figure 7). Finally, using a linear mixed models approach in GEMMA, we found no variants associated with antibody response at a genome-wide significance threshold in our discovery cohort, consistent with our primary GWAS results (supplemental Figure 8).
GSEA
GSEA was performed on the summary statistics from our primary GWAS analysis. In total, 116 gene sets reached the false discovery rate (FDR)-corrected threshold (q < 0.05) in our discovery cohort. The top associated pathway (q = 0.003, 34 significant genes out of 40 genes in pathway [34/40]) was “GO: Regulation of Organelle Organization and Biogenesis” (GO:0033043). The second most statistically associated pathway was “KEGG: T-Cell Receptor Signaling Pathway” (q = 0.046 [80/108]) (Table 3). In the replication cohort, 74 gene sets reached the FDR threshold. A total of 3 gene sets were significant in both discovery and replication cohorts, including “KEGG: Leukocyte Transendothelial Migration” (q = 0.006 [discovery]; q = 0.048 [replication]); “GO: Innate Immune Response” (q = 0.023 [discovery]; 0.015 [replication]); and “GO: Lyase Activity” (0.031 [discovery]; 0.047 [replication]) (Table 4). A complete list of all gene sets reaching statistical significance is provided in supplemental Tables 2 and 3.
Top FDR-corrected gene sets from GSEA in discovery and replication cohort
| Gene set name | FDR value | Significant genes/all genes | ENCODE-enriched peaks |
|---|---|---|---|
| Discovery cohort | |||
| GO: REGULATION OF ORGANELLE ORGANIZATION AND BIOGENESIS | 0.0030 | 34/40 | 210 |
| KEGG: T CELL RECEPTOR SIGNALING PATHWAY | 0.0046 | 80/108 | 699 |
| GO: MICROTUBULE BASED PROCESS | 0.0047 | 59/82 | 382 |
| GO: OXIDOREDUCTASE ACTIVITY GO 0016616 | 0.0048 | 40/58 | 261 |
| GO: NEGATIVE REGULATION OF DEVELOPMENTAL PROCESS | 0.0049 | 146/197 | 649 |
| Replication cohort | |||
| GO: CARBOHYDRATE CATABOLIC PROCESS | 0.0037 | 18/24 | 13 |
| KEGG: DRUG METABOLISM CYTOCHROME P450 | 0.0038 | 61/72 | 148 |
| GO: METAL ION TRANSPORT | 0.0040 | 91/117 | 621 |
| GO: CELLULAR CARBOHYDRATE CATABOLIC PROCESS | 0.0041 | 17/23 | 13 |
| KEGG: STARCH AND SUCROSE METABOLISM | 0.0041 | 43/52 | 0 |
The GSEA package lists regulatory elements from ENCODE (Encyclopedia of DNA Elements) projects. The “ENCODE-enriched peaks” column contains the number of statistically significant peaks (P < .05) identified in each gene set. The enrichment peaks were obtained from DNase-seq, FAIRE-Seq (formaldehyde-assisted isolation of regulatory elements), TFBS (transcription factor binding sites) chromatin immunoprecipitation sequencing (ChIP)-seq, and histone ChIP-seq within the ENCODE project.
Gene sets from GSEA that reached an FDR-corrected threshold (q < 0.05) in both cohorts
| Gene set name | Discovery FDR value | Significant genes/all genes | Replication FDR value | Significant genes/ all genes |
|---|---|---|---|---|
| KEGG: LEUKOCYTE TRANSENDOTHELIAL MIGRATION | 0.006 | 83/117 | 0.0477 | 79/117 |
| GO: INNATE IMMUNE RESPONSE | 0.023 | 18/23 | 0.019 | 19/23 |
| GO: LYASE ACTIVITY | 0.031 | 48/69 | 0.0471 | 52/69 |
The “KEGG: Leukocyte Transendothelial Migration” pathway involves the process of leukocytes binding to endothelial adhesion molecules and migrating across the endothelial tissue. The “GO: Innate Immune Response” (GO:0045087) pathway encompasses the defense response mediated by germline-encoded components that directly recognize components of potential pathogens. “GO: Lyase Activity” (the third replicated gene set) involves the class of enzymes which catalyze the cleavage of bonds including carbon–carbon, carbon–oxygen, or carbon–nitrogen, including enzymes that convert ATP (or GTP) to cAMP (cGMP).
Discussion
Here we present the largest GWAS to date interrogating the association of genomic variants with anti-PF4/heparin antibody response. We were unable to identify variants reaching genome-wide significance in either of our 2 cohorts. The results of the GWAS identified only 4 variants that reached even a liberal α threshold and were replicated in our replication cohort. Most notably, 2 variants, rs66867403 and rs149530346, were located in intronic regions of LPHN2 and NAALADL2, respectively. Given that our cohorts have relatively large sample sizes for the anti-PF4/heparin antibody phenotype, these results suggest that single nucleotide polymorphisms are not drivers of the variable antibody response seen in heparin-treated patients with European ancestry.
Although single nucleotide polymorphisms did not significantly affect the antibody response, aggregation of multiple SNPs within a common pathway or gene set may culminate into an appreciable effect on the phenotype, as was seen in the GSEA data. The GSEA analyses performed resulted in 3 replicated gene sets, 2 of which encompass biological pathways previously implicated in HIT pathogenesis. The “KEGG: Leukocyte Transendothelial Migration” pathway directly implicates the involvement of monocytes, granulocytes such as neutrophils, and lymphoblasts, including T cells and B cells. Neutrophils are key drivers in HIT-associated thrombosis.32,33 Heparin and PF4 interact with lymphocytes and influence their function,34,35 and T cells appear to play a role in HIT pathogenesis,36,37 including the requirement of CD4+ T cells for anti-PF4/heparin IgG antibody production in a mouse model.38 The second replicate gene set of “GO: Innate Immune Response” further supports the evidence of the innate immune response in HIT pathogenesis. HIT exhibits innate immune features, specifically PF4/heparin complexes that can activate complement and mediate binding to B cells.39 IgM antibodies bind to PF4/heparin complexes, generating ultra-large complexes, which then go on to engage with complement components.40 Most strikingly, PF4 knock-out mice produce anti-PF4/heparin IgM antibodies upon bacterial challenge, and human cord blood B cells produce anti-PF4 antibodies when stimulated ex vivo.41 Our GSEA results further suggest the involvement of the innate system in HIT.
The gene set “GO: Lyase Activity” was a replicated gene set in our analysis and points toward a previously underinvestigated biological pathway influential in the antibody response. Polysaccharide lyases are a class of lyase enzymes that depolymerizes glycosaminoglycans (GAGs) such as heparin, heparin sulfate, dermatan sulfate, and chondroitin sulfate.42 Platelets, monocytes, and endothelial cells all express cell surface GAGs, which interact with PF4 and serve as a deposition site for anti-PF4/heparin antibodies.43,44 The addition of the lyases chondroitinase ABC (which removes chondroitin sulfate) or heparinase (which removes heparin sulfate and dermatan sulfate) decreases the binding of KKO (a monoclonal antibody that mimics the effects of human anti-PF4/heparin antibodies) to monocytes. The cleavage of GAGs via these polysaccharide lyases degrades the ability of GAGs to bind to PF4, reducing the number of PF4/GAG complexes and, subsequently, a fewer number of antigenic neoepitopes are exposed for KKO to recognize. Furthermore, chondroitinase ABC treatment on platelets resulted in a marked reduction in KKO binding as well.44,45 Monocyte activation by PF4/GAG-IgG complexes initiate the expression of tissue factor and may contribute to HIT-associated thrombosis.46,47 Genetic polymorphisms, which alter the abundance or enzyme kinetics of endogenous lyases, could influence the formation of neoepitopes and anti-PF4/heparin antibody binding. A reduction in the number of antigenic complexes formed could potentially reduce platelet and monocyte activation, leading to a lower risk of HIT. Further research into the variability of GAG composition and heterogeneity among patients may serve as avenues for new insights into HIT pathogenesis. These novel results are important findings in further understanding the complex, atypical antibody-mediated immune response seen in HIT. These results are particularly notable given the previous genomic studies investigating antibody response have been far smaller and thus underpowered to make these discoveries.
Our GWAS does show moderate agreement with previous anti-PF4/heparin antibody studies. One study found genetic polymorphisms in microsatellites of IL-10G; specifically, the short G20 allele was more frequently seen in antibody-negative patients.48 Our dataset did not include the CA repeats necessary to validate these previous associations. However, the authors also tested 3 SNPs previously associated with IL-10 production and one, rs1800896, associated with anti-PF4/heparin levels in our cohort (β = −0.03704, P = .03803). Furthermore, our GSEA analysis showed the IL-10 gene was enriched for genetic variation associated with anti-PF4/heparin antibody levels in the second-most associated pathway within our discovery cohort (“KEGG: T-Cell Receptor Signaling Pathway”). As IL-10 plays a critical role in peripheral inflammation and is produced by multiple leukocyte cell types, this association may be a marker of anti-PF4/heparin antibody response or, more generally, of immune-mediated responses.
Polymorphisms in the ACP1 gene, a low molecular-weight protein tyrosine phosphatase, have also been associated with anti-PF4/heparin antibodies.49 Alleles involving 2 SNPs, rs11553742 and rs11553746, were associated with anti-PF4/heparin antibodies and HIT. However, both SNPs, rs11553746 (β = −0.02872, P = .1236) and rs11553742 (β = 0.02838, P = .6529), were not associated in our discovery cohort. One additional study had previously identified variation in the human leukocyte antigen (HLA) region associated with anti-PF4/heparin antibody response.50 This study found that patients with the DRB1*03:01 and/or DQB1*02:01 allele had higher anti-PF4/heparin antibody levels than those without the alleles after adjusting for age, sex, and race in a cohort of 412 individuals. No variants within the DRB1 and DQB1 genes reached genome-wide significance in our discovery cohort. Furthermore, in our GSEA analysis, we selected the inclusion of gene sets containing HLA regions, and our results did not indicate any HLA gene sets that replicated after FDR correction, consistent with earlier studies.51 The indirect replication of previous findings bolsters prior evidence of the role of IL-10 in anti-PF4/heparin antibody response.
It should be noted that there are limitations within our study. In the replication cohort, any individual with an antibody OD < 0.5, including those who were denoted as antibody-negative control subjects, all underwent CPB surgery. Since those individuals received CPB, genotypes or characteristics may have been enriched within this subgroup in our cohort. In addition, levels of anti-PF4/heparin antibodies were measured in both cohorts using a polyclonal ELISA, detecting IgG, IgA, and IgM antibodies, although anti-PF4/heparin IgG antibodies play the most critical role in cell activation associated with HIT. While our study is the largest GWAS on anti-PF4/heparin antibodies to date, the sample size is still a limitation for identifying variants with low frequency or small effect sizes. Additionally, the overwhelming majority of the individuals in our cohorts were of European ancestry, and variants that associate with anti-PF4/heparin antibody levels may be present in more diverse populations. Finally, prior studies in patients with periodontal disease have indicated that patients produce anti-PF4/heparin antibodies in the absence of heparin treatment,52 suggesting that a prior bacterial exposure may serve as a priming event for the antibody response observed in HIT. Genetic predictors of anti-PF4/heparin antibody response may be observable when such prior exposures or infections are controlled for, but we were unable to capture this information in the present study.
Conclusions
Our results support that individual genetic polymorphisms do not account for variable antibody response seen among patients with European ancestry who have undergone testing for clinical suspicion of HIT. Given the increased power in our cohorts, we consider the lack of statistically significant associations with anti-PF4/heparin antibody response as informative. Our data indicate that any genetic variants influencing anti-PF4/heparin antibody levels in populations with European ancestry are likely to have low frequencies and/or modest effect sizes such that genetic variation could not likely be used to predict anti-PF4/heparin IgG antibody production. Our GSEA results, which require independent replication, bolster evidence for the role of leukocytes and the innate immune system in HIT pathogenesis and potentially implicate lyase activity in the antibody response seen in HIT patients.
Acknowledgments
The authors thank the staff of the Laboratory for Genotyping Development, Riken Center for the Integrative Medical Sciences. They are grateful to Chloe Grace and Jianglin Feng for their computational, statistical, and intellectual support. They would like to thank Ulrike Strobel, Carmen Freyer, Katrin Stein, Ines Warnig, Ricarda Raschke, and Jessica Fuhrmann for excellent technical support in performing all heparin-induced thrombocytopenia assays in the discovery cohort. Genome-wide data were provided by the Pharmacogenomics Research Network (PGRN)-Riken Collaborative.
J.B.G. is funded by the Environmental Health Sciences (NIEHS) of the National Institutes of Health (NIH) (T32 Training Grant [T32 ES007091]). This research is funded by the National Heart, Lung, and Blood Institute (NHLBI)/NIH under awards K01HL143137 (J.H.K.), R01HL158686 (J.H.K.), R01HL156993 (J.H.K.), and U19 HL065962 (D.M.R.) and the National Institute of General Medical Sciences (NIGMS) under award P50GM115305 (D.M.R.). Acquisition of the replication cohort from the University of Tours with the independent replication population was supported by the IRTH (Institut pour la Recherche sur la Thrombose et l’Hémostase) and by a Programme Hospitalier de Recherche Clinique (PHRC) grant (PHRN09-YG/FRIGTIH). The study was supported by the Deutsche Forschungsgemeinschaft (DFG, German Research Foundation) Project Number 374031971–TRR240 (A.G.).
Authorship
Contribution: J.H.K., J.R., C.P., N.M.H., E.J.P., T.E.W., Y.G., A.G., and D.M.R. designed the research; J.H.K., J.R., Y.M., C.I., K.S., T.T., T.M., M.K., C.P., Y.G., A.G., and D.M.R. performed the research; J.B.G., J.H.K., K.L.M., H.E.S., C.M.S., and E.C.M. analyzed the data; and J.B.G. and J.H.K. wrote the paper.
Conflict-of-interest disclosure: T.E.W. has received lecture honoraria from Alexion and Instrumentation Laboratory and royalties from Informa (Taylor & Francis); has provided consulting services to Aspen Canada, Aspen Global, Bayer, CSL Behring, Ergomed, and Octapharma; has received research funding from Instrumentation Laboratory; and has provided expert witness testimony relating to heparin-induced thrombocytopenia (HIT) and non-HIT thrombocytopenic and coagulopathic disorders. A.G. reports grants and nonfinancial support from Aspen, Boehringer Ingelheim, MSD, Bristol Myers Squibb (BMS), Paringenix, Bayer Healthcare, Gore Inc., Rovi, Sagent, Biomarin/Prosensa; personal fees from Aspen, Boehringer Ingelheim, MSD, Macopharma, BMS, Chromatec, Instrumentation Laboratory; nonfinancial support from Boehringer Ingelheim, Portola, Ergomed, GTH e.V. outside the submitted work. K.S. reports research funding from Immucor; personal fees from Aspen and Viatris; and nonfinancial support from SOBI outside the submitted work. The remaining authors declare no competing financial interests.
Correspondence: Jason H. Karnes, University of Arizona College of Pharmacy, 1295 N Martin Ave, Tucson, AZ 85721; e-mail: karnes@pharmacy.arizona.edu.

