

Key Points
Storage of red blood cells in the alkaline storage solution PAGGGM improves metabolism but has no effect on posttransfusion recovery.
Transfused red blood cells can recover from the metabolic storage lesion within a day after transfusion.

Abstract
Additive solutions are used to limit changes that red blood cells (RBCs) undergo during storage. Several studies have shown better preservation of glucose and redox metabolism using the alkaline additive solution PAGGGM (phosphate-adenine-glucose-guanosine-gluconate-mannitol). In this randomized open-label intervention trial in 20 healthy volunteers, the effect of storage, PAGGGM vs SAGM (saline-adenine-glucose-mannitol), on posttransfusion recovery (PTR) and metabolic restoration after transfusion was assessed. Subjects received an autologous biotinylated RBC concentrate stored for 35 days in SAGM or PAGGGM. As a reference for the PTR, a 2-day stored autologous biotinylated RBC concentrate stored in SAGM was simultaneously transfused. RBC phenotype and PTR were assessed after transfusion. Biotinylated RBCs were isolated from the circulation for metabolomics analysis up to 24 hours after transfusion. The PTR was significantly higher in the 2-day stored RBCs than in 35-day stored RBCs 2 and 7 days after transfusion: 96% (90 to 99) vs 72% (66 to 89) and 96% (90 to 99) vs 72% (66 to 89), respectively. PTR of SAGM- and PAGGGM-stored RBCs did not differ significantly. Glucose and redox metabolism were better preserved in PAGGGM-stored RBCs. The differences measured in the blood bag remained present only until 1 day after transfusion. No differences in RBC phenotype were found besides an increased complement C3 deposition on 35-day RBCs stored in PAGGGM. Our data indicate that despite better metabolic preservation, PAGGGM is not a suitable alternative for SAGM because storage in PAGGGM did not result in an increased PTR. Finally, RBCs recovered from circulation after transfusion showed reversal of the metabolic storage lesion in vivo within a day. This study is registered in the Dutch trial register (NTR6492).
Introduction
Directly after red blood cell (RBC) transfusion, a significant number of RBCs are cleared from the circulation; in some patients, up to 38% of the transfused RBCs are cleared in the first 24 hours.1,2 Several studies have reported that posttransfusion recovery (PTR) (ie, the percentage of RBCs that circulate at 24 hours after transfusion) is heterogeneous across the donor population, with units showing poor PTR (<75%) below US Food and Drug Administration and European Council thresholds.3 A low PTR results in a larger need for blood products as well as increased exposure to the potentially harmful side effects of RBC transfusion.4,5
During storage, RBCs undergo several metabolic and morphological changes, known as the “storage lesion.” The metabolic changes include decreased cellular levels of 2,3-diphosphoglycerate (2,3-DPG), adenosine triphosphate (ATP), and impaired redox metabolism.6-10 Decrease in the intracellular pH contributes significantly to the storage lesion. The rate-limiting enzyme of glycolysis, phosphofructokinase (PFK), is inhibited at pH <7.0.11 However, both citrate-phosphate-dextrose (CPD; anticoagulant), as well as the standard additive solution for RBCs in Europe (saline-adenine-glucose-mannitol [SAGM]), have a pH of 5 to 6, resulting in a relatively low pH for the RBC concentrate.
It is unclear to what extent these metabolic changes are reversible. ATP and 2,3-DPG levels can restore within 72 hours after transfusion.12-14 However, storage also impacts the main antioxidant pathways15 (eg, the pentose phosphate pathway [PPP] and glutathione [GSH] metabolism), purine,15 and lipid oxidation.16 It is unknown whether these metabolic lesions also improve after transfusion.
An experimental additive solution, PAGGGM (phosphate-adenine-glucose-guanosine-gluconate-mannitol), showed better in vitro preservation of 2,3-DPG levels and higher ATP levels throughout storage but is not tested in vivo so far.17 Storage in alkaline additive solutions results in chloride shifts from intracellular to extracellular, with an opposite flux of hydroxyl ions into the RBC. The hydroxyl ions increase the intracellular pH and thereby activate PFK.
We hypothesized that (1) storing RBCs in PAGGGM results in improved RBC metabolism during storage, which in turn would improve survival after transfusion, and (2) storing RBCs in PAGGGM changes the expression of prophagocytic and antiphagocytic markers on stored RBCs.
Material and methods
Study design
An open-label randomized controlled trial was conducted to study the effect of storage time and additive solution on the PTR of RBCs. Subjects were randomly allocated to receive autologous biotinylated RBC products stored in SAGM or the experimental additive solution PAGGGM. Volunteers received 2- and 35-day stored RBC concentrates.
Twenty healthy male subjects were recruited. Before inclusion, each subject was screened by a research physician and was approved as an autologous blood donor by the national blood bank. Participants were compensated for time lost and received a travel allowance.
The study was approved by the Institutional Review Board of the Academic Medical Center, Amsterdam, The Netherlands, and registered in the Dutch trial register (NTR6492). Written informed consent was obtained from each subject before the screening.
Blood donation
Twenty subjects donated 500 mL and 200 mL of whole blood in CPD at the national blood bank 35 and 2 days before the transfusion, respectively. After overnight storage at 20°C to 24°C, the units of whole blood were processed according to the Dutch Blood Bank standards: separated into plasma, buffy coats, and leukoreduced RBCs. RBC storage was randomly allocated to SAGM (150 mmol/L NaCl, 1.25 mmol/L adenine, 50 mmol/L glucose, 29 mmol/L mannitol, pH 5 to 6, Fresenius Kabi) or the experimental additive solution PAGGGM (1.44 mmol/L adenine, 1.44 mmol/L guanosine, 47.5 mmol/L glucose, 40 mmol/L Na-gluconate, 8 mmol/NaH2PO4·2H2O, 8 mmol Na2HPO4·2H2O, 55 mmol/L mannitol, pH 8 to 9). Blood was stored according to standard blood bank practice until biotinylation.
Biotinylation of RBCs
One day before transfusion, 25 mL of each donation was labeled with 15 µg/mL (low density) or with 48 ug/mL (high density) biotin. Directly after labeling, the biotinylation was checked using flow cytometry to ensure that the different populations were distinguishable. To exclude any effect of biotin label concentration, half of each group received fresh RBCs labeled with a low biotin concentration and stored RBCs labeled with a high concentration. The other half received fresh RBCs labeled with a high concentration of biotin and stored RBCs labeled with a low concentration of biotin. After biotinylation, each RBC concentrate was resuspended in 25 mL of the allocated additive solution. All units were biotinylated in a closed system according to the methods described previously.18
Study day
Subjects were admitted for 1 day to the research unit of the Department of Intensive Care. Before the study procedures, a research physician medically checked the subjects, and blood was crossmatched as an additional safety procedure. Fresh and stored bioRBCs were mixed before infusion in a closed system. A 50 mL mixed bioRBC sample was infused within 10 minutes. The infusion system was flushed with 100 mL 0.9% saline (Baxter, Viaflo).
Ten minutes, 30 minutes, 1, 2, 4, 6, and 8 hours after infusion, blood samples were drawn from an indwelling venous cannula and stored in the dark at 4°C until further analysis. Temperature, blood pressure, heart rate, and respiration rate were monitored up to 8 hours after transfusion. Whole blood samples were drawn using Ethylenediaminetetraacetic acid (EDTA) tubes (BD Plymouth, United Kingdom).
In the hospital’s general laboratory of clinical biochemistry, total bilirubin, lactate dehydrogenase, aspartate aminotransferase, and haptoglobin were measured with the Roche cobas c702 chemical analyzer (Roche Diagnostics, Indianapolis, IN).
Follow-up
All study subjects were followed for 90 days after transfusion; blood was sampled 1, 2, 7, 30, and 90 days after transfusion. On return visits, blood samples were collected using venipunctures. All samples were stored in the dark at 4°C until further analysis.
Flow cytometry
EDTA anticoagulated blood samples were analyzed 1 day after sampling. The amount of bioRBCs was quantified by flow cytometry after staining with Streptavidin Alexa Fluor 647 conjugate (Thermo Fisher Scientific, catalog number: S32357). The PTR of bioRBC was calculated with respect to the percentage bioRBCs present in the circulation 10 minutes after transfusion. The PTR was assessed until 90 days after transfusion. To assess the clearance of RBCs in the first 10 minutes, the distribution of fresh and stored bioRBCs in the mixed RBC concentrate before infusion was compared with the distribution of fresh and stored RBCs recovered from the circulation after transfusion. A difference in distribution indicates that one of the populations is faster cleared from the circulation.
To investigate the role of several prophagocytic and antiphagocytic markers, double and triple staining was used to quantify the clearance markers separately in the different populations; the antibodies used are listed in the supplemental Materials. Membrane markers were expressed as a percentage of fluorescent-positive cells or as mean fluorescent intensity per population. The G6PD activity was assessed per individual RBC using a flowcytometric assay as previously described.8,19
All flow cytometry experiments were performed with a flow cytometer (BD FACS, BD Fortessa + High Throughput Sampler (HTS), BD Biosciences). The data were analyzed with computer software (FACSDiva v.8.0.1, BD Biosciences).
Cell sorting procedure
BioRBCs were isolated in 2 separate steps from the EDTA whole blood samples. This procedure is based on the differences in biotin density. In the first step, bioRBCs were isolated using magnetic beads, followed by the second step using flow cytometric cell sorting (supplemental Figure 1).
Blood samples were washed twice to remove the plasma and the buffy coat (SAGM, 1000 Relative Centrifugal Force (RCF) for 15 minutes, 4°C; and 2500 RCF, 5 minutes, 4°C). RBCs were incubated for 30 minutes at 0°C with streptavidin-647 (1:100, Thermo Fisher Scientific) and washed (2500 RCF, 5 minutes, 4°C), followed by incubation for 15 minutes at 4°C with 80 µL anti-Alexa fluor 647 microbeads (Milteny Biotec). Incubated cells were flushed through an LS column (Milteny Biotec) while put in a magnetic field. This column was flushed 3 times with a flushing buffer containing phosphate-buffered saline (Fresenius Kabi), 10% trisodium citrate (Merck), and 0.5% human serum albumin (Brocacef) to remove the unlabeled cells. The retained BioRBCs in the LS column were eluted in the flushing buffer after the column was removed from the magnetic field. This cell suspension, containing bioRBCs with 2 different densities of biotin, was sorted using flow cytometry. After flow cytometry, the cell suspension was centrifuged (2500 RCF, 5 minutes, 4°C), removing the supernatant. The cell pellet was stored at −80°C until further analysis.
Liquid chromatography–mass spectrometry
Metabolomics analyses were performed as extensively described in previous studies.20-22 A volume of 50 μL of frozen RBC aliquots was extracted in 450 μL of methanol:acetonitrile:water (5:3:2, vol/vol/vol). After vortexing at 4°C for 30 minutes, extracts were separated from the protein pellet by centrifugation for 10 minutes at 10 000 g at 4°C and stored at −80°C until analysis. Ultra-high pressure liquid chromatography–mass spectrometry analyses were performed using a Vanquish UHPLC coupled online to a Q Exactive mass spectrometer (Thermo Fisher, Bremen, Germany). Samples were analyzed using a 5-minute gradient as described. Solvents were supplemented with 0.1% formic acid for positive mode runs and 1 mM ammonium acetate for negative mode runs. mass spectrometry acquisition, data analysis, and elaboration were performed as described.23-25
Statistical analysis
Data were visually checked for distribution. In addition, a Shapiro-Wilk test was used to confirm if data were normally distributed. Normally distributed and nonnormally distributed data were reported as mean (standard deviation) or median (first quartile–third quartile), respectively. Normally distributed data were analyzed using the Students t test or ANOVA analysis, and nonparametric data were first ranked before analysis or analyzed with the Wilcoxon rank-sum or Kruskal-Wallis test. Significance between 2 groups (SAGM vs PAGGGM and 2- vs 35-day stored) was evaluated using a 2-way ANOVA with grouping variables being additive solution or storage time and time after transfusion. To assess the effect of additive solution, only the 35-day stored RBCs were included for analysis. P < .05 was considered to be statistically significant.
Metabolomics analysis was considered to be exploratory; therefore, no Bonferroni correction was applied. As predefined in the trial registry (NTR6492), only glycolysis, pentose phosphate pathway, and redox metabolism-related metabolites were analyzed. SAGM RBCs (35-day stored) were compared with 35-day stored PAGGGM RBCs. Two-day stored SAGM RBCs were compared with 35-day stored SAGM RBCs. Data were analyzed using computer software (R studio version, R version 3.5.2). For original deidentified participant data, please contact the corresponding author.
Results
Clinical effects
Twenty subjects were transfused with 25 mL 35-day stored autologous RBCs, either stored in SAGM or PAGGGM, divided into groups of 10 volunteers each. As a reference, 25 mL 2-day stored autologous RBCs, all in SAGM, were simultaneously transfused. In 5 subjects, only the 35-day stored RBCs were administered due to logistic issues concerning the 2-day stored RBCs. No adverse events were reported. After transfusion of the RBCs, no effects on bilirubin, haptoglobin, lactate dehydrogenase, and aspartate aminotransferase were observed in either group (supplemental Figure 2). In addition, transfusion of SAGM-RBCs and PAGGGM-RBCs did not affect body temperature, blood pressure, respiratory rate, and heart rate during the study day (data not shown).
Storage in PAGGGM does not result in higher PTR
The PTR of 35-day stored PAGGGM RBCs was compared with the PTR of 35-day stored SAGM RBCs. The PTR was significantly lower for the PAGGGM RBCs over 90 days (P = .002) (Figure 1). However, in the post hoc analysis of each separate time point, no significant differences were observed (supplement Table 1). The 24-hour PTR of 35-day stored PAGGGM RBCs was 68% (59 to 87) and 81% (70 to 93) in SAGM-stored RBCs (P = .16).

Post transfusion recovery (PTR) PAGGGM stored RBCs. (A) PTR is significantly different between 35-day stored SAGM and PAGGGM RBCs over time, but not at a specific time point. (B) Thirty-five days of storage in SAGM results in decreased PTR compared with 2 days of storage in SAGM. The line plot indicates the median with 25th and 75th percentile of PTR over time, up to 90 days after transfusion.
Post transfusion recovery (PTR) PAGGGM stored RBCs. (A) PTR is significantly different between 35-day stored SAGM and PAGGGM RBCs over time, but not at a specific time point. (B) Thirty-five days of storage in SAGM results in decreased PTR compared with 2 days of storage in SAGM. The line plot indicates the median with 25th and 75th percentile of PTR over time, up to 90 days after transfusion.
35 days of storage results in a decreased PTR
As anticipated, the duration of storage had a significant effect on the PTR of 35-day stored RBCs in SAGM (P < .05) (Figure 1B). Post hoc analysis showed that the PTR was significantly higher in 2-day stored RBCs at 2 days (96% [90 to 99] vs 72% [66 to 89]; P < .05) and 7 days (96% [90 to 99] vs 72% [66 to 89]; P < .05) after transfusion compared with the 35-day stored RBCs. The 24-hour PTR of 2-day stored SAGM RBCs was 97% (97 to 105) and 81% (70 to 93) in 35-day stored SAGM RBCs (P = .056).
In addition to the PTR, which was calculated using the 10 minutes after transfusion reference value, we also aimed to assess the clearance of RBCs in the first 10 minutes. We compared the ratio of fresh and stored RBCs in the RBC concentrate before transfusion with the ratio of these 2 populations in the whole blood sample taken 10 minutes after transfusion (supplemental Figures 3 and 4). However, for the group as a whole, there was no statistically significant difference between the ratio of fresh and stored RBCs before and after transfusion.
Expression of prophagocytic and antiphagocytic markers after transfusion
In addition to the analysis of the PTR, attempts were made to identify the occurrence of changes in the membrane of the transfused RBCs in time. Among these were phosphatidylserine exposure, immunoglobulin-G binding, complement deposition, and CD47 expression.26 No changes in the expression of prophagocytic and antiphagocytic markers were found, except for complement deposition on RBCs stored in PAGGGM. PAGGGM RBCs showed significantly higher C3 deposition 10 minutes, 30 minutes, 1 hour, and 2 hours after transfusion (supplemental Figure 5A). However, higher iC3b deposition was also found at these time points (supplemental Figure 5B).
Increased glycolytic activity in PAGGGM RBCs
Glycolysis was more active during storage in PAGGGM (Figure 2). As a result, ATP levels were significantly higher, and less glucose was present in PAGGGM-stored RBCs, resulting in increased levels of 7 metabolites of the glycolysis, including hexose phosphate (including unresolved isomers glucose 1 or 6-phosphate and fructose 6-phosphate with the chromatographic conditions adopted in this study); fructose-1,6-biphosphate; glyceraldehyde-3-phosphate; diphosphoglycerate (including isomers 1,3 and 2,3-DPG); phosphoglycerate; phosphoenolpyruvate; and lactate. Several differences remained shortly after transfusion. Glucose–phosphate was higher 10 minutes after transfusion in the PAGGGM-stored RBCs but was similar after 6 hours. DPG, phosphoglycerate, and phosphoenolpyruvate were significantly higher up to 6 hours after transfusion. In SAGM RBCs, these levels increased after transfusion, while in PAGGGM RBCs, a decrease was observed. Consequently, 24 hours after transfusion, no differences were found between SAGM- and PAGGGM-stored RBCs that were still circulating. Also, no differences were found in adenosine monophosphate (AMP), adenosine diphosphate (ADP), and ATP levels after transfusion.
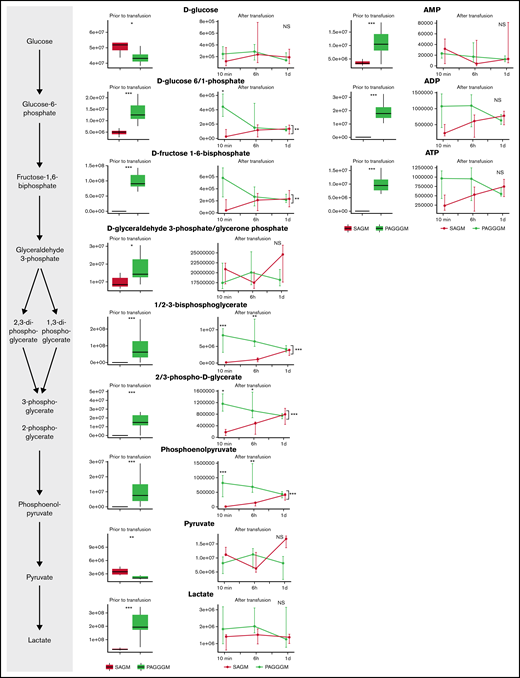
Metabolomics data of glycolysis metabolites comparing 35-day stored RBCs in SAGM with 35-day stored RBCs in PAGGGM. The boxplots show metabolite levels in RBCs before transfusion. Line plots indicate the median with 25th and 75th percentile of metabolite concentrations over time in the recovered RBCs, up to 1 day after transfusion.*P < .05, **P < .01, and ***P < .0001; NS, not statistically significant.
Metabolomics data of glycolysis metabolites comparing 35-day stored RBCs in SAGM with 35-day stored RBCs in PAGGGM. The boxplots show metabolite levels in RBCs before transfusion. Line plots indicate the median with 25th and 75th percentile of metabolite concentrations over time in the recovered RBCs, up to 1 day after transfusion.*P < .05, **P < .01, and ***P < .0001; NS, not statistically significant.
Redox metabolism in PAGGGM RBCs
PAGGGM-stored RBCs showed an increased PPP flux before transfusion indicated by higher concentrations of 6-phosphogluconate in the metabolomics analysis (Figure 3) and increased G6PD activity as determined by our flow cytometric assay (Figure 6). Immediately after transfusion, the differences between 6-phosphogluconate concentrations and G6PD activity were corrected. On the other hand, ribose phosphate, the final product of the PPP, was significantly higher in transfused PAGGGM RBCs at 10 minutes, 6 hours, and 1 day after transfusion (Figure 3). Sedoheptulose phosphate levels were higher 10 minutes after transfusion in PAGGGM-stored RBCs, while before transfusion, higher levels were found in SAGM-stored RBCs.
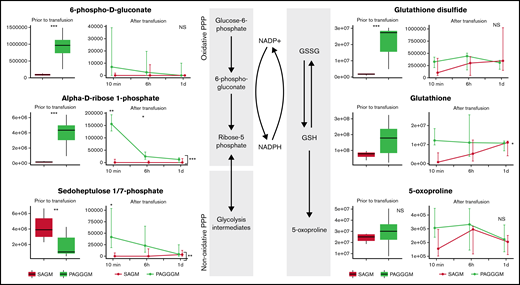
Metabolomics data of PPP and glutathione-related metabolites comparing 35-day stored RBCs in SAGM and 35-day stored RBCs in PAGGGM. The boxplots show metabolite concentrations in RBCs before transfusion. Line plots indicate the median with 25th and 75th percentile of metabolite concentrations over time in the recovered RBCs, up to 1 day after transfusion. *P < .05, **P < .01, and ***P < .0001; NS, not statistically significant.
Metabolomics data of PPP and glutathione-related metabolites comparing 35-day stored RBCs in SAGM and 35-day stored RBCs in PAGGGM. The boxplots show metabolite concentrations in RBCs before transfusion. Line plots indicate the median with 25th and 75th percentile of metabolite concentrations over time in the recovered RBCs, up to 1 day after transfusion. *P < .05, **P < .01, and ***P < .0001; NS, not statistically significant.
Glutathione disulfide (GSSG) levels were significantly higher in PAGGGM RBCs before transfusion. After the transfusion, these differences rapidly disappeared. Reduced glutathione (GSH) and the breakdown product of GSH, 5-oxoprolin, were not significantly different at any of the time points before or after transfusion.
Purine and free fatty acid metabolism in PAGGGM RBCs
Hypoxanthine is a deaminated purine, which is a product of ATP, AMP, and adenosine metabolism. In PAGGGM RBCs, hypoxanthine levels were significantly higher than 35-day stored SAGM RBCs. This difference remained present up to 6 hours after transfusion in the restored RBCs (Figure 4). Hypoxanthine can be converted via xanthine to urate with hydrogen peroxide as a byproduct. Xanthine was significantly higher in PAGGGM before transfusion but not in the RBCs that were recovered after transfusion. In contrast, urate levels were similar in SAGM and PAGGGM RBCs before and after transfusion.
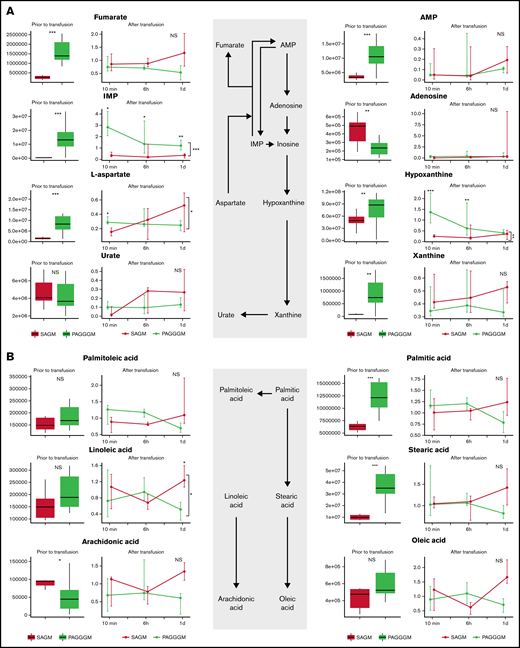
Metabolome of RBCs in stored in SAGM and PAGGGM. Purine (A) and free fatty acid metabolism (B) comparing 35-day stored RBCs in SAGM and 35-day stored RBCs in PAGGGM. The boxplots show metabolite concentrations in RBCs before transfusion. Line plots indicate the median with 25th and 75th percentile of metabolite concentrations over time in the recovered RBCs, up to 1 day after transfusion. *P < .05, **P < .01, and ***P < .0001; NS, not statistically significant.
Metabolome of RBCs in stored in SAGM and PAGGGM. Purine (A) and free fatty acid metabolism (B) comparing 35-day stored RBCs in SAGM and 35-day stored RBCs in PAGGGM. The boxplots show metabolite concentrations in RBCs before transfusion. Line plots indicate the median with 25th and 75th percentile of metabolite concentrations over time in the recovered RBCs, up to 1 day after transfusion. *P < .05, **P < .01, and ***P < .0001; NS, not statistically significant.
Palmitic, stearic, and arachidonic acid were significantly higher in PAGGGM RBCs before transfusion, while in the restored cells, no difference was found. Linoleic acid was similar in PAGGGM and SAGM RBCs before transfusion, while 1 day after transfusion, lower levels were found in the PAGGGM RBCs.
Glycolysis metabolism 35 days after SAGM storage
After 35 days of storage, glycolysis activity is decreased (Figure 5). This was indicated by complete depletion of ATP levels, decreased DPG levels, and increased AMP levels compared with 2-day stored RBCs. In addition, the levels of several glycolysis metabolites (hexose phosphate; fructose-1,6-biphosphate; 2/3-phosphoglycerate; phosphoenolpyruvate; and pyruvate) were decreased in the 35-day SAGM-stored RBCs compared with 2-day SAGM-stored RBCs.

Metabolomics data of glycolysis-related metabolites comparing RBCs stored for 2 and 35 days in SAGM. The boxplots show metabolite concentrations in RBCs before transfusion. Line plots indicate the median with 25th and 75th percentile of metabolite concentrations over time in the recovered RBCs, up to 1 day after transfusion. *P < .05, **P < .01, and ***P < .0001; NS, not statistically significant.
Metabolomics data of glycolysis-related metabolites comparing RBCs stored for 2 and 35 days in SAGM. The boxplots show metabolite concentrations in RBCs before transfusion. Line plots indicate the median with 25th and 75th percentile of metabolite concentrations over time in the recovered RBCs, up to 1 day after transfusion. *P < .05, **P < .01, and ***P < .0001; NS, not statistically significant.
Directly after transfusion, glycolysis activity recovered, illustrated by immediate recovery of ATP levels. Furthermore, AMP and ADP levels were similar after transfusion. DPG and phosphoenolpyruvate remained higher in 2-day stored RBCs until 10 minutes after transfusion.
Redox metabolism
No evident effect of storage time was found in G6PD activity, which was similar in the 2- and 35-day stored RBCs (Figure 6). Only 6-phosphogluconate levels were significantly higher in 2-day stored RBCs before transfusion. However, this normalized directly after transfusion. Ribose-phosphate was higher in 2-day stored RBCs 6 hours after transfusion, while before transfusion, no effect was observed. In addition, no differences were found in sedoheptulose levels (Figure 7).
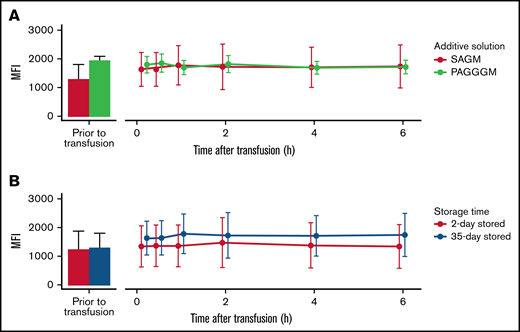
G6PD activity in 35-day stored RBCs. Comparing storage in SAGM with PAGGGM (A) and comparing 2- and 35-day stored RBCs (B). The bar chart represents the mean + standard deviation of G6PD activity of RBCs in the transfusion bag before transfusion. The line chart depicts the mean ± standard deviation of G6PD activity in the recovered RBCs after transfusion.
G6PD activity in 35-day stored RBCs. Comparing storage in SAGM with PAGGGM (A) and comparing 2- and 35-day stored RBCs (B). The bar chart represents the mean + standard deviation of G6PD activity of RBCs in the transfusion bag before transfusion. The line chart depicts the mean ± standard deviation of G6PD activity in the recovered RBCs after transfusion.

Metabolomics data of PPP and glutathione-related metabolites comparing RBCs stored for 2 days or 35 days in SAGM. The boxplots show metabolite concentrations in RBCs before transfusion. Line plots indicate the median with 25th and 75th percentile of metabolite concentrations over time in the recovered RBCs, up to 1 day after transfusion. *P < .05, **P < .01, and ***P < .0001; NS, not statistically significant.
Metabolomics data of PPP and glutathione-related metabolites comparing RBCs stored for 2 days or 35 days in SAGM. The boxplots show metabolite concentrations in RBCs before transfusion. Line plots indicate the median with 25th and 75th percentile of metabolite concentrations over time in the recovered RBCs, up to 1 day after transfusion. *P < .05, **P < .01, and ***P < .0001; NS, not statistically significant.
We did observe an increased breakdown of GSH and GSSG in the 35-day stored RBCs. Oxoproline levels were significantly higher in 35-day stored RBCs with similar levels of GSH but lower levels of GSSG, indicating an increased breakdown of GSH. After the transfusion, no differences in these levels were found in the cells that recovered.
Discussion
This is the first randomized trial investigating the PTR and metabolic recovery of transfused RBCs in different additive solutions using biotinylated autologous RBCs. We managed to recover transfused RBCs at 3 longitudinal time points up to 24 hours after transfusion and performed metabolomics of stored, transfused, and recovered RBCs. This study is unique in the field and shows for the first time the kinetics of the reversal of the storage lesion in vivo. Of note, we show the rate at which some pathways recover is very slow, which is relevant to hypoxic patients requiring transfusion. The main findings of this study are (1) longer storage time of RBCs is associated with a decreased PTR at 2 to 7 days after transfusion, (2) despite better preservation of the glycolysis, PPP, and redox metabolism, storage of RBCs in PAGGGM did not result in an increased PTR, and (3) despite the metabolic storage lesion, transfused RBCs that can survive the first day after transfusion are characterized by normalization of glycolysis of the pentose phosphate pathway, purine metabolism, and fatty acid metabolism.
A negative effect of storage time on PTR has been reported previously.1 However, in our study, we found a different timing of this effect. We found a significantly lower PTR 2 to 7 days after transfusion but no significant difference in the first 24 hours. This is in contrast with the study of Luten and colleagues, in which longer-stored RBCs had a decreased 24-hour PTR. Moreover, in the study by Luten and colleagues, the cells that survived the first 24 hours had a similar lifespan as the shorter-stored RBCs.1 First of all, it is worth noting that Luten and colleagues had relied on classic 51Chromium (Cr) radiolabeling to determine PTR, while here, we employed biotinylation strategies. The discrepancies between the 51Cr labeling method and biotinylation may be attributable to the different findings. Other significant differences include the type of recipient; while we examined healthy volunteers, in the study of Luten and colleagues, PTR was assessed in hematological patients. It has been shown that underlying disease such as sepsis is associated with markers of increased clearance, including decreased deformability.26,27
Here we show that in concordance with previously published work, storage in PAGGGM resulted in better preservation of glycolysis, redox metabolism, and purine metabolism.9,17 However, that this did not result in an increased PTR was unexpected, especially in light of recent double-blind, randomized studies showing that improvements in metabolic phenotypes correlate to improved PTR.28 Analogously, boosting RBC metabolism through storage in additive solution 7 (AS-7), which is a similar alkaline additive solution, showed an increased PTR.29,30 The main difference between these additive solutions is that AS-7 contains bicarbonate instead of guanosine and gluconate. How this may affect RBC clearance remains unclear.
After the transfusion, the metabolic profile of the RBCs improved. This recovery can be explained by a technical bias of the study design. Cells that are amenable to recovery from storage, biotinylation, and transfusion are those that survived intra and extravascular hemolysis via splenic sequestration and phagocytosis. Acknowledging the potential survival bias of this study, we can also speculate on the effect of exposure to the physiological extracellular pH in the blood circulation after transfusion. After 35 days of storage, the pH of RBC concentrates decreased to approximately 6.5,17 while the pH in the circulation is 7.45 under physiological circumstances. By infusing the RBCs in the circulation, the PFK and G6PD activity may normalize and thereby restore the glucose flux through glycolysis and PPP.
To investigate factors involved in RBC clearance, we assessed several prophagocytic and antiphagocytic markers. An increased C3 deposition was found in 35-day stored PAGGGM RBCs. It is unclear whether this concerns active C3 since the deposition of the nonactive component iC3b was also increased. Furthermore, none of the other assessed markers differed significantly. This may be explained that RBCs with a different phenotype were immediately captured in the spleen and were thus not represented in the blood samples after transfusion.
In this study, we showed that the metabolic profile is better in fresh RBCs. This has several potential clinical benefits: improved preservation of 2,3-DPG levels could potentially increase the capacity of RBCs to transport oxygen. In addition, increased PTR could reduce the number of RBC transfusions, reducing harmful side effects and costs. However, in critically ill patients, it is shown that transfusion of fresh RBCs does not improve outcomes compared with longer-stored RBCs.31-33 Nonetheless, for patients with a long-term dependency on RBC transfusion due to chronic blood disorders such as sickle cell anemia and thalassemia, it would be beneficial to increase the interval between transfusions.
This study has various strengths, including using an autologous transfusion in healthy volunteers. Using this approach, we ensured that each volunteer served as their own control, and we thereby excluded the immunological effects of antigen-mismatched blood. The most important limitation of this study is that the PTR was not assessed in the first 10 minutes after transfusion. It is therefore unknown whether transfused RBCs are cleared in the first 10 minutes. Subjects received a 2- and 35-day stored RBC concentrate simultaneously. We calculated the distribution of the 2 populations in the RBC concentrate and the distribution of the transfused products in the recovered RBCs after transfusion. If a difference in the ratio before and after transfusion was found, this would suggest that one population was cleared faster than the other. However, on a group level, no statistically significant difference was found to indicate a relatively faster clearance of 2- or 35-day stored RBCs in the first 10 minutes. It is possible that our study was not sufficiently powered to detect these differences or that this difference is not clinically relevant. A more precise method to estimate clearance in the first 10 minutes would be to precisely assess circulating volume, followed by a calculation of the expected fraction of bioRBCs and comparison with the measured fraction of bioRBCs. Another limitation is that we infused 25 mL per RBC concentrate. It is unclear how fast the spleen is saturated by RBCs and, therefore, how these results can be extrapolated to a standard RBC concentrate that contains 300 mL. The inclusion of only male subjects is also a limitation. This was necessary to guarantee the safety of 2 blood donations within 33 days in our study subjects. In addition, the effect of the short donation interval on the quality of the fresh RBC concentrate is unclear. We cannot exclude that relatively more young RBCs were donated in the second blood donation. Our study is also biased toward testing the metabolism of the cells that could be recovered upon transfusion, making the cells more likely to be metabolically divergent (ie, the ones carrying the most damage upon storage) and less likely to be recovered from the bloodstream of autologous recipients. And finally, due to the small sample size and the exploratory character of this study, no Bonferroni correction was applied in the metabolomics analysis. This may have resulted in a type 1 error. However, we assessed multiple metabolites in several prespecified pathways, and as the majority of the metabolites were affected, we believe that the chance of a type 1 error is limited.
In conclusion, despite a better metabolic profile of PAGGGM RBCs, PAGGGM storage did not lead to a higher PTR. Therefore, storage PAGGGM is not a superior alternative for storage in SAGM. Furthermore, the metabolic storage lesion was corrected within a day after transfusion. Finally, 35 days of storage resulted in a lower PTR compared with 2 days of storage.
Acknowledgments
The authors thank Rob Hoenderdaal, Brunette Daal, Davina Sijbrands, Jos Lorinser, Berend Hooibrink, Toni Capel, and Kim Brandwijk for technical support.
This study was supported in part by research funding from Sanquin Bloodbank to A.P.J.V., A.L.P., R.B., and D.K. A.D. was supported by funds from the National Institute of General and Medical Sciences (RM1GM131968) and the National Heart, Lung, and Blood Institute (R01HL146442, R01HL149714, R01HL148151, and R21HL150032).
Authorship
Contribution: S.d.B., A.-L.P., A.P.J.V., D.d.K., and R.v.B. were involved in the design of the study; S.d.B., A.P.J.V., A.D’A., D.d.K., and R.v.B. were involved in the management, data analysis, and interpretation of the data and writing of the manuscript; C.V. was involved in the management of the study; S.d.B., M.W., F.E.H.P.v.B., A.D., B.M.B., J.A.R., A.D’A., and A.H.A.A. were involved with the data collection and sample analysis; and all authors critically reviewed the manuscript.
Conflict-of-interest disclosure: Though unrelated to the contents of this manuscript, A.D’A. declares he is a founder of Omix Technologies Inc and Altis Biosciences, as well as a SAB member for Hemanext Inc and Forma Therapeutics and consultant for Rubius Therapeutics. The remaining authors declare no competing financial interests.
Correspondence: Robin van Bruggen, Department of Blood Cell Research, Plesmanlaan 125, H1, 1066 CX Amsterdam, The Netherlands; e-mail: r.vanbruggen@sanquin.nl.

