

Key Points
Twenty percent of bone marrow biopsies can be omitted by combining clinical data and NGS to assess risk of bone marrow disease before biopsy.
Disease in the bone marrow is rarely observed in patients with isolated neutropenia.

Abstract
Bone marrow specimens are the core of the diagnostic workup of patients with cytopenia. To explore whether next-generation sequencing (NGS) could be used to rule out malignancy without bone marrow specimens, we incorporated NGS in a model to predict presence of disease in the bone marrow of patients with unexplained cytopenia. We analyzed the occurrence of mutations in 508 patients with cytopenia, referred for primary workup of a suspected hematologic malignancy from 2015 to 2020. We divided patients into a discovery (n = 340) and validation (n = 168) cohort. Targeted sequencing, bone marrow biopsy, and complete blood count were performed in all patients. Mutations were identified in 267 (53%) and abnormal bone marrow morphology in 188 (37%) patients. Patients with isolated neutropenia had the lowest frequency of both mutations (21%) and abnormal bone marrow morphology (5%). The median number of mutations per patient was 2 in patients with abnormal bone marrow morphology compared with 0 in patients with a nondiagnostic bone marrow morphology (P < .001). In a multivariable logistic regression, mutations in TET2, SF3B1, U2AF1, TP53, and RUNX1 were significantly associated with abnormal bone marrow morphology. In the validation cohort, a model combining mutational status and clinical data identified 34 patients (20%) without abnormal bone marrow morphology with a sensitivity of 100% (95% confidence interval: 93%-100%). Overall, we show that NGS combined with clinical data can predict the presence of abnormal bone marrow morphology in patients with unexplained cytopenia and thus can be used to assess the need of a bone marrow biopsy.
Introduction
Peripheral blood cytopenia is often found in the elderly population.1 As the etiology of cytopenia varies widely, from benign vitamin deficiency to acute leukemia, establishing a diagnosis in patients with cytopenia can be challenging. Myelodysplastic syndrome (MDS), a condition frequently suspected in patients referred with cytopenia, is defined by >10% dysplastic cells in 1 or more of the major myeloid lineages, although in some cases solely by a characteristic cytogenetic abnormality.2 For patients with cytopenia not fulfilling the criteria for MDS or other hematologic disorders, the diagnostic entity of idiopathic cytopenia of undetermined significance (ICUS) has been introduced.3 With the increasing availability of targeted sequencing, somatic mutations have been identified in myeloid malignancies4-7 but also in seemingly healthy persons and patients with cytopenia, and these cases have been designated clonal hematopoiesis of indeterminate potential (CHIP)8,9 and clonal cytopenia of undetermined significance (CCUS),10,11 respectively.
Bone marrow biopsy, in this study equivalent to a morphologic and immunohistochemical examination of bone marrow biopsy and aspirate, is currently the sine qua non in the diagnostic workup of patients with cytopenia suspected of a hematologic malignancy, whereas next-generation sequencing (NGS) is mostly used as an add-on to assist in prognostication and subclassification once a diagnosis has been established. Several studies have investigated the prognostic impact of somatic mutations in myeloid malignancies,12-16 and it has been shown that the risk of progression to a myeloid neoplasm is significantly higher in CCUS than ICUS, with risk being only 1% per year for patients with ICUS,17 whereas risk for patients with CCUS is 10% to 20% per year.17 Thus, determining whether patients with cytopenia carry somatic mutations is important when assessing prognosis and disease trajectory.
However, as somatic mutations are found in a variety of individuals, ranging from healthy persons to patients with malignant disease, the diagnostic utility of NGS is not yet clearly defined. Previous studies have shown that the majority of patients undergoing diagnostic work-up for cytopenia are diagnosed with ICUS or CCUS rather than MDS.11,18 Hence, if patients with cytopenia can be stratified up front, extensive workup can be focused on patients with high risk of hematologic malignancy, and unnecessary procedures may be avoided in the remaining patients. As NGS can detect somatic mutations with comparable results in peripheral blood and bone marrow specimens,19-21 targeted NGS of peripheral blood DNA is a minimally invasive diagnostic tool, which may potentially be used to assess the need for bone marrow biopsies in the diagnostic workup of cytopenia.
In the present study, we investigated the occurrence of mutations in genes frequently mutated in myeloid malignancies in patients with cytopenia referred for primary diagnostic workup and combined mutational status with clinical data in a model to estimate the risk of bone marrow disease.
Methods
Patients
This study retrospectively included 508 patients referred for hematologic assessment of cytopenia at the Department of Hematology, Rigshospitalet, where NGS of genes associated with myeloid malignancies had been performed at the Department of Clinical Genetics, Rigshospitalet, between 2015 and 2020. All patients with a suspected hematologic malignancy are referred to the Department of Hematology, Rigshospitalet, with a catchment population of ∼1 million. Thus, patients had not been examined by a hematologist prior to referral for diagnostic workup of cytopenia at the department.
Patients were excluded if the time between NGS and bone marrow biopsy exceeded 6 months. Patients diagnosed with a hereditary myeloid neoplasm and patients with a history of hematologic disease were excluded, and common causes of cytopenia like vitamin deficiencies had been ruled out. Patients without available bone marrow biopsy were also excluded (supplemental Figure 1). Peripheral blood cytopenia was defined as platelets < 150 × 109/L, absolute neutrophil count < 1.8 × 10⁹/L, and hemoglobin (Hgb) < 11.8 g/dL (7.3 mmol/L) and < 13.4 g/dL (8.3 mmol/L) for women and men, respectively.
NGS, complete blood count, and bone marrow biopsy were performed in all included patients. Cytogenetic analysis (G-band karyotyping) was performed in 90% of patients and flow cytometry in 40%. Diagnoses were defined according to the World Health Organization 2016 classification of myeloid neoplasms2 and previously defined criteria for ICUS and CCUS.10,11,22
The study was approved by the Danish Patient Safety Authority (reference ID: 31-1521-430) and the Danish Data Protection Agency (reference ID: P-2020-930) and was conducted according to the Declaration of Helsinki.
NGS
Patient samples were analyzed using a panel of 20 genes associated with myeloid malignancies (supplemental Table 1). Sequencing material was peripheral blood in 256 of 508 (56%) cases and bone marrow in 222 of 508 (44%) cases.
The Ion Chef System was used for automated Ampliseq library, template preparation, and chip loading. Ion Proton was used for sequencing. A coverage of a minimum of 500 reads per base position was required for reporting of variants with a variant allele frequency (VAF) down to 5%.
To identify and classify variants (base substitutions, minor insertions, and deletions), the sequencing results were analyzed with the Torrent Suite and Ion Reporter software (Thermo Fisher) and Alamut Visual (Interactive Biosoftware). Variants were classified in 5 categories: pathogenic, likely pathogenic, variant of unknown significance (VUS), likely benign, and benign according to guidelines stated in Li et al.23 Only variants classified as pathogenic, likely pathogenic, or VUS were considered clinically relevant.
Statistics
For prediction modeling, patients were divided into a discovery (n = 340) and validation (n = 168) cohort using random sampling (Table 1; supplemental Table 2). The outcome of interest was defined as abnormal bone marrow morphology vs nondiagnostic bone marrow morphology (supplemental Table 3) as we aimed to identify patients for whom a bone marrow biopsy would bring no additional clarification of diagnosis. Abnormal bone marrow morphology is defined as cases where morphologic and immunohistochemical examination of the bone marrow specimen established a definitive diagnosis. As predictors, we used only data that are obtainable without a bone marrow biopsy, including sequencing results, age, sex, Hgb level, and platelet and neutrophil counts.
Characteristics of the study cohort of 508 patients with cytopenia
| Entire cohort | Discovery cohort | Validation cohort | |
|---|---|---|---|
| Number of patients | 508 | 340 | 168 |
| Age, median (IQR), y | 68 (57-75) | 69 (57-76) | 67 (56-73) |
| <50 | 90 (18%) | 62 (18%) | 28 (17%) |
| 50-74 | 293 (58%) | 186 (55%) | 107 (64%) |
| ≥75 | 125 (25%) | 92 (27%) | 33 (20%) |
| Sex, male/female | 288/220 | 195/145 | 93/75 |
| Diagnosis | |||
| ICUS | 181 (36%) | 117 (34%) | 64 (38%) |
| CCUS | 132 (26%) | 85 (25%) | 47 (28%) |
| MDS | 93 (18%) | 62 (18%) | 31 (18%) |
| CMML | 22 (4%) | 20 (6%) | 2 (1%) |
| AML | 37 (7%) | 26 (8%) | 11 (7%) |
| Other | 48 (8%) | 30 (9%) | 13 (8%) |
| One or more mutations present | 267 (53%) | 179 (53%) | 88 (52%) |
| Cytogenetics | |||
| Normal karyotype | 351 (69%) | 229 (67%) | 122 (73%) |
| Aberrant karyotype | 107 (21%) | 78 (23%) | 29 (17%) |
| Analysis not performed | 50 (10%) | 33 (10%) | 17 (10%) |
| Hemoglobin, median (IQR), mmol/L | 6.9 (5.8-8.0) | 6.8 (5.7-8.0) | 7.1 (6.0-8.0) |
| Platelet count, median (IQR), ×109/L | 118 (74-216) | 120 (74-213) | 114 (72-219) |
| Absolute neutrophil count, median (IQR), ×109/L | 2.2 (1.1-4.2) | 2.4 (1.1-4.7) | 1.8 (1.1-3.4) |
Genes mutated in less than 10 patients in the discovery cohort were pooled in 2 groups as they were too few for reliable statistical modeling. NRAS, KRAS, CBL, IDH1, and IDH2 were grouped together as “high-risk” mutations,24 whereas CEBPA, GATA2, ETV6, EZH2, and SETBP1 were categorized as “other.” JAK2 was sorted in either high risk or other depending on whether the VAF of the clone was above or below 10%, respectively.8,9,25,26
In the discovery cohort, we constructed a prediction model using multivariable logistic regression with backward selection of variables based on likelihood ratio test. Furthermore, we defined a cutoff to identify low-risk patients, calculated as the highest possible probability of abnormal bone marrow morphology that still preserved a sensitivity of 95% (supplemental Figure 2). We then used the model and cutoff to identify patients with low risk of abnormal bone marrow morphology in the validation cohort. Finally, we repeated the model construction and validation but restricted to patients presenting with anemia. In this model, the number of other cell lines affected was included as a single variable.
All statistical analyses were performed in R version 3.5.2. We used the Mann-Whitney U test or Kruskal-Wallis test for continuous variables and used Pearson’s χ2 test or Fisher’s exact test for categorical variables. We defined statistical significance as P < .05. All reported P values are 2-sided.
Results
Mutations
Mutations were present in 267 of the 508 patients (53%; Figure 1). The median number of mutations per patient was 1 (Interquartile range [IQR]: 0-2; range: 0-6). In patients carrying at least 1 mutation, the median number of mutations was 2 (IQR: 1-3), and the median VAF was 35% (IQR: 12%-44%). The median VAF in patients with CCUS was 22% (IQR: 9%-40%), which was significantly lower than in MDS (median: 36%; IQR: 23%-44%), acute myeloid leukemia (AML; median: 40%; IQR: 17%-47%), and patients with chronic myelomonocytic leukemia (CMML) (median: 41%; IQR: 37%-45%; all P < .001; supplemental Figure 3). Among patients with mutations, the most prominent diagnosis was CCUS (45.2%), followed by MDS (30.0%), AML (11.5%), and CMML (8.1%).
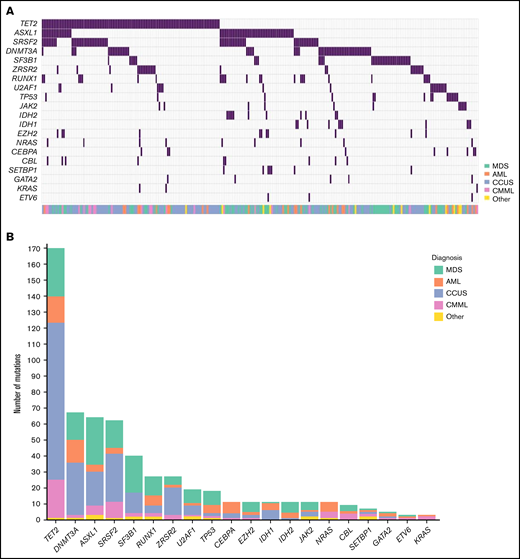
Mutational landscape of 508 patients with cytopenia. (A) Distribution of mutations in 20 genes associated with myeloid malignancies in 508 cases of patients with cytopenia. (B) Frequency of mutations identified in the cohort with diagnosis indicated by the respective colors.
Mutational landscape of 508 patients with cytopenia. (A) Distribution of mutations in 20 genes associated with myeloid malignancies in 508 cases of patients with cytopenia. (B) Frequency of mutations identified in the cohort with diagnosis indicated by the respective colors.
Twenty percent of the mutations detected across the entire cohort were classified as VUS. We found the smallest proportion of VUS among patients with MDS (14%) and the highest among patients with CCUS (24%; supplemental Table 4).
The most frequently mutated genes were TET2, DNMT3A, ASXL1, and SRSF2, which were each mutated in at least 10% of patients. We detected an SF3B1 mutation in 37 (7%) patients, of whom 23 (62%) presented with isolated anemia. Seventy percent of patients carrying an SF3B1 mutation had a malignant hematologic disorder: MDS (60%), CMML (5%), or myeloproliferative neoplasm (MPN) (5%). Of the patients with MDS with an SF3B1 mutation, 72% were of the subtype with ring sideroblasts.
Patients with CMML had a median of 3 mutations (IQR: 2-4). This was significantly higher than patients with CCUS (median: 2; IQR: 1-2; P < .001) and patients with MDS (median: 2; IQR: 1-3; P = .02). There was no significant difference in number of mutations between the other disease groups (supplemental Figure 4). Moreover, 11 of 22 (50%) patients with CMML had a TET2 mutation with a comutation in either SRSF2 or ZRSR2. Eight of the patients (36%) with CMML carried a mutation in the high-risk genes NRAS, KRAS, or CBL.
The number of mutations increased with age. In patients younger than 50 years, 16% carried 1 or more mutations. This increased to 56% in patients between 50 and 75 years and to 71% in patients older than 75 years. Accordingly, the number of ICUS cases decreased with age, and with a median age of 59 years (IQR: 44-70 years), patients with ICUS were significantly younger than patients with CCUS (median: 74 years; IQR: 67-78 years), MDS (median: 70 years; IQR: 64-77 years), or CMML (median: 72 years; IQR: 69-76 years; all P < .001). The number of CCUS cases increased with age, and CCUS was the most prominent diagnosis among patients older than 75 years (53 of 125; 42%; Figure 2).
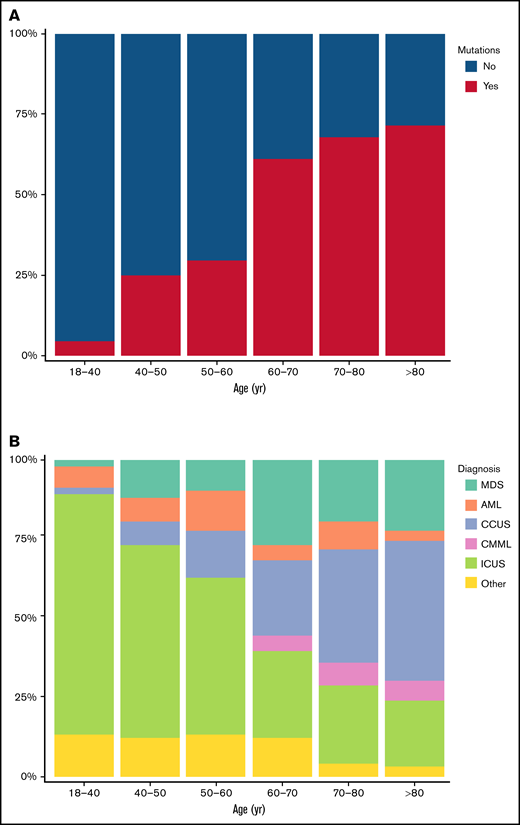
Distribution of mutations and diagnoses in different age groups. (A) Proportion of patients with 1 or more mutations detected in the indicated age groups. (B) Proportion of patients with each of the shown diagnoses, stratified into 6 age groups.
Distribution of mutations and diagnoses in different age groups. (A) Proportion of patients with 1 or more mutations detected in the indicated age groups. (B) Proportion of patients with each of the shown diagnoses, stratified into 6 age groups.
Cytogenetics
Cytogenetic analysis was performed in 458 (90%) patients. Abnormal karyotypes were detected in 107 of 458 (23%) patients. A complex karyotype, meaning a karyotype with at least 3 chromosomal aberrations, was observed in 12 (11%) of the patients with cytogenetic changes, and 11 of 12 (92%) had a malignant hematologic disease, whereas the 1 remaining patient had CCUS. Of patients with abnormal karyotype and malignant hematologic disease, 57 (80%) had mutations detected, whereas 14 (20%) did not.
Seventy-one of the 107 (66%) patients with cytogenetic changes in the bone marrow also had mutations detected, whereas 36 (33%) only had cytogenetic changes. Of the patients only with cytogenetic changes, 21 (58%) did not have malignant hematologic disease. However, of these, 9 of 21 (43%) had a karyotype solely with loss of chromosome Y (supplemental Table 5). In patients with both cytogenetic changes and mutations, the median number of mutations was 2 (IQR: 1-3.5; range: 1-6), and 15 (21%) had mutations in genes of the high-risk group.
Cytopenia
Of all patients, 43% presented with an isolated cytopenia, 38% with 2 cytopenias, and 19% with pancytopenia (Figure 3; supplemental Table 6). The most common presentations were isolated anemia and the combination of anemia with thrombocytopenia, each accounting for 22% of patients. Additionally, isolated anemia was seen in 52% of patients presenting with isolated cytopenia, whereas isolated thrombocytopenia (31%) and isolated neutropenia (17%) were less common in this group of patients. In patients with 2 cytopenias, the combination of anemia with thrombocytopenia was predominant (58%), whereas the combinations of anemia with neutropenia and thrombocytopenia with neutropenia each accounted for 21%.

Distribution of the types of cytopenia that patients presented with. For each of the indicated diagnoses, the number of patients with 1, 2, or 3 cytopenias (ie, an isolated cytopenia, bicytopenia, or pancytopenia, respectively) is shown, with the colors of the bars representing the type of cytopenia.
Distribution of the types of cytopenia that patients presented with. For each of the indicated diagnoses, the number of patients with 1, 2, or 3 cytopenias (ie, an isolated cytopenia, bicytopenia, or pancytopenia, respectively) is shown, with the colors of the bars representing the type of cytopenia.
The frequency of mutations varied according to the types of cytopenia. We found the highest frequency of mutations in patients presenting with the combination of anemia with neutropenia, where 71% had at least 1 mutation, followed by patients with isolated anemia (63%), patients with pancytopenia (56%), and the combination of anemia with thrombocytopenia (56%).
Patients presenting with isolated neutropenia had the lowest frequency of mutations. In this group of 38 patients, 8 (21%) patients carried mutations. Nearly three quarters had ICUS (28 of 38, 74%), and 8 (21%) had CCUS. Only 2 of 38 (5%) patients with isolated neutropenia had a malignant hematologic disorder, both being T-cell large granular lymphocytic leukemia. The median VAF of mutations in patients with isolated neutropenia was 11.5% (IQR: 7%-26%; range: 6%-51%), and 36% of the mutations were variants of uncertain significance. We found that 6 of 8 patients with isolated neutropenia and mutations carried a mutation in genes associated with CHIP (DNMT3A, TET2, and ASXL1).8,9 Two patients carried a mutation in IDH1, which has been associated with a poor outcome in myelodysplastic syndromes27,28 but is also found in CHIP.29 During the follow-up period (median: 2.5 years), none of the patients with isolated neutropenia experienced disease progression. However, 2 patients (5%) died of nonhematologic causes.
Abnormal bone marrow morphology
In total, we found abnormal bone marrow morphology in 188 (37%) patients. We detected mutations in 77% of patients with abnormal bone marrow morphology and in 38% of the patients with a nondiagnostic bone marrow morphology (P < .001). Patients with abnormal bone marrow morphology had a median of 2 mutations (IQR: 1-3) compared with a median of 0 (IQR: 0-1) in patients with a nondiagnostic bone marrow morphology (P < .001). Furthermore, we observed associations between type of cytopenia and abnormal bone marrow morphology (supplemental Table 7); most notably, 34% of patients with abnormal bone marrow morphology had pancytopenia, whereas this was only the case for 10% of patients with a nondiagnostic bone marrow morphology (P < .001). Also, the severity of cytopenia was associated with abnormal bone marrow morphology (supplemental Table 8).
Prediction model
In the discovery cohort (n = 340), we investigated the association between abnormal bone marrow morphology and mutations in certain genes, as well as age, sex, Hgb level, and platelet and neutrophil counts. Mutations in TET2, SF3B1, U2AF1, TP53, and RUNX1 and in the genes in the high-risk and other group were all significantly associated with a higher risk of abnormal bone marrow morphology (Figure 4). Mutations in DNMT3A, SRSF2, ZRSR2, and ASXL1 did not show a statistically significant effect, although ASXL1 showed a positive association just below the significance threshold (odds ratio [OR]: 2.65; 95% confidence interval [CI]: 0.99-7.18; P = .052). Aside from mutational status, we found an association between abnormal bone marrow morphology and anemia, as well as severe neutropenia (defined as absolute neutrophil count < 0.8 × 10⁹). Severe anemia (defined as Hgb < 10 g/dL [Hgb < 6.2 mmol/L]) showed a strong association (OR: 6.45; 95% CI: 2.98-14.82; P < .001).

Odds ratios for the association between abnormal bone marrow morphology and the depicted variables derived from multivariable logistic regression.P value and OR with corresponding 95% CI for the association with abnormal bone marrow morphology is shown for each variable. Severe anemia: Hgb < 10 g/dL. Mild anemia: Hgb ≥ 10 - < 11.8 g/dL for females and Hgb ≥ 10 - < 13.4 g/dL for males. Severe thrombocytopenia: Platelets (plts) < 30 × 109/L. Moderate thrombocytopenia: plts ≥ 30 × 109/L - < 90 × 109/L. Mild thrombocytopenia: plts ≥ 90 × 109/L - < 150 × 109/L. Severe neutropenia: Absolute neutrophil count (ANC) < 0.8 × 10⁹/L. Mild neutropenia: ANC ≥ 0.8 × 10⁹/L - < 1.8 × 10⁹/L.
Odds ratios for the association between abnormal bone marrow morphology and the depicted variables derived from multivariable logistic regression.P value and OR with corresponding 95% CI for the association with abnormal bone marrow morphology is shown for each variable. Severe anemia: Hgb < 10 g/dL. Mild anemia: Hgb ≥ 10 - < 11.8 g/dL for females and Hgb ≥ 10 - < 13.4 g/dL for males. Severe thrombocytopenia: Platelets (plts) < 30 × 109/L. Moderate thrombocytopenia: plts ≥ 30 × 109/L - < 90 × 109/L. Mild thrombocytopenia: plts ≥ 90 × 109/L - < 150 × 109/L. Severe neutropenia: Absolute neutrophil count (ANC) < 0.8 × 10⁹/L. Mild neutropenia: ANC ≥ 0.8 × 10⁹/L - < 1.8 × 10⁹/L.
In the discovery cohort, a predicted probability of abnormal bone marrow morphology of 11.4% marked the cutoff at which the sensitivity was 95% (supplemental Figure 2A). In the validation cohort, 34 of 168 patients (20%) had a predicted probability below 11.4%, and we defined these as predicted low-risk patients. All these patients had a nondiagnostic bone marrow morphology, corresponding to a sensitivity of 100% (95% CI: 93%-100%). The negative predictive value of being a low-risk patient was 100% (95% CI: 90%-100%; supplemental Table 9). Sensitivity, specificity, and predictive values at various cutoffs for predicted probability of abnormal bone marrow morphology were explored (supplemental Table 10).
Of the 34 predicted low-risk patients, 28 (82%) had ICUS and 6 (18%) had CCUS. The mutations found in the patients with CCUS were TET2, DNMT3A, and ZRSR2. Isolated thrombocytopenia was the most prevalent presentation, seen in 14 (41%) patients, followed by isolated neutropenia, seen in 9 (26%). No patients presenting with isolated anemia, pancytopenia, or the combination of anemia with neutropenia was predicted low risk. During the follow-up period (median: 2.4 years), only 1 of the 34 patients progressed, who was a patient with CCUS developing CMML.
Prediction model for patients with anemia
The impact of mutations in certain genes on the risk of abnormal bone marrow morphology is likely different depending on which type of cytopenia a patient presents with, and the number of possible interactions between the type of cytopenia and mutated genes is larger than what can be explored in a data set of this size. Instead, to explore the potential difference in impact of mutated genes depending of type of cytopenia, we repeated the steps of the model construction and validation restricted to patients with anemia (n = 241 in the discovery cohort, n = 121 in the validation cohort).
Among patients with anemia in the discovery cohort, mutations in SF3B1, TP53, and the high-risk and other groups were significantly associated with abnormal bone marrow morphology. Pancytopenia was strongly associated with abnormal bone marrow morphology (OR: 4.58; 95% CI: 1.96-11.2; P < .001), whereas 2 cytopenias were not associated with an elevated risk compared with isolated anemia (OR: 0.62; 95% CI: 0.29-1.31; P = .2; supplemental Figure 5).
Using a cutoff of 16.3% to define low-risk patients (supplemental Figure 2B), the model classified 15 (12%) patients in the validation cohort as low risk. None of these patients had abnormal bone marrow morphology, resulting in a sensitivity of 100% (95% CI: 93%-100%). The negative predictive value of being predicted low risk was 100% (95% CI: 78%-100%; supplemental Table 11). Sensitivity, specificity, and predictive values at various cutoffs for predicted probability of abnormal bone marrow morphology were explored (supplemental Table 12).
Of the 15 patients predicted low risk by the anemia-specific model, 13 (87%) had ICUS. Ten of the 15 patients (67%) presented with the combination of anemia and thrombocytopenia and the remaining 5 patients with the combination of anemia and neutropenia. No patients progressed during the follow-up period (median: 2.1 years).
Discussion
This study on a cohort of 508 patients with cytopenia undergoing primary workup of suspected hematologic malignancy showed that mutational status combined with age, sex, Hgb level, and platelet and neutrophil counts with high sensitivity could predict which patients had a low risk of abnormal bone marrow morphology, thus potentially making a bone marrow biopsy unnecessary in this subset of patients corresponding to 20% of the validation cohort. As the study cohort was not selected for the diagnosis obtained after primary workup of cytopenia and includes patients found to have non-neoplastic hematologic disorders (eg, aplastic anemia) or nonhematologic causes of cytopenia (eg, Felty’s syndrome), the model is broadly applicable in patients referred for primary hematologic workup of cytopenia.
One of the 34 patients identified with a nondiagnostic bone marrow morphology by the model progressed during the follow-up period, developing CMML. Although the model identified patients with low risk of abnormal bone marrow morphology, it did not incorporate a subsequent risk of developing a hematologic disorder. Nevertheless, previous studies have shown that patients with CCUS are at risk of developing a myeloid malignancy17 and therefore should be observed for disease progression, regardless of whether a bone marrow biopsy was performed at primary workup.
In this study, we found a strong association between SF3B1 and abnormal bone marrow morphology both across the entire discovery cohort and specifically in patients with anemia, which is in accordance with SF3B1 being linked to the presence of ring sideroblasts in the bone marrow and MDS with ring sideroblasts subtype.30-32 A mutated SF3B1 should therefore be considered an indication for bone marrow biopsy.
Of the other spliceosome genes, U2AF1 was also strongly associated with abnormal bone marrow morphology. Conversely, we did not find an association between abnormal bone marrow morphology and SRSF2 or ZRSR2 when mutations in other genes were accounted for, meaning a mutation in SRSF2 or ZRSR2 alone does not indicate whether a patient has abnormal morphology in the bone marrow. Thus, we find that the implications of mutations in the spliceosome genes are diverse.
DNMT3A, TET2, and ASXL1 are the most frequently mutated genes in CHIP8,9 and have been grouped together as DTA mutations in several studies.33-35 Nonetheless, in our study, the effect of the 3 genes on the risk of abnormal bone marrow morphology differed. TET2 was significantly associated with abnormal bone marrow morphology, whereas ASXL1 was borderline significant, and no association was found with DNMT3A (Figure 4). Therefore, although DTA mutations are the most frequent in CHIP, their impact on the risk of abnormal bone marrow morphology is not uniform and should be considered separately in patients with cytopenia.
CCUS was the predominant diagnosis among patients older than 75 years. The increasing availability of NGS in the clinical setting provides an explanation for cytopenia in many elderly patients. However, it must be acknowledged that clonal hematopoiesis is present in 10% to 60% of healthy persons in this age group.8,9,36 -38 Hence, we cannot know for certain that the detected mutation is the cause of the cytopenia as some patients might concurrently have clonal hematopoiesis and cytopenia from other causes. Long-term studies investigating the specific genes, type of mutation, and VAF may be able to clarify this matter.
In patients presenting with isolated neutropenia, we found that only 5% had a malignant hematologic disease in the bone marrow and only 21% carried mutations, all of whom had CCUS. Moreover, the mutations detected were in genes associated with clonal hematopoiesis.8,9,29 These findings indicate that patients with isolated neutropenia represent a subset of patients with cytopenia in whom the risk of a malignant hematologic disease is low, and consequently, a different approach to these patients might be appropriate. However, these findings should be confirmed in other studies.
This study did not consider patient comorbidities, aside from previous history of hematologic diseases, although inclusion of patient comorbidities could improve our understanding of patients with ICUS and CCUS. Previously, it has been proposed that a diagnosis of ICUS or CCUS should only be made if the cytopenia cannot be explained by another disease.39 However, careful consideration is required before ascribing a cytopenia to a comorbidity as the relationship between cytopenia and symptoms from other organ systems might be complex. The recently discovered VEXAS syndrome is an example of a disorder with both rheumatologic and hematologic features caused by a pathogenic mutation in the hematologic stem cells.40,41 Investigating comorbidities in patients with cytopenia could potentially strengthen our model and improve identification of patients with nonhematologic cytopenia.
In this study, patients were sequenced with a panel consisting of 20 genes related to myeloid malignancies. Using a larger gene panel could presumably have increased the number of patients with mutations and subsequently affected the predictive values of our models. However, Malcovati et al17 showed only a small increase in sensitivity and negative predictive value when comparing a panel of 20 and 40 genes. Furthermore, sample material for sequencing was peripheral blood in 56% of cases and bone marrow in 44% of cases, which is a limitation of the study as, preferably, all material for sequencing would have been peripheral blood. Discordance between sequencing on peripheral blood and bone marrow regarding the detection of mutations is mostly seen in smaller clones, which are then not detected in peripheral blood. Yet, previous studies have shown high concordance between sequencing performed on peripheral blood and bone marrow ranging from 96% to 99.8%,19-21 indicating that the findings of our study can still serve as proof-of-concept of the utility of NGS in assessing risk of disease in the bone marrow of patients with cytopenia before performing a bone marrow biopsy.
This is the first study combining clinical data and NGS to predict the risk of abnormal bone marrow morphology in patients referred for primary hematologic workup of a peripheral blood cytopenia. This is a retrospective study, and findings should be validated in other, preferably prospective, cohorts. Cytopenia is common in the elderly population, and with an increasing average age, optimized diagnostic methods to identify patients at risk are warranted. We have developed an online diagnostic tool based on the model to assess the risk of abnormal bone marrow morphology in individual patients, available on the following link: https://cytopenia.shinyapps.io/Cytopenia_BM_prediction/.
Acknowledgments
This study was supported by a grant from Novo Nordisk Foundation, Novo Nordisk Foundation Center for Stem Cell Biology, DanStem grant NNF17CC0027852 (to D.T., M.T., K.G., and J.W.H.), and the Rigshospitalet’s Research Foundation (to D.T.). The project is part of the Danish Research Center for Precision Medicine in Blood Cancers funded by Danish Cancer Society grant R223-A13071.
Funding support for this article was provided by the Novo Nordisk Foundation (NNF17CC0027852), Rigshospitalet's Research Foundation, Danish Cancer Society (R223-A13071).
Authorship
Contribution: D.T., M.T., and J.W.H. conceived the study and wrote the manuscript; D.T. and M.T. performed statistical analyses; and J.B.C. and M.K.A. analyzed the sequencing data; and all authors contributed to the manuscript and interpretation of the data and approved the final version of the manuscript.
Conflict-of-interest disclosure: The authors declare no competing financial interests.
Correspondence: Jakob Werner Hansen, BRIC, Ole Maaløesvej 5, Bldg 2, 3rd Fl, Section 3733, 2200 Copenhagen, Denmark; e-mail: jakob.werner.hansen.01@regionh.dk.

