

Key Points
HDGF is secreted by and found in multiple myeloma cell extracellular vesicles; it activates AKT and sustains multiple myeloma cell growth.
HDGF polarizes naïve macrophages to an M1 phenotype and generates immunosuppressive M-MDSC.

Abstract
Identifying factors secreted by multiple myeloma (MM) cells that may contribute to MM tumor biology and progression is of the utmost importance. In this study, hepatoma-derived growth factor (HDGF) was identified as a protein present in extracellular vesicles (EVs) released from human MM cell lines (HMCLs). Investigation of the role of HDGF in MM cell biology revealed lower proliferation of HMCLs following HDGF knockdown and AKT phosphorylation following the addition of exogenous HDGF. Metabolic analysis demonstrated that HDGF enhances the already high glycolytic levels of HMCLs and significantly lowers mitochondrial respiration, indicating that HDGF may play a role in myeloma cell survival and/or act in a paracrine manner on cells in the bone marrow (BM) tumor microenvironment (ME). Indeed, HDGF polarizes macrophages to an M1-like phenotype and phenotypically alters naïve CD14+ monocytes to resemble myeloid-derived suppressor cells which are functionally suppressive. In summary, HDGF is a novel factor in MM biology and may function to both maintain MM cell viability as well as modify the tumor ME.
Introduction
The bone marrow (BM) microenvironment (ME) is thought to be a contributory factor in the progression from the asymptomatic stage of monoclonal gammopathy of undetermined significance (MGUS) to active multiple myeloma (MM). BM stromal cells interact with nascent tumor cells in myriad ways. For example, malignant cells secrete cytokines, chemokines, and growth factors that create a permissive environment for the tumor cells to proliferate. Additionally, it has more recently become clear that all cells shed extracellular vesicles (EVs) laden with cargo, including DNA, RNA species, proteins, phospholipids, and metabolites,1 which have the ability to modulate the state of the cell, releasing the EVs as well as cells in the ME.
Various studies have examined the cargo of MM exosomes and EVs2-4 as well as their biological impact on cells found in the BM ME. For example, MM cell-derived exosomes have been shown to induce interleukin-6 (IL-6) secretion by BM stromal cells, resulting in suppression of osteoblastic differentiation,5,6 thereby contributing to myeloma bone disease. Furthermore, exposure of macrophages to exosomes derived from human myeloma cell lines (HMCLs) results in their reprogramming to functional osteoclasts.7-9 EVs from MM cells with deletion of chromosome 13 strongly differentiate monocytes to an M2 supportive macrophage and/or tumor-associated macrophage (TAM) phenotype in a miR16-dependent fashion.10 There is evidence that MM EVs are taken up by human umbilical vein endothelial cells (HUVEC) and that this results in tube formation, proliferation, and increased vascular endothelial growth factor and IL-6 secretion by HUVEC.11 Treatment with bortezomib or lenalidomide has been shown to inhibit the proangiogenic potential of MM EVs.12 Finally, murine MM exosomes have been shown in vivo to reprogram the BM ME to enhance angiogenesis and create an immunosuppressive environment.13
Previous studies of MM EVs have focused on defining the activity of small EVs (<200 nM), which are mostly exosomes. Our group has previously characterized larger HMCL EVs (200-800 nM),14 and in this study, we investigated the cargo of MM EVs by comparing EVs from 9 HMCLs to EVs from in vitro generated plasma cells (IVPCs). Among the interesting proteins identified in the EVs, we demonstrated that MM-derived EVs contain a hepatoma-derived growth factor (HDGF), which drives the proliferation of hepatoma cells15 and many other types of cancer.16 Searching Vesiclepedia17 (a compendium of EV data) for HDGF revealed that it has been identified in EVs shed by numerous cancers, including glioblastoma, breast, colorectal, kidney, lung, ovarian, leukemia, and melanoma. Additionally, HDGF has been found in EVs from normal endothelial cells and mesenchymal stem cells but has never been described in MM-derived EVs.
Little is known about the function of HDGF in MM. The HDGF coding sequence is found on 1q21-23 and is part of the 1q amplification gene signature seen in some patients with MM.18 Of interest, 1q amplification is also a hallmark of hepatocellular carcinoma.19 Amplification of the 1q arm is found in 0% of MGUS, 45% of smoldering myeloma (SMM), 43% of newly diagnosed MM, and 72% of relapsed MM.20 A 1q gain in MM patients is associated with complex karyotypes, aggressive disease, and early progression after lenalidomide, bortezomib, and dexamethasone treatment.21,22 Moreover, MM cells treated with SAHA (suberoylanilide hydroxamic acid, a histone deacetylases inhibitor) become apoptotic, a state that is accompanied by changes in their expression profiles.23 HDGF was identified as one of the downregulated genes, suggesting that it is involved in maintaining MM homeostasis.
In this study, we describe for the first time that HMCL-derived EVs contain HDGF at levels significantly higher than in normal in vitro generated plasma cells (PCs). To understand the significance of this finding, we have carried out a variety of studies that demonstrate both autocrine and paracrine activities of HDGF. As a result of our work, we conclude that there is a biological role for HDGF in MM.
Materials and methods
The Mayo Clinic Institutional Review Board approved the study (number 1222-05), which was conducted according to the Declaration of Helsinki.
Cell lines, culture medium, and reagents
The HMCLs ANBL-6, the sister cell lines ALMC-1 and ALMC-2,24 DP-6, JMW, KAS-6/1, KP-6, MC-B11/14, MMF-1, and VP-6 have been previously described,25 as well as their culture conditions.14 IVPCs were generated as described.26 Briefly, peripheral blood B cells from healthy donors were activated in a 3-stage in vitro culture system using modifications of previously published protocols.27-30 Cells obtained at the conclusion of a 10-day incubation displayed an aggregate phenotype similar to in vivo PCs.26 Detailed information on reagents can be found in supplemental Methods and Reagents.
EV preparation
EVs were harvested from 9 HMCLs and pooled IVPCs generated from 3 individuals as described previously.14 Triplicate EV preparations were resuspended in Laemmli sample buffer with Halt Protease Inhibitor Cocktail, and lysates were cleared of insoluble material by centrifugation at 9000 ×g for 10 minutes at 4°C. Lysates were quantified with the bicinchoninic acid method (BCA kit).
Mass spectrometry
Please refer to supplemental Methods.
Gene expression profile analysis
Zhan and colleagues31 reported gene expression profiling (GEP) data from normal PCs and PCs from patients with MGUS, SMM, and MM and have made these data publicly available. These data were queried for mRNA levels of various EV proteins, including HDGF.
Immunoblotting
HMCLs (5 × 10⁶) were lysed and protein quantitated as above. 30 μg of protein lysate was heated to 70°C for 10 minutes, resolved on 4% to 20% Bio-Rad SDS-PAGE (sodium dodecyl-sulfate polyacrylamide gel electrophoresis), and transferred to Immun-Blot Low Fluorescence polyvinylidene difluoride (PVDF) membranes using a Trans-Blot Turbo Transfer System. Total protein on membranes was measured with the Li-Cor Revert system and used as a loading control. Membranes were blocked in Intercept blocking buffer for 1 hour at room temperature. Anti-human HDGF antibody was used at a 1:1000 dilution in Intercept blocking buffer + 0.2% Tween 20 for an hour, washed in TBS with Tween 20, followed by a 30-minute incubation with IRDye 800CW goat anti-rabbit antibody (Li-Cor) at 1:15 000. Membranes were visualized after washing on the Li-Cor Odyssey CLX. HDGF signal intensity was normalized to total inlane protein. For phospho-AKT westerns, serum-starved ALMC-1, ALMC-2, ANBL-6, and KAS-6/1 cells were incubated without stimulus or with 50 ng/mL or 500 ng/mL HDGF for 1 hour. As a positive control, HMCLs were stimulated with 50 ng/mL IL-6 for 10 minutes. Membranes were probed with antibodies to AKT, phospho-AKT, and β actin.
HDGF enzyme-linked immunosorbent assay (ELISA)
Levels of HDGF in HMCL-conditioned media were measured with an HDGF ELISA kit according to the manufacturer’s instructions. The conditioned media was collected from the same cultures that yielded the EV preparations. The media remaining after the high-speed centrifugation step that pellets the EVs (17 000 g for 45 minutes) was stored at −80°C before testing by ELISA.
HDGF knockdown with small interfering RNA (siRNA)
HDGF and nontargeting control pool siGenome siRNA duplexes were purchased from Dharmacon/Horizon Discovery Ltd. Transfection of the siRNA duplexes was achieved via electroporation as previously described.32 Briefly, cells were electroporated (225 V, 20 ms, 1 pulse) with either HDGF or nontargeting control siRNA, allowed to recover for 24 hours followed by a second transfection, and then plated in normal growth media. Twenty-four hours following the second transfection, the cells were washed once with saline and then cultured in normal growth media (10% fetal bovine serum [FBS] and 1 ng/mL IL-6) at 0.5 × 10⁶ cells per well in a final volume of 1 mL in a 24-well flat-bottom plate. Cells were cultured for 4 days. At 24, 48, 72, and 96 hours after set-up, cells were counted in quadruplicate.
Metabolic analysis of HMCLs
Before metabolic analysis, ALMC-2, ANBL-6, and DP-6 cells were washed twice with saline and incubated overnight in Iscove modified Dulbecco medium (IMDM) + 0.5% bovine serum albumin. A Seahorse XFe bioanalyzer was used to measure the extracellular acidification rate (ECAR) and oxygen consumption rate (OCR). Seahorse 96 well plates were first coated with Cell-Tak for 20 minutes. Cells were resuspended in Seahorse XF base media with or without phenol red. For OCR analysis, the media contained 10 mM glucose, 1 mM sodium pyruvate, and 2 mM glutamine, whereas, for ECAR, the media contained only 2 mM glutamine. The cells were resuspended in the appropriate media in the presence or absence of 20 ng/mL IL-6, 500 ng/mL HDGF, or the combination of the 2 cytokines and placed in a non-CO2 incubator at 37°C for 1 hour. ECAR and OCR analyses were conducted under basal conditions and after adding the following reagents: ECAR: 10 mM glucose, 1 μM oligomycin A, 100 μM 2-DG; and for OCR: 1 μM oligomycin A, 1 μM carbonyl cyanide p-(trifluoromethoxy) phenylhydrazone Carbonyl cyanide-4 (trifluoromethoxy) phenylhydrazone (FCCP), and 5 μM rotenone/antimycin A (Seahorse XF Cell Mito Stress Kit). To measure mitochondrial membrane polarization, HMCL cells were incubated for 2 hours in XF base media with cytokines as above, followed by the addition of tetramethylrhodamine, ethyl ester (TMRE) (200 nM, for 20 min at 37°C). HMCL were washed with phosphate-buffered saline, counterstained with UV Blue Live/Dead (1:1000 for 30 min at room temperature), washed again, and evaluated by fluorescence-activated cell sorting analysis gating on live cells and calculating the percent of cells that expressed low levels of TMRE.
Macrophage and monocytic–myeloid-derived suppressor cell (M-MDSC) polarization
Peripheral blood mononuclear cells (PBMCs) were isolated from healthy volunteer blood donors through the Division of Transfusion Medicine at Mayo Clinic.33 CD14+ monocytes were isolated from PBMCs using an EasySep Human Monocyte Isolation Kit. After isolation, monocytes were resuspended at 6 × 10⁶ cells per 4 mL with ImmunoCult–SF Macrophage Medium (SFMM), penicillin/streptomycin (P/S), and 5 ng/mL macrophage colony-stimulating factor (M-CSF) in a T25 flask. The cells were placed in an incubator at 37°C for 4 days. On day 4, media was exchanged with SFMM, P/S, and M-CSF and were incubated for 2 more days. On day 6, media was exchanged with SFMM, P/S, and M-CSF, and cells were cultured under the following 4 conditions: (1) unsupplemented media; (2) M1 induction using 10 ng/mL and 50 ng/mL interferon-γ(IFN-γ); (3) M2 induction using 10 ng/mL IL-4; and (4) 50 ng/mL HDGF. The cells were incubated for 2 days, and macrophages were harvested on the eighth day. Cells were detached with Accutase and stained for flow cytometry. For M-MDSC polarization, CD14+ monocytes were isolated as described above and cultured for 2 days with IMDM + 1% FBS in the absence or presence of 100 ng/mL HDGF.
CD4+ T-cell proliferation assay
CD4+ T cells were isolated from healthy volunteer blood donor PBMC with the EasySep Human CD4+ T-cell Isolation Kit and incubated for 2 days in IMDM + 10% FBS, during which autologous monocytes were polarized as described above. T cells were then stained with 2 μM CFSE for 10 minutes at 37°C, washed, and counted; 2 × 10⁵ T cells were plated in flat-bottom 96 well plates previously coated with 2 μg/mL anti-CD3 in serum-free IMDM with 1 μg/mL soluble anti-CD28 and 100 U/mL IL-2 (Roche). T cells were cocultured with 2 × 10⁵ monocytes for 3 days. Following incubation, proliferation was measured by flow cytometry and evaluated using FlowJo.
Proteome profile
Conditioned media from in vitro generated macrophages described above was centrifuged at 300 xg for 3 minutes and analyzed using Proteome Profiler Human Cytokine Arrays according to the manufacturer’s instructions. Proteins were labeled with IRDye 800CW Streptavidin (1:2000) and visualized with the Li-Cor Odyssey CLX. Signals were normalized to the positive control in each blot and expressed as fold change (FC) over the unstimulated cells.
Flow cytometry
Harvested macrophages were stained with fixable UV Blue Live/Dead stain, followed by staining with CD163-PE, CD80-APC, CD206-BV785, and CD68-FITC. Flow cytometry analysis was carried out using a BD Fortessa, and data were analyzed using FlowJo software. Data are expressed as the difference in mean fluorescence intensity (ΔMFI) of each antibody, comparing every condition to that of media-only control. M-MDSCs were stained with UV Blue Live/Dead stain, CD14-FITC and HLA-DR-PE-Dazzle, analyzed using the BD Symphony flow cytometer, and data were evaluated using FlowJo. For assessment of T-cell proliferation by flow cytometry, cells were stained with UV Blue Live/Dead stain and CD4 BV510.
Statistical analyses
Results in Figures 1, 3, 4, and 7 are displayed as means ± standard deviation. Significance in Figure 2 was measured by one-way ANOVA. Metabolism results in Figure 5 are displayed as means ± standard error was measured by one-way ANOVA.
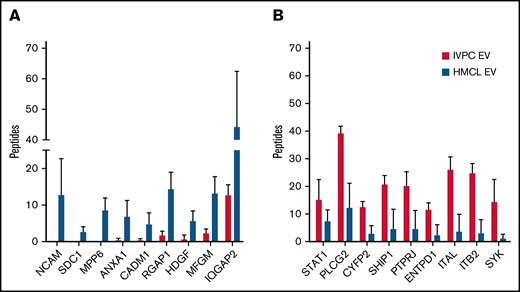
Mass spectrometry of proteins present in EVs released by IVPCs and HMCLs. (A) Graph showing the average number of peptides mapped to each protein upregulated in HMCL EVs relative to IVPCs. (B) Graph showing the average number of peptides mapped to each protein downregulated in HMCL EVs relative to IVPCs. Mass spectrometry analysis of EVs was done using independently harvested triplicates for each HMCL and IVPC generated from individual blood donors. Means ± standard deviation (SD) are shown. *P ≤ .01; others are P < .05.
Mass spectrometry of proteins present in EVs released by IVPCs and HMCLs. (A) Graph showing the average number of peptides mapped to each protein upregulated in HMCL EVs relative to IVPCs. (B) Graph showing the average number of peptides mapped to each protein downregulated in HMCL EVs relative to IVPCs. Mass spectrometry analysis of EVs was done using independently harvested triplicates for each HMCL and IVPC generated from individual blood donors. Means ± standard deviation (SD) are shown. *P ≤ .01; others are P < .05.
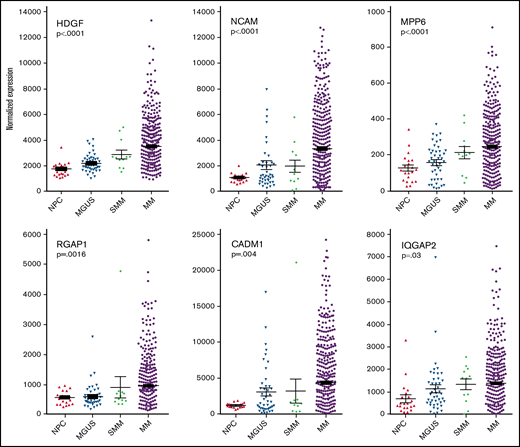
Plasma cell gene expression levels of differentially expressed proteins found in MM EVs. Analysis of archival gene expression profiles reveals that mRNA encoding 6 of the 9 HMCL EV target proteins are upregulated with increasing stages of malignancy. Significance was measured by one-way ANOVA.
Plasma cell gene expression levels of differentially expressed proteins found in MM EVs. Analysis of archival gene expression profiles reveals that mRNA encoding 6 of the 9 HMCL EV target proteins are upregulated with increasing stages of malignancy. Significance was measured by one-way ANOVA.
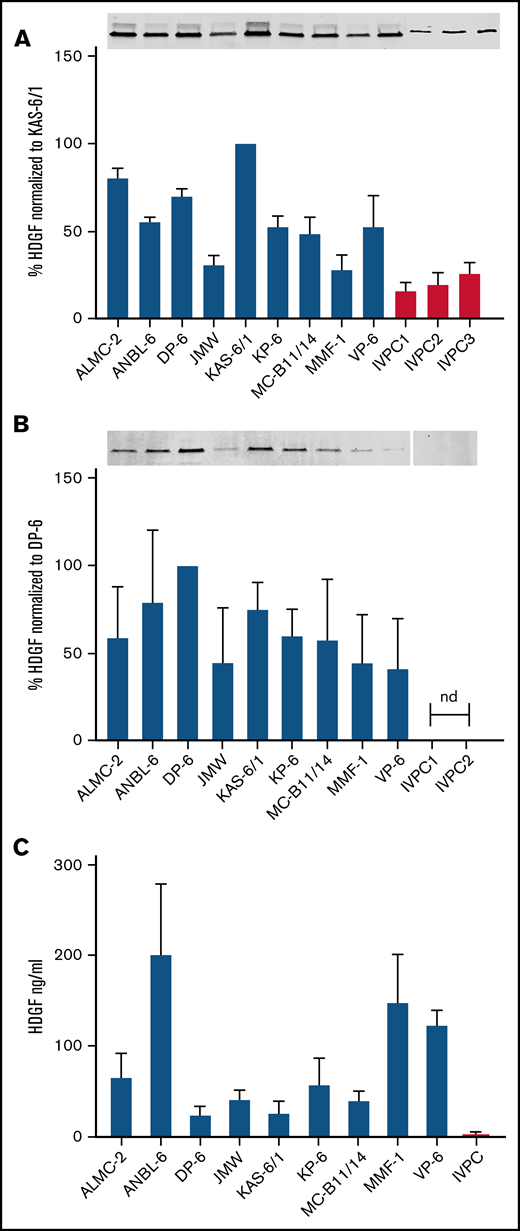
HDGF is present in HMCL extracts, HMCL EVs, and HMCL-conditioned media. (A) Top panel, Western blots demonstrate HMCLs express higher levels of HDGF than IVPCs; bottom panel, quantification of HDGF levels of expression normalized to total protein in each sample. Average of 3 experiments normalized to levels in KAS-6/1 (HMCL expressing the highest amount of HDGF). (B) Top panel, Western blots demonstrate EVs derived from HMCLs express varying amounts of HDGF, whereas EVs from IVPCs do not have detectable levels. Bottom panel, quantification of HDGF levels of expression normalized to total protein in each sample. Average of 3 experiments normalized to levels in DP-6 (HMCL EVs expressing the highest amount of HDGF). Nd, not detectable. (C) Levels of HDGF in HMCL-conditioned media measured by ELISA show that HMCLs secrete between 10- to 100-fold more HDGF than IVPCs. HMCL samples were tested in triplicate (except JMW and VP-6, which are duplicates); IVPC values reflect an average of 5 independent determinations. Means ± SD are shown.
HDGF is present in HMCL extracts, HMCL EVs, and HMCL-conditioned media. (A) Top panel, Western blots demonstrate HMCLs express higher levels of HDGF than IVPCs; bottom panel, quantification of HDGF levels of expression normalized to total protein in each sample. Average of 3 experiments normalized to levels in KAS-6/1 (HMCL expressing the highest amount of HDGF). (B) Top panel, Western blots demonstrate EVs derived from HMCLs express varying amounts of HDGF, whereas EVs from IVPCs do not have detectable levels. Bottom panel, quantification of HDGF levels of expression normalized to total protein in each sample. Average of 3 experiments normalized to levels in DP-6 (HMCL EVs expressing the highest amount of HDGF). Nd, not detectable. (C) Levels of HDGF in HMCL-conditioned media measured by ELISA show that HMCLs secrete between 10- to 100-fold more HDGF than IVPCs. HMCL samples were tested in triplicate (except JMW and VP-6, which are duplicates); IVPC values reflect an average of 5 independent determinations. Means ± SD are shown.
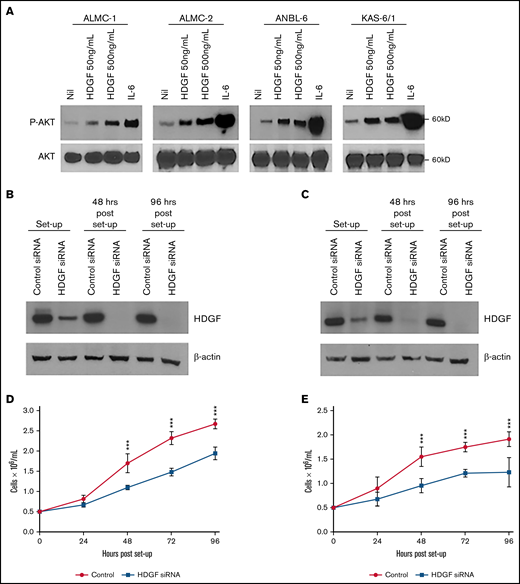
Autocrine effects of HDGF on HMCLs. (A) HDGF induces AKT phosphorylation in ALMC-1, ALMC-2, ANBL-6, and KAS-6/1 cells. Serum-starved cells were stimulated with IL-6 as a positive control and 50 ng/mL or 500 ng/mL HDGF for 1 hour. Top panels show the phosphorylation of AKT upon stimulation with HDGF; bottom panels show total AKT levels in each lane. siRNA knockdown of ALMC-1 (B,D) and ANBL-6 (C,E) results in reduced HDGF expression (B,C) and impaired proliferation (D,E). Results shown are representative of triplicate determinations. ***P < .001. Means ± SD are shown.
Autocrine effects of HDGF on HMCLs. (A) HDGF induces AKT phosphorylation in ALMC-1, ALMC-2, ANBL-6, and KAS-6/1 cells. Serum-starved cells were stimulated with IL-6 as a positive control and 50 ng/mL or 500 ng/mL HDGF for 1 hour. Top panels show the phosphorylation of AKT upon stimulation with HDGF; bottom panels show total AKT levels in each lane. siRNA knockdown of ALMC-1 (B,D) and ANBL-6 (C,E) results in reduced HDGF expression (B,C) and impaired proliferation (D,E). Results shown are representative of triplicate determinations. ***P < .001. Means ± SD are shown.
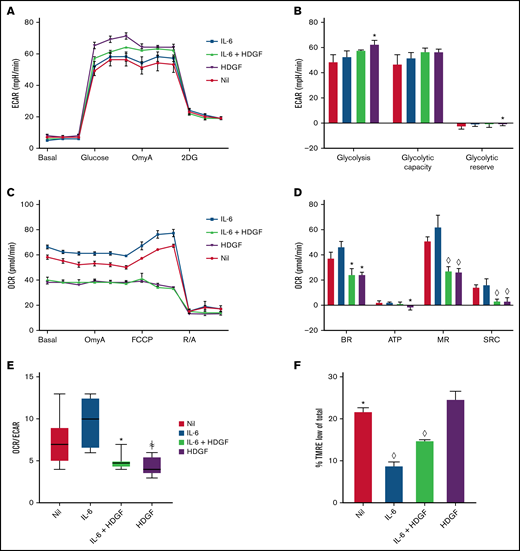
HDGF enhances glycolysis and reduces mitochondrial respiration in ALMC-2 cells. (A) ECAR measurements show that both HDGF and IL-6 + HDGF increase ECAR. (B) HDGF increases ALMC-2 glycolysis. (C) OCR measurements show a significant reduction of mitochondrial respiration in the presence of HDGF. (D) HDGF significantly reduces the basal rate (BR), ATP production (ATP), maximal respiration (MR), and spare respiratory capacity (SRC). (E) HDGF reduces the OCR:ECAR ratio. (F) Quantitative analysis of FACS data showing that HDGF increases the number of cells with impaired mitochondrial membrane potential (TMRE). Oligomycin A (OmyA), 2-deoxy-d-glucose (2DG), carbonyl cyanide p-(trifluoromethoxy) phenylhydrazone (FCCP), rotenone/antimycin A (R/A), and tetramethylrhodamine, ethyl ester (TMRE). Results shown are representative of duplicate determinations (A-D,F) and triplicate determinations (E). Means ± standard error are shown (n = 3). *P = .05; ꬸP = .01; and ◊P < .001. A-D: t test comparing nil to all other conditions. F: t tests comparing HDGF to all other conditions.
HDGF enhances glycolysis and reduces mitochondrial respiration in ALMC-2 cells. (A) ECAR measurements show that both HDGF and IL-6 + HDGF increase ECAR. (B) HDGF increases ALMC-2 glycolysis. (C) OCR measurements show a significant reduction of mitochondrial respiration in the presence of HDGF. (D) HDGF significantly reduces the basal rate (BR), ATP production (ATP), maximal respiration (MR), and spare respiratory capacity (SRC). (E) HDGF reduces the OCR:ECAR ratio. (F) Quantitative analysis of FACS data showing that HDGF increases the number of cells with impaired mitochondrial membrane potential (TMRE). Oligomycin A (OmyA), 2-deoxy-d-glucose (2DG), carbonyl cyanide p-(trifluoromethoxy) phenylhydrazone (FCCP), rotenone/antimycin A (R/A), and tetramethylrhodamine, ethyl ester (TMRE). Results shown are representative of duplicate determinations (A-D,F) and triplicate determinations (E). Means ± standard error are shown (n = 3). *P = .05; ꬸP = .01; and ◊P < .001. A-D: t test comparing nil to all other conditions. F: t tests comparing HDGF to all other conditions.
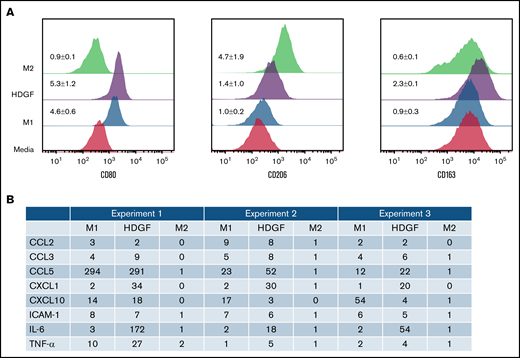
HDGF has a polarizing effect on macrophages. (A) HDGF induces an M1-like phenotype in human macrophages. Levels of CD80 (M1), CD206 (M2), and CD163 (TAM) expression following M1 polarization with LPS and IFNγ, M2 polarization with IL-4, or HDGF. Numbers represent the MFI ratio of each marker in each condition over media-only control ± SD. (B) Proteome profile of macrophages subjected to M1 and M2 polarizing cytokines as well as HDGF, showing that HDGF induces macrophages to secrete myeloma cell growth factor IL-6, as well as other proinflammatory cytokines and chemokines. Numbers for the triplicate experiments represent the ratio of each protein normalized to the corresponding media-only control.
HDGF has a polarizing effect on macrophages. (A) HDGF induces an M1-like phenotype in human macrophages. Levels of CD80 (M1), CD206 (M2), and CD163 (TAM) expression following M1 polarization with LPS and IFNγ, M2 polarization with IL-4, or HDGF. Numbers represent the MFI ratio of each marker in each condition over media-only control ± SD. (B) Proteome profile of macrophages subjected to M1 and M2 polarizing cytokines as well as HDGF, showing that HDGF induces macrophages to secrete myeloma cell growth factor IL-6, as well as other proinflammatory cytokines and chemokines. Numbers for the triplicate experiments represent the ratio of each protein normalized to the corresponding media-only control.
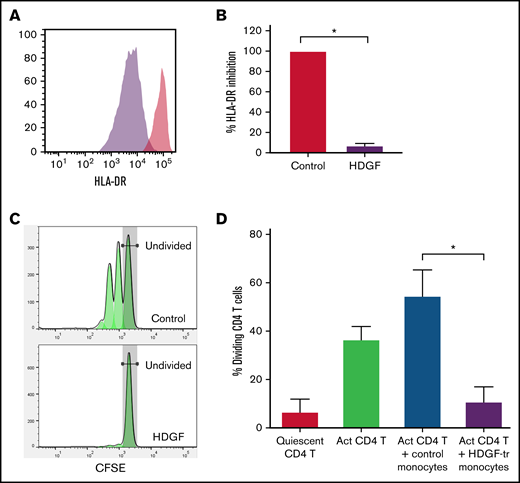
HDGF strongly reduces HLA-DR expression in human CD14+ monocytes and renders them immunosuppressive. Human CD14+ monocytes obtained from healthy volunteer blood donors were cultured with or without HDGF. (A) Representative histograms showing the reduction of HLA-DR when monocytes are cultured with HDGF (control monocytes are in red, HDGF-treated monocytes are purple). (B) Graph showing the percent inhibition of HLA-DR expression normalized to the levels of the control monocyte samples. (C) Representative T-cell proliferation histograms showing a significant reduction of T-cell proliferation when cocultured with HDGF-treated (HDGF-tr) monocytes. (D) Graph showing the percentage of dividing T cells in each condition. Means ± SD are shown (n = 4). *P < .001. Data shown in panels (B) and (D) represent the average values obtained from 4 independent experiments.
HDGF strongly reduces HLA-DR expression in human CD14+ monocytes and renders them immunosuppressive. Human CD14+ monocytes obtained from healthy volunteer blood donors were cultured with or without HDGF. (A) Representative histograms showing the reduction of HLA-DR when monocytes are cultured with HDGF (control monocytes are in red, HDGF-treated monocytes are purple). (B) Graph showing the percent inhibition of HLA-DR expression normalized to the levels of the control monocyte samples. (C) Representative T-cell proliferation histograms showing a significant reduction of T-cell proliferation when cocultured with HDGF-treated (HDGF-tr) monocytes. (D) Graph showing the percentage of dividing T cells in each condition. Means ± SD are shown (n = 4). *P < .001. Data shown in panels (B) and (D) represent the average values obtained from 4 independent experiments.
Results
Proteomic analysis reveals novel proteins enriched in MM EVs
We compared MM EV protein cargo to that of IVPC EVs and selected proteins that reached a significance of ≤0.05 and had a ≥2 FC (n = 294) (supplemental Table 1). Of these 294 proteins, 73 were expressed at higher levels, and 221 were expressed at lower levels in MM EVs compared with IVPC EVs. From this list, we chose 18 proteins that were highly differentially regulated and of biological interest. Figure 1 shows the number of averaged peptides mapped to these 18 proteins that are higher (Figure 1A) or lower (Figure 1B) in HMCL EVs compared with IVPC EVs. As expected, the proteins that were at high levels in IVPC EVs were largely related to B-cell activation (STAT1, PTPRJ, and ENTPD1), B-cell maturation (PLCG2 and SYK), and PC biology (ITGAL, ITGB2, and SHIP1). We, therefore, focused on upregulated cargo proteins that could provide new insights into MM biology.
GEP data show a correlation between expression levels of genes encoding MM cell EV proteins and stages of PC malignancy
Having identified cargo proteins in HMCL-derived (malignant) EVs that were expressed at a much lower level or not at all in EVs released from IVPCs (Figure 1A), we next took advantage of publicly available GEP data from normal BM PCs and PCs from patients with MGUS, SMM, and MM31 and assessed gene expression levels for our proteins of interest. Expression levels of NCAM, SDC1, MPP6, ANXA1, CADM1, RGAP1, HDGF, MFGM, and IQGAP2 were analyzed by one-way ANOVA to determine if there was a significant correlation between expression levels and stage of disease. Six of the 9 genes were significantly upregulated in myeloma cells as compared with normal PCs and PCs from MGUS and SMM patients: HDGF, NCAM and MPP6 (P < .001 for each of these 3 genes); RGAP1 (P = .0016); CADM1 (P = .004); and IQGAP2 (P = .03) (Figure 2). Expression of SDC1, ANXA1, and MFGM did not increase across this disease continuum (data not shown).
HDGF is expressed in HMCL-derived EVs and is also present in HMCLs
Western analysis was used to determine the levels of HDGF protein in our panel of 9 HMCLs and confirm the differential expression of HDGF in EVs derived from HMCLs compared with those from IVPCs. We discovered that HDGF levels are consistently higher (2.8-fold) in HMCLs than in IVPC samples. The HMCLs predominantly express isoform 1 of HDGF (the stronger signal, lower band) (Figure 3A, top panel) with much lower levels of isoform 2 (the weaker, higher band), whereas IVPCs only express isoform 1. Among the HMCLs, KAS-6/1 expressed the highest quantities of HDGF and JMW the lowest (Figure 3A). There is a shift in expression when the levels of HDGF in EVs are examined. EVs from IVPCs do not have detectable HDGF. The variation in HDGF expression in EVs is similar to that in HMCLs, with DP-6 and KAS-6/1 displaying the highest expression levels of HDGF. Isoform 1 was the only form of HDGF detected (Figure 3B) in EVs.
HMCLs directly secrete HDGF into conditioned media
To determine whether HMCLs also secrete HDGF in an EV-independent manner, we performed an HDGF ELISA (which detects both isoforms) on conditioned media (CM) that had been cleared of EVs (Figure 3C). Only trace levels of HDGF were detectable in 3 of the 5 IVPC CMs tested. By contrast, HDGF was readily detectable in the CM of all HMCLs and exceeded the levels found in IVPC CM by generally more than 100-fold. The highest levels were consistently found in ANBL-6 (average of 200 ng/mL), followed by MMF-1 and VP-6 (average of 147 and 122 ng/mL, respectively). Interestingly, DP-6, which had the highest concentration of HDGF in EVs, had the lowest levels of secreted HDGF (average of 22 ng/mL). CM from IVPCs had an average of 2 ng/mL of HDGF, 10-fold lower than the lowest HMCL level.
HDGF sustains MM growth and activates AKT
Given that HMCLs secrete HDGF, we first wanted to investigate whether HDGF had a measurable autocrine effect(s) on myeloma cells themselves. HDGF has been shown to stimulate phosphorylation of AKT in multiple cancers.34-36 Thus, we assessed the effects of adding recombinant HDGF to several HMCLs. Incubation with HDGF (50 ng/mL or 500 ng/mL) induced AKT phosphorylation in ALMC-1, ALMC-2, ANBL-6, and KAS-6/1 cells (Figure 4A). ALMC-1 is a sister cell line of ALMC-2 with slightly higher levels of HDGF expression (supplemental Figure 1). Because AKT activation is a powerful cell survival signal, these data suggest that HDGF may promote survival as well as the proliferation of MM cells. To determine whether HDGF acts as a myeloma cell growth factor, we performed HDGF knockdown using siRNA. In these experiments, we silenced HDGF in ALMC-1 and ANBL-6 cells, and knockdown was verified by Western blot (Figure 4B-C). Cell growth was monitored every 24 hours and revealed that HDGF knockdown substantially decreases ALMC-1 and ANBL-6 proliferation rates as compared with the parent cells expressing HDGF that were transfected with nontargeting control siRNA (P ≤ .001 for all time points) (Figure 4D-E). We found no effect of HDGF silencing on viability or apoptosis (data not shown).
HDGF enhances glycolysis and reduces mitochondrial respiration in HMCLs
In results not shown, we observed that the addition of HDGF to HMCLs resulted in more rapid acidification of the culture media. Since MM cells are known to have heightened glycolytic rates,37 we analyzed glycolysis and mitochondrial respiration in ALMC-2 cells (Figure 5) using the Seahorse platform. In addition, we also analyzed ANBL-6 and DP-6 cells (both of which secrete less HDGF than ALMC-2), and these data can be found in supplemental Figures 2 and 3. Measuring the ECAR, we found that IL-6 did not significantly raise ECAR, but HDGF alone did significantly raise ECAR (Figure 5A). While ALMC-2 exhibits high innate glycolysis, HDGF significantly raised glycolysis (P = .02) but not the glycolytic capacity of the cells (Figure 5B) as compared with untreated (nil) cells. Examination of the effect of HDGF on OCR revealed a reduction of the basal OCR (Figure 5C) and a significant decrease in basal respiration (P = .01), ATP-linked respiration (P = .04), maximal respiration (P < .001), as well as spare respiratory capacity (P < .001) (Figure 5D) in ALMC-2 cells as well as ANBL-6 and DP-6 cells (supplemental Figures 2 and 3). Finally, we used the OCR:ECAR ratio to evaluate the basal metabolic state of ALMC-2 cells exposed to HDGF. Our results show that HDGF reduces OCR in favor of ECAR (P = .01) (Figure 5E). While IL-6 was used as a positive control for HMCL activation, the samples treated with both IL-6 and HDGF showed that HDGF reversed the effect of IL-6 in all metrics of mitochondrial respiration.
To better understand the mechanism underlying HDGF-mediated attenuation of IL–6-stimulated mitochondrial respiration, we measured the mitochondrial membrane potential with TMRE,38 which is a key readout of active oxidative phosphorylation (OXPHOS). ALMC-2 cells cultured with IL-6 had the lowest number of cells exhibiting low membrane potential in the form of TMRElow (9%, P < .0001 compared with HDGF). The addition of HDGF to IL-6 increased TMRElow cells to 15% (P < .0001 compared with HDGF), whereas cells cultured with HDGF alone had 25% TMRElow cells (Figure 5F).
HDGF polarizes macrophages to an M1 phenotype
Since the presence of MM cells in the BM is known to modify the tumor ME,39 we next investigated whether HDGF polarizes macrophages to either proinflammatory M1 or antiinflammatory M2 cells. CD68 was used as a marker for all macrophages, CD80 as a marker for M1 macrophages, CD206 as a marker for M2 macrophages, and CD163 as a marker that is highly expressed in TAMs. In vitro matured macrophages (labeled as “media” in Figure 6A) express varying levels of CD80, CD206, and CD163. Under M1-inducing conditions, and as expected, macrophages exhibited upregulated CD80 expression, whereas CD206 and CD163 levels did not change. M2 polarized macrophages acquired higher levels of CD206. HDGF-stimulated macrophages revealed an interesting mixed phenotype (ie, CD80 expression increased, suggestive of an M1 effect, however, there was also a modest increase in CD206 expression as well as CD163) (Figure 6A).
HDGF induces macrophages to secrete myeloma cell growth factor IL-6
To further understand the role of HDGF on macrophages, we collected enriched media from triplicate experiments of macrophages subjected to the above polarization conditions and queried a panel of 36 cytokines and chemokines that are characteristically secreted by M1 or M2 polarized macrophages. As expected, M1 polarization resulted in significant secretion of IL-6, whereas M2 polarized cells secreted only trace levels of IL-6. Macrophages exposed to HDGF secreted ≥twofold higher levels than control in all 3 replicates of the following molecules: TNF-α, IL-6, ICAM-1, CCL2, CCL3, CCL5, CXCL1, and CXCL10 (Figure 6B). HDGF stimulation had the most pronounced effects on macrophage secretion of IL-6 (average FC of 82), CXCL1 (average FC of 28), and CCL5 (average FC of 106).
HDGF induces naïve monocytes to assume an M-MDSC phenotype, causing them to become immunosuppressive
Tumor-derived EVs can induce loss of HLA-DR and promote the development of MDSCs.40 Since we found that HDGF upregulated CD80 in macrophages, and CD80 can also be expressed by M-MDSCs, we next asked whether HDGF could convert naïve CD14+ monocytes to M-MDSCs. Monocytes were incubated for 2 days in the presence or absence of HDGF. Histograms of HLA-DR fluorescence intensity (Figure 7A) show that HDGF strongly reduces HLA-DR levels in naïve CD14+ monocytes. Evaluation of HLA-DR expression levels as a percentage of that from cells grown in media only (Figure 7B) confirms that HDGF leads to a reduction of HLA-DR intensity to 7% of levels found in control monocytes (P ≤ .0001). To confirm that HDGF not only changes monocytes phenotypically but that this change is indicative of a functionally suppressive cell, we cocultured CD4+ T cells with control monocytes or HDGF-treated monocytes and measured T-cell proliferation (Figure 7C-D). Monocytes preincubated with HDGF for 2 days, followed by washing cells to remove HDGF, strongly suppressed T-cell proliferation (Figure 7D), reducing the number of proliferating T cells from an average of 55% seen in control monocytes that had preincubated for 2 days in medium alone to an average of 11% (P ≤ .0001). Thus, suppressed T-cell proliferation is a direct result of polarized M-MDSCs.
Discussion
EVs are complex vehicles of intercellular communication. We began this study by characterizing the protein cargo of EVs derived from HMCLs with different genetic subtypes in order to discover new proteins potentially involved in MM cell communication with its tumor ME in the BM. The growth factor HDGF was identified as one of several differentially regulated proteins in these studies, and an analysis of publicly available GEP data confirmed our findings. Given the biological importance of HDGF in several other cancers, the potential role of HDGF in MM became the focus of our remaining studies.
Our studies have revealed several biological activities linked to HDGF. To explore possible autocrine effects of HDGF in MM cells, we chose to investigate AKT activation. The PI3K/AKT/mTOR pathway is aberrantly activated in a large proportion of MM patients,41 providing a critical survival pathway that promotes MM growth and is now being explored as a therapeutic target.42 We show that HDGF activates AKT in a number of HMCLs, suggesting that it has a role similar to IL-6 and insulin growth factor 1 (IGF-1) in protecting MM cells from apoptosis. We also employed a siRNA silencing approach and showed that HDGF silencing resulted in reduced HMCL cell growth in a manner consistent with previous observations that HDGF silencing reduces the growth of other types of tumor cells.34,43,44
During stimulation of HMCLs with HDGF, we observed enhanced media acidification, which led to our studies examining glycolysis and mitochondrial respiration. It is well known that tumors preferentially use anaerobic respiration and consume high levels of glucose, resulting in lactate secretion. While anaerobic respiration is less efficient, it is a significantly faster source of energy that tumors, including MM, use to fuel their enhanced proliferation.45 We carried out the metabolic studies using 3 HMCLs with high (ANBL-6), medium (ALMC-2), and low (DP-6) innate HDGF secretion. ECAR, a measure of the usage of glycolysis as a means of energy, was predictably high in all HMCLs. Despite this, the addition of HDGF significantly raised the levels of glycolysis in all 3 HMCLs. Examination of the effects of HDGF on OCR was even more striking (ie, we observed a strong reduction of basal respiration, ATP production, maximal respiration, and spare respiratory capacity, which are reflected in the decreased OCR:ECAR ratio). We also observed that HDGF significantly attenuated mitochondrial respiration in IL–6-stimulated cells. Using an assay that allowed assessment of the mitochondrial membrane potential with TMRE staining, we observed that the addition of HDGF to IL–6-stimulated cells indeed resulted in an increase in the percentage of cells with nonfunctioning mitochondria, reversing the effect of IL-6. These findings complement the data shown in Figure 5E by again demonstrating that IL-6 induces OXPHOS, whereas HDGF consistently suppresses OXPHOS. Our data demonstrate that HDGF initiates metabolic reprogramming by significantly reducing basal mitochondrial respiration in the form of reducing mitochondrial membrane potential and enhancing glycolysis; such metabolic alterations are hallmarks of highly proliferative cells and are also linked with regulating drug resistance in MM.46
Since HDGF is secreted in both EVs and unbound form, we asked whether it had any biological effect on cells that are present in the tumor stroma, such as macrophages and monocytes. In vitro matured macrophages were cultured with HDGF-upregulated CD80, a marker that corresponds with a proinflammatory M1 macrophage. This agrees with studies that monocytes recruited to a tumor site are first “classically activated” or M1 polarized macrophages which generate a proinflammatory response in the MM BM microenvironment.47 However, HDGF polarized macrophages also expressed the highest level of CD163 (the hemoglobin scavenger receptor), which is associated with M2 macrophages48 and TAMs in hematological malignancies.49 High CD163 expression in macrophages is a characteristic of tissues responding to inflammation50 due to expanding tumor burden. Moreover, M2 macrophages are thought to participate in tissue remodeling, thus facilitating metastasis. Finally, studies show that MM patients with BM macrophages that express high levels of CD163 have a poorer prognosis.51 Macrophage polarization is to be understood as a plastic adaptation to their environment, not as specific static endpoints. As such, it is feasible that HDGF can induce markers present in a continuum of activation and polarization from M1 to M2 to TAM.
In addition to examining surface markers to classify macrophages, it is important to consider the secreted cytokines and chemokines. Others have described that IL-6 and TNFα were significantly upregulated in BM macrophages of MM patients compared with normal donors.10,52 We found that HDGF-treated macrophages not only secreted high levels of IL-6, a powerful MM growth factor, but also produced more TNFα, CCL3, and CXCL1 than M1 macrophages as well as comparable levels of CCL2, CCL5, CXCL10, and ICAM-1. In a review of the consequences of tumor EVs on myeloid cells in the TME,53 the authors describe that tumor EVs induce reprogramming of monocytes to secrete IL-6, TNF-α, and CCL-2, which is reflected in our analysis. Much effort has gone into parsing out the effect of various cytokines and chemokines secreted by macrophages on the tumor ME. TNF-α is a proinflammatory cytokine that plays a role in the TME of various tumor types, including MM,47,54 by enhancing tumor cell proliferation. Several studies have highlighted the role of CXCL1 in mediating the communication between cancer and stromal cells47,55 and linking CXCL1 to decreased survival and metastasis.56-58 Other chemokines closely associated with the M1 phenotype (CCL2, CCL3, CCL5, and CXCL10) secreted by HDGF-polarized macrophages are all associated with various aspects of MM pathology. For example, CCL3 levels in MM BM correlate with osteolysis and tumor burden.59-61 Interaction of ICAM-1 with its ligand on the surface of MM cells leads to MM cell proliferation in mouse models, and antibodies against ICAM-1 have antimyeloma activities in vitro and in vivo.62 In the BM, ICAM-1 expression impaired osteogenic differentiation of MSCs.63 In summary, the overall picture that emerges from our data is that HDGF induces secretion of a number of M1-associated factors (the only exception being CXCL1, which is associated with TAMs) that are known to be involved in tumor–stroma interactions.
Melanoma and glioblastoma-derived EVs (both of which contain HDGF) generate immunosuppressive MDSCs associated with the downregulation of HLA-DR.64 MM patients have higher numbers of MDSCs in their blood and the BM than normal controls.65 Based on these observations, we investigated the effect of HDGF on immature CD14+ monocytes and found that HDGF induced the characteristic downregulation of HLA-DR observed on MDSCs. This phenotypic change was concomitant with strong immunosuppressive function as revealed by significant suppression of CD4+ T-cell proliferation by monocytes that had been preincubated with HDGF. Of note, HDGF does not convert CD4+ T cells into regulatory T cells(Tregs) (data not shown). Moreover, HDGF was not present during the coculture of CD4+ T cells with control or HDGF-pretreated monocytes. Therefore, suppressed CD4+ T-cell proliferation results directly from polarized M-MDSCs and does not reflect differences in levels of Tregs. Previous reports showed that MDSCs support MM cell survival through suppression of T-cell activation and induction of Tregs.65 Thus, HDGF could be a novel factor that contributes to immunosuppression in the MM tumor microenvironment.
In our study, we used proteomic analysis to characterize the cargo of HMCL EVs, discovering the presence of HDGF in EVs, cell lysates, and the culture medium of HMCLs. We demonstrated that HDGF has autocrine functions such as activation of the AKT pathway in MM cells, maintaining proliferation, and playing a significant role in metabolism (ie, enhancing glycolysis while suppressing mitochondrial respiration). Furthermore, we show that HDGF also has a potential paracrine role, affecting cells in the tumor microenvironment such as macrophages and immature monocytes. Taken together, HDGF is likely to play an important, albeit previously unrecognized, role in myeloma biology.
Acknowledgments
The authors would like to thank Natalie Mitchel for her expert assistance with mass spectrometry and Carole Viso and Tammy Brehm-Gibson in the Mayo Flow Cytometry Core.
This study was supported by grants from the National Institutes of Health (NIH R01CA196831 [D.F.J.] and NIH P50 CA186781 [developmental research funding awarded to D.F.J. and D.B.H.]).
Authorship
Contribution: D.B.H. designed and executed experiments, analyzed data, and wrote the manuscript; S.J.Q., D.K.W., and T.V.-K. designed and executed experiments, analyzed data, and edited the manuscript; R.C.T. designed and executed experiments and edited the manuscript; H.B.D.S. provided expert advice on metabolism and edited the manuscript; and D.F.J. designed the overall concept, guided the project, and edited the manuscript.
Conflict-of-interest disclosure: The authors declare no competing financial interests.
Correspondence: Diane F. Jelinek, Mayo Clinic, 13400 E. Shea Blvd, Scottsdale, AZ 85259; e-mail: jelinek.diane@mayo.edu.

