

A number of errors were inadvertently introduced during the publication process.
Page 3839: In the abstract, the passage “After transfusion into humans, CSP were mostly equivalent to RSP; however, their rate of aggregation in response to the GPVI agonist collagen was significantly lower. In a mouse model of platelet transfusion, we found a significantly lower response rate to the GPVI-dependent agonist convulxin and significantly lower GPVI levels on the surface of transfused platelets after cold storage,” should read, “After transfusion into humans, CSP were mostly equivalent to RSP yet aggregated significantly less to the GPVI agonist collagen. In a mouse model of platelet transfusion, we found a significantly lower response to the GPVI-dependent agonist convulxin and significantly lower GPVI levels on the surface of transfused platelets after cold storage.”
Page 3839: In the first paragraph of “Introduction,” the sentence, “After transfusion into humans, CSP were mostly equivalent to RSP yet aggregated significantly less to the GPVI agonist collagen,” should read, “Platelets are transfused to prevent and treat bleeding.” The last sentence of this paragraph should be deleted; it read, “After transfusion into humbans, CSP were mostly equivalent to RSP yet aggregated significantly less to the GPVI agonist collagen.”
Page 3840: In the second sentence of the second paragraph under “Single-platelet contractile force assay,” the two instances of “platelets per mL” should be deleted.
Page 3841: In Figure 1C-F, the lines and shaded areas that were green should be blue, those that were red should be green, and those that were blue should be red.
Page 3842: In the bars labeled “Fresh” in Figure 2C-D, F-G, the error bar that was red should be green.
Page 3842: In the left column, “2 × 10¹¹/L platelets per mL” should read “2 × 10¹¹ platelets per L.”
Page 3842: In the Figure 2C legend, “Average traction forces per platelet was measured for 6 donors” should be “Average traction forces per platelet were measured for 6 donors.” In the Figure 2G legend, “back dots was measured” should be “black dots were measured.”
Page 3843: In Figure 3A-B, the bars, data points, and curves that were red should be green; those that were blue should be red; and those that were green should be blue.
The corrected Figures 1, 2, and 3 are shown below. The publisher apologizes for the errors, which have been corrected in the published article.
![Platelet aggregate force and area in response to shear flow. Reconstituted whole-blood samples with fresh (green triangles), RT-stored (red circles), or 4°C-stored (blue squares) apheresis platelets were perfused through a microfluidic device to measure the force and area of platelet aggregates formed under shear flow. (A) Each microfluidic channel contains multiple sets of block and post force sensors. While under flow, platelets attach and aggregate to form a pluglike structure (green) that encapsulates the block and post. Aggregated platelets are able to produce contractile forces (F) that pull the flexible post toward the rigid block. Force is calculated from displacement of the tip of the post (δ) using Hooke’s law: F = k δ, where k = 3π E d4/64 L3, and E is the modulus of elasticity, d is the diameter, and L is the length of the post. (B) Representative images of platelet aggregate area 15, 60, and 300 seconds after blood enters the channel. (C) Mean force of the platelet aggregates over time (n = 5; shaded regions represent standard error of the mean [SEM]). (D) Force of the platelet aggregates at 60 seconds (n = 5; shown as mean ± SEM). (E) Force of the platelet aggregates at 300 seconds (n = 5; shown as mean ± SEM). (F) Mean area of the platelet aggregates over time (n = 5; shaded regions represent SEM). (G) Area of the platelet aggregates at 60 seconds (n = 5; shown as mean ± SEM). (H) Area of the platelet aggregates at 300 seconds (n = 5; shown as mean ± SEM). *P = .0103 for fresh and RT (H); **P = .0032 for 4°C and RT (G).](https://ash.silverchair-cdn.com/ash/content_public/journal/bloodadvances/6/10/10.1182_bloodadvances.2021006681/3/m_advancesadv2021006681f1.png?Expires=1765886184&Signature=WvGm0qe1h2mKSyL2Vd8AZdbVd1NVOCBX22sNqDiJCEpUmXH~xYs0LAD56xgeKd0epQ9Oauh6nyK~pMiq-w9xx0tI3cjagFP5D5saV24vOaOP~7fDdkotBJ4pinmBZpeeIKrNl5DvhJmVxc85ZxK2MYgP7hDRDf9HpR0iE~AHr7UiJpHDPxNdw6CtVJfhJhfA0D5w5~npJ2dBtQ5JLaue5SmgkNDwKm-~mc81A8n2g7TfDuMqcYDYYkEvz9Q14N5GR1ONvUY62IK1WULFHb5-CXa3xH~w5OLWDALgE3SImKfih2dwrgubkD6vwtEci2jtvX3sBgqTybAI9IcPRAIsMg__&Key-Pair-Id=APKAIE5G5CRDK6RD3PGA)
Platelet aggregate force and area in response to shear flow. Reconstituted whole-blood samples with fresh (green triangles), RT-stored (red circles), or 4°C-stored (blue squares) apheresis platelets were perfused through a microfluidic device to measure the force and area of platelet aggregates formed under shear flow. (A) Each microfluidic channel contains multiple sets of block and post force sensors. While under flow, platelets attach and aggregate to form a pluglike structure (green) that encapsulates the block and post. Aggregated platelets are able to produce contractile forces (F) that pull the flexible post toward the rigid block. Force is calculated from displacement of the tip of the post (δ) using Hooke’s law: F = k δ, where k = 3π E d4/64 L3, and E is the modulus of elasticity, d is the diameter, and L is the length of the post. (B) Representative images of platelet aggregate area 15, 60, and 300 seconds after blood enters the channel. (C) Mean force of the platelet aggregates over time (n = 5; shaded regions represent standard error of the mean [SEM]). (D) Force of the platelet aggregates at 60 seconds (n = 5; shown as mean ± SEM). (E) Force of the platelet aggregates at 300 seconds (n = 5; shown as mean ± SEM). (F) Mean area of the platelet aggregates over time (n = 5; shaded regions represent SEM). (G) Area of the platelet aggregates at 60 seconds (n = 5; shown as mean ± SEM). (H) Area of the platelet aggregates at 300 seconds (n = 5; shown as mean ± SEM). *P = .0103 for fresh and RT (H); **P = .0032 for 4°C and RT (G).
Platelet aggregate force and area in response to shear flow. Reconstituted whole-blood samples with fresh (green triangles), RT-stored (red circles), or 4°C-stored (blue squares) apheresis platelets were perfused through a microfluidic device to measure the force and area of platelet aggregates formed under shear flow. (A) Each microfluidic channel contains multiple sets of block and post force sensors. While under flow, platelets attach and aggregate to form a pluglike structure (green) that encapsulates the block and post. Aggregated platelets are able to produce contractile forces (F) that pull the flexible post toward the rigid block. Force is calculated from displacement of the tip of the post (δ) using Hooke’s law: F = k δ, where k = 3π E d4/64 L3, and E is the modulus of elasticity, d is the diameter, and L is the length of the post. (B) Representative images of platelet aggregate area 15, 60, and 300 seconds after blood enters the channel. (C) Mean force of the platelet aggregates over time (n = 5; shaded regions represent standard error of the mean [SEM]). (D) Force of the platelet aggregates at 60 seconds (n = 5; shown as mean ± SEM). (E) Force of the platelet aggregates at 300 seconds (n = 5; shown as mean ± SEM). (F) Mean area of the platelet aggregates over time (n = 5; shaded regions represent SEM). (G) Area of the platelet aggregates at 60 seconds (n = 5; shown as mean ± SEM). (H) Area of the platelet aggregates at 300 seconds (n = 5; shown as mean ± SEM). *P = .0103 for fresh and RT (H); **P = .0032 for 4°C and RT (G).
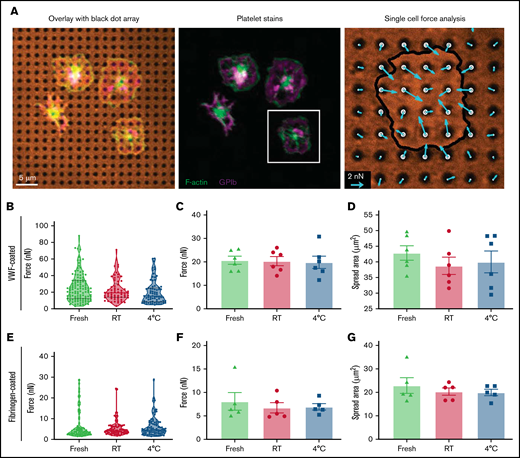
Single-platelet contraction force and spread area. Apheresis platelets were washed and seeded onto flexible PDMS substrates that were printed with an array of black dots to measure traction forces and spread area of individual platelets. (A) Platelets were fixed, stained, and imaged to visualize F-actin (green), GPIb (purple), and the array of black dots (orange). The magnitude and direction of platelet traction forces (blue arrows) were calculated from the displacement of the dots. (B) Traction forces were measured for fresh (green), RT-stored (red), and 4°C-stored (blue) platelets that were seeded onto black dot substrates coated with VWF. Violin plots show data from a representative donor for whom 252 platelets were measured (fresh, n = 117; RT stored, n = 73; 4°C stored, n = 62). (C) Average traction forces per platelet were measured for 6 donors, and no statistically significant difference was observed between fresh (green triangles), RT-stored (red circles), and 4°C-stored (blue squares) platelets. (D) Average spread area of platelets on VWF-coated black dots was measured for each donor, and no significant difference was observed between the conditions. (E) Traction forces were measured for fresh (green), RT-stored (red), and 4-C-stored (blue) platelets on fibrinogen-coated black dots. Violin plots show data from a representative donor for whom 242 platelets were measured (fresh, n = 81; RT stored, n = 84; 4°C stored, n = 77). (F-G) Average traction forces (F) and average spread area (G) of platelets on fibrinogen-coated black dots were measured for 5 donors, and no significant difference was observed between conditions.
Single-platelet contraction force and spread area. Apheresis platelets were washed and seeded onto flexible PDMS substrates that were printed with an array of black dots to measure traction forces and spread area of individual platelets. (A) Platelets were fixed, stained, and imaged to visualize F-actin (green), GPIb (purple), and the array of black dots (orange). The magnitude and direction of platelet traction forces (blue arrows) were calculated from the displacement of the dots. (B) Traction forces were measured for fresh (green), RT-stored (red), and 4°C-stored (blue) platelets that were seeded onto black dot substrates coated with VWF. Violin plots show data from a representative donor for whom 252 platelets were measured (fresh, n = 117; RT stored, n = 73; 4°C stored, n = 62). (C) Average traction forces per platelet were measured for 6 donors, and no statistically significant difference was observed between fresh (green triangles), RT-stored (red circles), and 4°C-stored (blue squares) platelets. (D) Average spread area of platelets on VWF-coated black dots was measured for each donor, and no significant difference was observed between the conditions. (E) Traction forces were measured for fresh (green), RT-stored (red), and 4-C-stored (blue) platelets on fibrinogen-coated black dots. Violin plots show data from a representative donor for whom 242 platelets were measured (fresh, n = 81; RT stored, n = 84; 4°C stored, n = 77). (F-G) Average traction forces (F) and average spread area (G) of platelets on fibrinogen-coated black dots were measured for 5 donors, and no significant difference was observed between conditions.
![Platelet storage temperature and response to agonists in PRP and washed platelets (WPs). We obtained human platelets by apheresis and used platelets either fresh (green triangles) or stored for 5 days at either 4°C (blue squares) or 22°C (RT; red circles). Aggregation was induced by stimulation with 5 µg/mL of collagen, 20 µM of ADP, or 0.5 mM of arachidonic acid (AA; shown as maximum aggregation; mean ± standard error of the mean [SEM]; n = 6-7). (A) PRP: collagen, ADP, and AA (left) and representative aggregation traces (right). (B) WPs: collagen, ADP, and AA (left) and representative aggregation traces (right). (C) GPVI levels on platelets determined by flow cytometry with fluorochrome-conjugated anti-GPVI antibody (n = 7; left), and β1 integrin levels on platelets determined by flow cytometry with fluorochrome-conjugated β1 antibody (n = 7; right). (D) Separate cohort of healthy volunteers, whose platelets were stored for 7 days at RT or 4°C under the same conditions as described for the original cohort. GPVI levels were determined using liquid chromatography–tandem mass spectrometry. Results are shown as fold change from baseline (fresh; n = 5). (E) PRP was diluted with separately stored plasma and stimulated with 100 ng/mL of convulxin. We stained with antibodies against activated integrin (PAC-1) and P-selectin (anti-CD62P; shown as change in mean fluorescence intensity [MFI] ± SEM from unstimulated; n = 5). *P < .5; **P < .01; ***P < .001. ns, not significant.](https://ash.silverchair-cdn.com/ash/content_public/journal/bloodadvances/6/10/10.1182_bloodadvances.2021006681/3/m_advancesadv2021006681f3.png?Expires=1765886184&Signature=RprD2NQJ3nplAozpE4qx9LVIzk4SqD8hukNjfx2yuBdaSd9Hq3QatRYyCU4sxUhv5wk~jmX4GXiCYRFfSp9PoZlku5kUrPYSKF8RoebYE7RQniINkrlg5QxWm8NmywpFhcDHV8vSSpTlgkXXZYFaJH4HKvVO1J6ZbCCFCxmvsyYYjjgtrPjm0L7SdeE17KKbOwlfW1GcvAKjHLN0SC4ilTiU9-zMTQS91lkaeFCzRIYnit66IXAplaFW1~-jtBp5nNkiF-AbhlGFkjxAF0jLXeNCTyR8HAr00R2foD-~N7xcxLWT-Njg984ooissAoFjloftafunBLLphEOm2wlsvQ__&Key-Pair-Id=APKAIE5G5CRDK6RD3PGA)
Platelet storage temperature and response to agonists in PRP and washed platelets (WPs). We obtained human platelets by apheresis and used platelets either fresh (green triangles) or stored for 5 days at either 4°C (blue squares) or 22°C (RT; red circles). Aggregation was induced by stimulation with 5 µg/mL of collagen, 20 µM of ADP, or 0.5 mM of arachidonic acid (AA; shown as maximum aggregation; mean ± standard error of the mean [SEM]; n = 6-7). (A) PRP: collagen, ADP, and AA (left) and representative aggregation traces (right). (B) WPs: collagen, ADP, and AA (left) and representative aggregation traces (right). (C) GPVI levels on platelets determined by flow cytometry with fluorochrome-conjugated anti-GPVI antibody (n = 7; left), and β1 integrin levels on platelets determined by flow cytometry with fluorochrome-conjugated β1 antibody (n = 7; right). (D) Separate cohort of healthy volunteers, whose platelets were stored for 7 days at RT or 4°C under the same conditions as described for the original cohort. GPVI levels were determined using liquid chromatography–tandem mass spectrometry. Results are shown as fold change from baseline (fresh; n = 5). (E) PRP was diluted with separately stored plasma and stimulated with 100 ng/mL of convulxin. We stained with antibodies against activated integrin (PAC-1) and P-selectin (anti-CD62P; shown as change in mean fluorescence intensity [MFI] ± SEM from unstimulated; n = 5). *P < .5; **P < .01; ***P < .001. ns, not significant.
Platelet storage temperature and response to agonists in PRP and washed platelets (WPs). We obtained human platelets by apheresis and used platelets either fresh (green triangles) or stored for 5 days at either 4°C (blue squares) or 22°C (RT; red circles). Aggregation was induced by stimulation with 5 µg/mL of collagen, 20 µM of ADP, or 0.5 mM of arachidonic acid (AA; shown as maximum aggregation; mean ± standard error of the mean [SEM]; n = 6-7). (A) PRP: collagen, ADP, and AA (left) and representative aggregation traces (right). (B) WPs: collagen, ADP, and AA (left) and representative aggregation traces (right). (C) GPVI levels on platelets determined by flow cytometry with fluorochrome-conjugated anti-GPVI antibody (n = 7; left), and β1 integrin levels on platelets determined by flow cytometry with fluorochrome-conjugated β1 antibody (n = 7; right). (D) Separate cohort of healthy volunteers, whose platelets were stored for 7 days at RT or 4°C under the same conditions as described for the original cohort. GPVI levels were determined using liquid chromatography–tandem mass spectrometry. Results are shown as fold change from baseline (fresh; n = 5). (E) PRP was diluted with separately stored plasma and stimulated with 100 ng/mL of convulxin. We stained with antibodies against activated integrin (PAC-1) and P-selectin (anti-CD62P; shown as change in mean fluorescence intensity [MFI] ± SEM from unstimulated; n = 5). *P < .5; **P < .01; ***P < .001. ns, not significant.

