

Key Points
The semaphorin receptor PLXNC1 is an IDO1-interacting gene and a strong predictor of survival in AML.
An IDO1-related immune gene signature, including PLXNC1, predicts survival in AML.

Abstract
The contribution of the bone marrow (BM) immune microenvironment to acute myeloid leukemia (AML) development is well-known, but its prognostic significance is still elusive. Indoleamine 2,3-dioxygenase 1 (IDO1), which is negatively regulated by the BIN1 proto-oncogene, is an interferon-γ-inducible mediator of immune tolerance. With the aim to develop a prognostic IDO1-based immune gene signature, biological and clinical data of 982 patients with newly diagnosed, nonpromyelocytic AML were retrieved from public datasets and analyzed using established computational pipelines. Targeted transcriptomic profiles of 24 diagnostic BM samples were analyzed using the NanoString’s nCounter platform. BIN1 and IDO1 were inversely correlated and individually predicted overall survival. PLXNC1, a semaphorin receptor involved in inflammation and immune response, was the IDO1-interacting gene retaining the strongest prognostic value. The incorporation of PLXNC1 into the 2-gene IDO1-BIN1 score gave rise to a powerful immune gene signature predicting survival, especially in patients receiving chemotherapy. The top differentially expressed genes between IDO1lowand IDO-1high and between PLXNC1lowand PLXNC1high cases further improved the prognostic value of IDO1 providing a 7- and 10-gene immune signature, highly predictive of survival and correlating with AML mutational status at diagnosis. Taken together, our data indicate that IDO1 is pivotal for the construction of an immune gene signature predictive of survival in AML patients. Given the emerging role of immunotherapies for AML, our findings support the incorporation of immune biomarkers into current AML classification and prognostication algorithms.
Introduction
Acute myeloid leukemia (AML) is a molecularly and clinically heterogeneous hematologic malignancy that progresses rapidly and originates from a rare population of leukemic stem cells. Despite intensive chemotherapy and stem cell transplantation, the outcome of AML has not changed substantially in the past few decades. The estimated 5-year overall survival (OS) rate is ∼30% and death rates have remained stable.1 In this scenario, innovative strategies and tools are urgently needed to improve outcomes for AML patients.
In many cancers, such as diffuse large B-cell lymphoma,2 primary breast cancer,3,4 melanoma,5 gastric cancer,6 and lung adenocarcinoma,7,8 the tumor microenvironment (TME) has been shown to retain a prognostic value that can be asserted by immune-specific gene expression patterns.9,10 However, the current risk classification11 of AML is exclusively focused on leukemic cell-intrinsic cytogenetic and molecular alterations, which have historically been known to affect response to conventional chemotherapy and risk of relapse. Compelling preclinical data clearly demonstrate the impact of tolerogenic mechanisms played by TME in dysregulating patients’ immune response to AML cells. Very recently, the prognostic significance of immune landscape has been addressed in AML, revealing that immune-related genes may predict response to therapy and survival.12
Indoleamine 2,3-dioxygenase 1 (IDO1) catalyzes the rate-limiting step in tryptophan metabolism along the kynurenine pathway. In tumors, IDO1 is negatively controlled by the BIN1 tumor suppressor,13 which in turn is regulated by the RBM25 splicing factor, generating a dominant-negative BIN1 isoform that is unable to repress MYC activity.14 We and others have shown that IDO1 is expressed in a significant proportion of AML patients at disease onset,15 where it promotes the establishment of an immunosuppressive TME through the induction of T regulatory cells.16-19 Previous studies investigated the impact of IDO1 on AML survival. In particular, IDO1 messenger RNA (mRNA) expression in the bone marrow (BM), evaluated by gene expression profiling or quantitative real-time polymerase chain reaction (RT-PCR) was a predictor of shorter survival.20,21 Recently, an immunohistochemical score based on IDO1 expression was shown to predict early mortality in AML.22 Herein, we interrogated public AML transcriptomic datasets and profiled primary BM samples from patients newly diagnosed with AML with the aim to identify an IDO1-related immune gene signature that may further refine our ability to predict survival.
Materials and methods
Data sources
For the in silico generation of a prognostic IDO1-associated gene signature, 3 publicly available independent gene expression datasets were used. Biological and clinical data of 982 patients with newly diagnosed patients with nonpromyelocytic AML, including complete cytogenetic, immunophenotypic, and clinical annotations, were retrieved from The Cancer Genome Atlas (TCGA) profiling project, the HOVON (E-MTAB-3444) dataset23 and the GSE106291 dataset (available through Gene Expression Omnibus, GEO).24 The TCGA series consisted of RNA-sequencing data (Illumina HiSeq 2000) available through cBioPortal for Cancer Genomics at https://www.cbioportal.org25,26 and Xena Platform at http://xena.ucsc.edu.27 In the TCGA-AML dataset, only patients treated with curative intent on a “7 + 3” chemotherapy backbone (n = 123) were considered for survival analyses.
The HOVON series (available through Array Express; E-MTAB-3444) consisted of gene array data from AML patients treated according to Dutch-Belgian Hemato-Oncology Cooperative Group (HOVON) and the Swiss Group for Clinical Cancer Research AML-04, -04A, -29, -32, -42, -42A, -43, and -92 protocols (http://www.hovon.nl). In particular, clinical and pathological data were available for 609 patients.28 HOVON patients aged more than 65 years were excluded from survival analyses. Patients’ characteristics are summarized in Tables 1 and 2.
Overview of biological and clinical data referring to patients in the HOVON, TCGA and GSE106291 datasets
| HOVON | TCGA | GSE106291 | |
|---|---|---|---|
| Sex | |||
| Female | 294 | 56 | 129 |
| Male | 315 | 67 | 119 |
| Fab | |||
| AML with unknown FAB subtype | 1 | 0 | NA |
| M0 | 26 | 12 | NA |
| M1 | 134 | 38 | NA |
| M2 | 154 | 28 | NA |
| M4 | 111 | 29 | NA |
| M5 | 139 | 12 | NA |
| M6 | 9 | 2 | NA |
| M7 | 0 | 1 | NA |
| RAEB | 5 | 0 | NA |
| RAEB-t | 19 | 0 | NA |
| Unknown | 11 | 1 | NA |
| BM blasts abundance at diagnosis | |||
| Median blasts (%) | 67 (0-98) | 74 (30-100) | 73 (6-100) |
| Cytogenetic risk | |||
| Adverse | 123 | 26 | NA |
| Favorable | 204 | 17 | NA |
| Intermediate | 280 | 78 | NA |
| Not evaluable risk | 2 | 2 | NA |
| Treatment | |||
| Allogeneic HSCT | 196 | 64 | NA |
| Autologous HSCT | 91 | 6 | NA |
| Chemotherapy | 320 | 53 | NA |
| Unknown | 2 | 0 | NA |
NA, not available.
Overview of mutational data referring to patients in the HOVON, TCGA and GSE106291 datasets
| HOVON | TCGA | GSE106291 | |
|---|---|---|---|
| NPM1 status | |||
| Wild-type | 422 | 83 | NA |
| Mutated | 183 | 40 | NA |
| Unknown | 4 | 0 | 250 |
| FLT3 status | |||
| Wild-type | 441 | 88 | NA |
| Mutated | 165 | 35 | NA |
| Unknown | 3 | 0 | 250 |
| NRAS status | |||
| Wild-type | 509 | 112 | NA |
| Mutated | 60 | 11 | NA |
| Unknown | 40 | 0 | 250 |
| KRAS status | |||
| Wild-type | 483 | 120 | NA |
| Mutated | 5 | 3 | NA |
| Unknown | 121 | 0 | 250 |
| KIT status | |||
| Wild-type | 427 | 107 | NA |
| Mutated | 20 | 6 | NA |
| Unknown | 162 | 10 | 250 |
| ASXL1 status | |||
| Wild-type | 573 | 121 | NA |
| Mutated | 31 | 2 | NA |
| Unknown | 5 | 0 | 250 |
| IDH1 status | |||
| Wild-type | 528 | 108 | NA |
| Mutated | 42 | 15 | NA |
| Unknown | 39 | 0 | 250 |
| IDH2 status | |||
| Wild-type | 510 | 110 | NA |
| Mutated | 60 | 13 | NA |
| Unknown | 39 | 0 | 250 |
The GSE106291 dataset (available through Gene Expression Omnibus) consists of gene expression data by high-throughput sequencing from patients with AML treated in the Acute Myeloid Leukemia Cooperative Group (AMLCG) 2008 (NCT01382147, n = 210) and AMLCG -1999 trials (NCT00266136, n = 40). Survival data were available in 248/250 patients in the GSE106291 series. The results shown in this paper are in part based upon data retrieved from the TCGA profiling project and the HOVON (E-MTAB-3444) dataset. The data referring to the validation cohort are included in the Gene Expression Omnibus database (accession number GSE146204).
IDO1-related gene normalization and coexpression analysis
The analysis of genes with a coordinated expression pattern in TCGA-AML was performed through the cBioPortal platform.25,26 The top 5 genes correlated with IDO1 were then selected and their impact on survival was evaluated using the Kaplan-Meier method.
Validation cohort
Twenty-four BM samples from patients with nonpromyelocytic AML were collected at diagnosis and were used to validate the correlation between IDO1 and PLXNC1 expression. Median age at diagnosis was 55 years; 18 patients were male and 6 were female (patients’ clinical data are summarized in Table 3). Patients provided written informed consent. The investigations were conducted in accordance with the Declaration of Helsinki. Approval was obtained from Bologna Hospital Ethics Committee (94/201/O/Tess).
Overview of clinical data referring to validation cohort patients
| Sample type | Sex | Median age, y | ELN risk class | BM blast abundance (%) | Assay |
|---|---|---|---|---|---|
| BM = 24 | Female = 6 Male = 18 | 55 | High = 7 Intermediate = 7 Low = 6 NA = 4 | 70 (20-90) | NanoString |
| Sample type | Sex | Median age, y | ELN risk class | BM blast abundance (%) | Assay |
|---|---|---|---|---|---|
| BM = 24 | Female = 6 Male = 18 | 55 | High = 7 Intermediate = 7 Low = 6 NA = 4 | 70 (20-90) | NanoString |
Cox regression analysis and computation of gene prognostic signatures
Gene expression was min-max normalized to a value between 0 and 1. The association between gene expression and survival time was evaluated using Cox regression analysis. β coefficients from Cox proportional hazards models were used to assign a prognostic weight to each individual gene in a given signature. According to a previously published formula,29 we developed a gene signature calculated as the linear combination of mRNA expression weighted by the regression coefficient (β) derived from multivariate Cox regression analysis with OS as a dependent variable. Regarding the IDO1-BIN1-PLXNC1 signature, patients were stratified into 3 groups (low-score group, intermediate-score group, and high-score group) using the 25th and 75th percentiles of the score as cutoff. A summary of the key signatures used in this study is reported in supplemental Table 1.
Probe identification selection
In the HOVON dataset, the following probe identifications were used for the analysis of mRNA expression: 210029_at (IDO1), 206470_at (PLXNC1), 210202_s_at (BIN1), 212028_at (RBM25), 209341_s_at (IKBK3), 204420_at (FOSL1), 223903_at (TLR9), 210321_at (GZMH), 205495_s_at (GNLY), 217502_at (IFIT2), and 204747_at (IFIT3).
RT-PCR
Total RNA was extracted from mononuclear cells isolated from the BM of our validation cohort (n = 24) using the Qiagen RNeasy kit according to the manufacturer's protocol. Quality control of the isolated RNA was performed using an Agilent bioanalyzer and NanoDrop 8000 (Thermo Scientific, Waltham, MA). An optical density260/280 ratio between 1.8 and 2.2 and an RNA integrity number value above 9.0 was considered for further processing. For complementary DNA synthesis, 1 μg of denatured total RNA was reverse transcribed using an Improm II kit and random hexamers (both from Promega, Madison, WI) in a 20-μL final volume according to the manufacturer’s instruction. Quantitative RT-PCR was performed in a 96-well Optical Reaction Plate using the ABI-PRISM 7900 Sequence Detection System (Applied Biosystems, Foster City, CA). Threshold cycle values were determined automatically. Relative quantification was calculated using ΔCt comparative method.30 Primer probes for PLXNC1 Hs00194968_m1, IDO1 Hs00158027_m1 and glyceraldehyde 3-phosphate dehydrogenase, and Hs00266705_g1 were purchased from Applied Biosystems.
NanoString nCounter platform
Gene expression analysis was performed on the nCounter platform (NanoString Technologies Inc., Seattle, WA)31 using the PanCancer IO 360 Gene Expression Panel.32 A total of 150 ng of total RNA from 24 primary BM samples was used in each reaction. Hybridization of probes was carried out at 65°C for 20 hours. Posthybridization samples were purified using a NanoString Prep Station and immobilized onto a cartridge. Raw data were acquired using the nCounter FLEX Analysis System with a scanning resolution of 555 field of view using the probe annotation file NS_IO360_V1.0. Quality controls, data normalization, and differential expression analysis were performed using the nSolver advanced analysis module (version 2.0.115) according to the manufacturer’s instructions. The Benjamini-Yekutieli method was used to generate an adjusted P value.
Pan-cancer analysis
Survival meta-analyses of TCGA cancer datasets were performed using the GEPIA2 web server at http://gepia2.cancer-pku.cn/.33
Deconvolution analysis
Deconvolution analysis of AML-TCGA and Genotype-Tissue Expression (GTEx) datasets was performed using the GEPIA202134 web server (http://gepia2021.cancer-pku.cn/) through the EPIC method35 to estimate the proportion of immune and stromal cells from bulk gene expression data.
Statistical methods
Differences between sets of data were considered statistically significant for P values < 0.05. Statistical analyses were performed using the IBM SPSS Statistics (version 25), GraphPad Prism software packages (version 7), and R (version 4.0.4).
Results
A 2-gene BIN1-IDO1 signature predicts OS in AML
In the attempt to develop an IDO1-related immune signature that predicts clinical outcome in AML, we initially focused on BIN1, a master regulator of IDO1 in solid tumors,13 and we found that IDO1 and BIN1 mRNA expressions were anticorrelated (r = −0.41, P < .0001; Figure 1A). Of note, RMB25, known to be a key modulator of BIN1 expression,14 correlated both with BIN1 (Pearson R = −0.29, P < .0001; supplemental Figure 1A) and IDO1 (Pearson R = 0.46, P < .0001; supplemental Figure 1B). We next investigated the impact of IDO1 and BIN1 expression on AML survival. To minimize any bias from differences in treatment approaches (intensive vs nonintensive, curative vs palliative) and to increase comparability among patient groups, we stratified HOVON cases based on patient age. We analyzed only patients younger than age 65 years, thus reducing the likelihood of including patients who were not treated with curative intent. We plotted the normalized IDO1 and BIN1 mRNA expression in a single score using a previously reported formula29 and split the HOVON cohort into 3 groups according to the score quartile. OS was significantly different among the 3 score groups (P < .01; Figure 1B). With a median follow-up of 8.1 years (95% confidence interval [CI], 7.0-9.2), patients in the low- and intermediate-score groups showed significantly longer OS than those in the high-risk score (low-score group: median OS = 1.9 years [95% CI, 0.2-3.5], intermediate-score group: median OS = 1.8 years [95% CI, 1.3-2.3], high-score group: median OS = 1.1 years [95% CI, 0.8-1.4]). In particular, the comparison among high-, intermediate-, and low-score groups showed a hazard ratio (HR) of 1.5 (95% CI, 1.1- 2.0; P < .01). These data therefore indicate that an IDO1-centered gene signature may predict OS in AML.
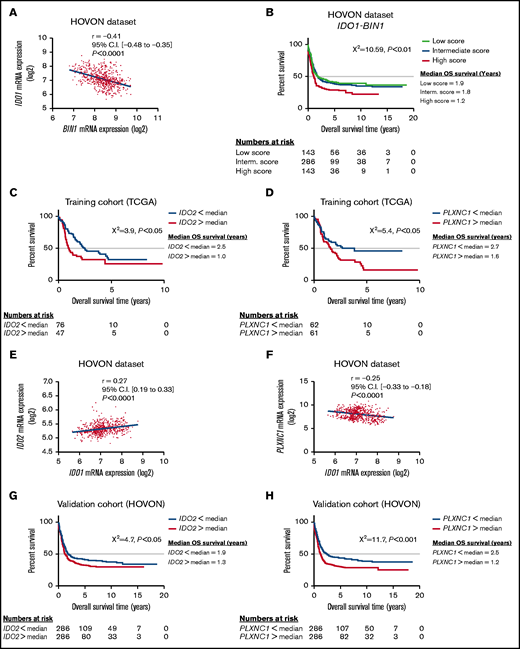
IDO1-BIN1 signature predicts AML survival and may be refined by adding IDO1-interacting genes. (A) Correlation between IDO1 and BIN1 gene expression values in the HOVON cases (r = −0.41, P < .0001). (B) Kaplan-Meier estimates of OS in the HOVON cases according to the IDO1-BIN1 score (P < .01). Patients were split into 3 different groups according to score quartiles. (C) Kaplan-Meier estimates of OS according to IDO2 expression in the TCGA-AML dataset (IDO2 median expression value used as cutoff, P < .05). (D) Kaplan-Meier estimates of OS according to PLXNC1 expression in the TCGA-AML dataset (PLXNC1 median expression value used as cutoff, P < .05). (E) Correlation between IDO1 and IDO2 gene expression values in the HOVON cases (r = 0.27, P < .0001). (F) Correlation between IDO1 and PLXNC1 gene expression values in the HOVON cohort of patients (r = −0.25, P < .0001). (G) Kaplan-Meier estimates of OS according to IDO2 expression in the HOVON dataset (IDO2 median expression value used as cutoff, P < .05). (H) Kaplan-Meier estimates of OS according to PLXNC1 expression in the HOVON dataset (PLXNC1 median expression value used as cutoff, P < .001).
IDO1-BIN1 signature predicts AML survival and may be refined by adding IDO1-interacting genes. (A) Correlation between IDO1 and BIN1 gene expression values in the HOVON cases (r = −0.41, P < .0001). (B) Kaplan-Meier estimates of OS in the HOVON cases according to the IDO1-BIN1 score (P < .01). Patients were split into 3 different groups according to score quartiles. (C) Kaplan-Meier estimates of OS according to IDO2 expression in the TCGA-AML dataset (IDO2 median expression value used as cutoff, P < .05). (D) Kaplan-Meier estimates of OS according to PLXNC1 expression in the TCGA-AML dataset (PLXNC1 median expression value used as cutoff, P < .05). (E) Correlation between IDO1 and IDO2 gene expression values in the HOVON cases (r = 0.27, P < .0001). (F) Correlation between IDO1 and PLXNC1 gene expression values in the HOVON cohort of patients (r = −0.25, P < .0001). (G) Kaplan-Meier estimates of OS according to IDO2 expression in the HOVON dataset (IDO2 median expression value used as cutoff, P < .05). (H) Kaplan-Meier estimates of OS according to PLXNC1 expression in the HOVON dataset (PLXNC1 median expression value used as cutoff, P < .001).
PLXNC1 correlates with IDO1 and affects OS both in TCGA- and HOVON-AML cases
To identify other genes in the network that could be incorporated into the prognostic score based on IDO1-BIN1 signature, we performed a coexpression analysis on TCGA cases25,26 (Table 4). This approach identified IDO2, CD1C, CD1E, XCR1, and PLXNC1 as the top 5 coexpressed genes. The median expression of each gene was selected as a cutoff to split TCGA-AML patients into 2 groups (high and low) and was then correlated with patient survival. Interestingly, among the top 5 IDO1-correlated genes, only IDO2 and PLXNC1 showed a significant impact on AML survival in univariate analyses (log-rank P < .05; Figures 1C-D). The correlations between IDO1, IDO2, and PLXNC1 (IDO1 vs IDO2: r = 0.27, 95% CI [0.19-0.33], P < .0001, Figure 1E; IDO1 vs PLXNC1: r = −0.25, 95% CI [−0.33 to −0.18], P < .0001; Figure 1F) as well as their impact on AML survival were independently validated in the HOVON dataset (IDO2: log-rank P < .05, Figure 1G; and PLXNC1: log-rank P < .001, Figure 1H). As shown by Cox regression analyses, the IDO1-PLXNC1 signature was the only predictor of survival (IDO1: β = 0.68, HR = 1.99, and P < .05; PLXNC1: β = 0.84, HR = 2.32, and P < .01). Taken together, these data indicate that PLXNC1 is a novel IDO1-related gene that stratifies survival.
Gene list resulting from IDO1-focused coexpression analyses of RNA-sequencing AML-TCGA data
| Correlated gene | Cytoband | Spearman’s correlation | P value | q value |
|---|---|---|---|---|
| IDO2 | 8p11,21 | 0.45 | P < .001 | P < .001 |
| CD1C | 1q23,1 | 0.39 | P < .001 | P < .01 |
| CD1E | 1q23,1 | 0.38 | P < .001 | P < .01 |
| XCR1 | 3p21,31 | 0.38 | P < .001 | P < .01 |
| PLXNC1 | 12q22 | 0.37 | P < .001 | P < .01 |
Incorporation of PLXNC1 into the IDO1-BIN1 score improves the predictive power of the gene signature
Given the established interactions between IDO1, PLXNC1, and BIN1 and their potential impact on AML survival, we plotted the 3 genes together in a 3-gene signature to develop a new score, which was then tested for its prognostic value. The resulting IDO1-BIN1-PLXNC1 signature was predictive of OS (IDO1: β = 1.032, HR = 2.81, P < .01; BIN1: β = 0.758, HR = 2.13, P < .05; and PLXNC1: β = 0.820, HR 2.27, P < .01; Table 5), which prompted us to split patients into 3 groups using score quartiles as cutoff.
Results of Cox regression analysis including IDO1, BIN1, and PLXNC1 genes in the HOVON dataset
| Genes | Significance | HR (95% CI) |
|---|---|---|
| BIN1 | P < .05 | 2.13 (1.17-3.90) |
| IDO1 | P < .01 | 2.81 (1.44-5.47) |
| PLXNC1 | P < .01 | 2.27 (1.35-3.81) |
| Genes | Significance | HR (95% CI) |
|---|---|---|
| BIN1 | P < .05 | 2.13 (1.17-3.90) |
| IDO1 | P < .01 | 2.81 (1.44-5.47) |
| PLXNC1 | P < .01 | 2.27 (1.35-3.81) |
Kaplan-Meier analysis showed a significantly different OS for the 3 score groups (P < .0001). In particular, among the 572 HOVON patients, the highest score predicted the shortest survival. With a median follow-up of 8.1 years (95% CI, 7.0-9.2), low- and intermediate-score groups showed a median OS of 2.9 years (95% CI, 0.0-6.0) and 1.6 years (95% CI, 1.2-2.1), respectively, whereas high score group correlated with a median OS of 1.1 years (95% CI, 0.8-1.5) (Figure 2A). Intermediate- and high-score groups vs low-score group showed HRs of 1.2 (95% CI, 1.0-1.6, P = NS) and 1.8 (95% CI, 1.4-2.4, P < .01), respectively. However, the IDO1-BIN1-PLXNC1 signature did not significantly stratify patients according to European LeukemiaNet (ELN) cytogenetic risk groups (supplemental Figure 2A-D). In FLT3 wild-type patient score values resulted significantly higher than those of FLT3-mutated ones (P < .001; supplemental Figure 2E). Among FLT3 wild-type patients, the score remained statistically significant (P < .0001; supplemental Figure 2F). Of note, IDO1-BIN1-PLXNC1-based score was capable of predicting OS both in patients treated only with chemotherapy (Figure 2B) and in those who received allogeneic hematopoietic stem transplantation (HSCT) (Figure 2C). To validate these results, the score was implemented in the TCGA dataset by using the same Cox regression coefficients derived from the analysis performed on the HOVON cases. Overall, the predictive ability of the score remained highly significant (P < .01; Figure 2D). However, the score affected OS of patients who received chemotherapy only (P < .0001; Figure 2E), whereas no statistically significant difference was observed in patients undergoing allogeneic HSCT (Figure 2F). We further confirmed the 3 different survival groups identified by IDO1-BIN1-PLXNC1 signature in the GSE106291 dataset (P < .05; supplemental Figure 3).

IDO1-BIN1-PLXNC1 score predicts AML survival. (A) PLXNC1 mRNA expression value was added to IDO1 and BIN1 mRNA expression values to generate a new signature. The figure shows Kaplan-Meier estimates of OS according to IDO1-BIN1-PLXNC1 score quartiles in the HOVON cohort of patients (P < .0001). (B) Kaplan-Meier estimates of OS according to IDO1-BIN1-PLXNC1 score quartiles in patients of the HOVON cohort who received chemotherapy alone (P < .001) or (C) received chemotherapy and allogeneic transplantation (P < .05). (D) Kaplan-Meier estimates of OS according to IDO1-BIN1-PLXNC1 score quartiles in the TCGA-AML dataset (P < .01). (E) Kaplan-Meier estimates of OS according to IDO1-BIN1-PLXNC1 score quartiles in patients of the TCGA-AML dataset who received chemotherapy alone (P < .0001) or (F) who received chemotherapy and allogeneic transplantation (P = not significant).
IDO1-BIN1-PLXNC1 score predicts AML survival. (A) PLXNC1 mRNA expression value was added to IDO1 and BIN1 mRNA expression values to generate a new signature. The figure shows Kaplan-Meier estimates of OS according to IDO1-BIN1-PLXNC1 score quartiles in the HOVON cohort of patients (P < .0001). (B) Kaplan-Meier estimates of OS according to IDO1-BIN1-PLXNC1 score quartiles in patients of the HOVON cohort who received chemotherapy alone (P < .001) or (C) received chemotherapy and allogeneic transplantation (P < .05). (D) Kaplan-Meier estimates of OS according to IDO1-BIN1-PLXNC1 score quartiles in the TCGA-AML dataset (P < .01). (E) Kaplan-Meier estimates of OS according to IDO1-BIN1-PLXNC1 score quartiles in patients of the TCGA-AML dataset who received chemotherapy alone (P < .0001) or (F) who received chemotherapy and allogeneic transplantation (P = not significant).
Taken together, these data suggest that IDO1-BIN1-PLXNC1 gene signature may predict OS in patients with AML, especially when treated with chemotherapy only.
Targeted immune transcriptomic profiling of IDO1 and PLXNC1 high/low patients uncovers nonoverlapping pathways and identifies a parsimonious gene set predicting AML outcome
First, a deconvolution analysis was applied to the AML-TCGA and GTEx datasets through the EPIC method35 to explore IDO1 and PLXNC1 gene subexpression in single cell types. Interestingly, both IDO1 and PLXNC1 expression by B cells, T cells, and macrophages resulted to be higher in AML samples when compared with healthy donor BM samples (supplemental Figure 4A-B).
We next profiled unfractionated BM samples from a cohort of 24 patients with newly diagnosed AML using the nCounter platform, which allows the quantitative measurement of mRNA species without RNA amplification. To identify transcriptional patterns associated with changes in IDO1 and PLXNC1 expression, the patient cohort was split according to the median value of IDO1 and PLXNC1 as detected by RT-PCR. The top 20 differentially expressed (DE) genes between PLXNC1high/low and IDO1high/low samples (value threshold of 0.01; log2 fold-change threshold of 1.4; supplemental Tables 2 and 3) showed negligible overlap (Figure 3A), suggesting that PLXNC1 and IDO1 expression may reflect nonredundant biological processes in AML. We next showed that the expression of the top 20 DE genes between PLXNC1high/low and IDO1high/low samples was higher in TCGA-AML cases compared with blood samples from healthy donors available through the GTEx project (Figure 3B). Pathway enrichment analysis using the DE genes between PLXNC1high/low samples as an input showed that viral infection, apoptosis regulation, glucose metabolism, and c-met signaling were among the most significantly enriched pathways in samples with high expression of PLXNC1 (Figure 3C). In contrast, samples with high IDO1 expression were significantly enriched in interferon (IFN) signaling, cytokine-cytokine receptor interaction, and IFN-γ response pathways (Figure 3D). Notably, the top 20 DE genes between PLXNC1high/low samples were able to stratify survival in TCGA cases. In particular, patients with higher than median gene expression showed significantly worse survival estimates than patients with lower than median gene expression (HR = 1.6; log-rank P = .026; Figure 4A). In addition, the DE genes between IDO1high/low samples were able to assist outcome prediction in TCGA-AML (HR = 2.0; log-rank P = .002; Figure 4B).
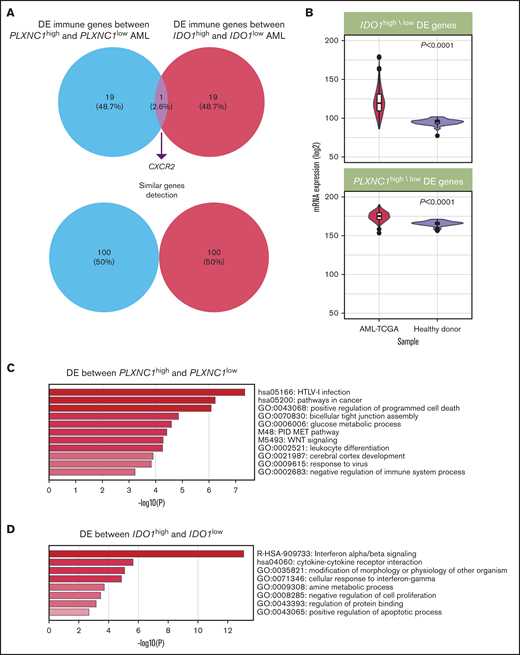
IDO1 and PLXNC1 are overexpressed and may reflect independent biological processes in AML. (A) Representation of the top 20 DE genes between PLXNC1high/low and IDO1high/low samples (P value threshold of 0.01; log2 fold-change threshold of 1.4). (B) The expression of the top 20 DE genes between PLXNC1high/low and IDO1high/low samples was higher in TCGA-AML cases compared with blood samples from healthy donors available through the GTEx project. (C) Enrichment analysis showing the top significant pathways associated with DE genes between PLXNC1high/low samples. (D) Enrichment analysis showing the top significant pathways associated with DE genes between IDO1high/low samples.
IDO1 and PLXNC1 are overexpressed and may reflect independent biological processes in AML. (A) Representation of the top 20 DE genes between PLXNC1high/low and IDO1high/low samples (P value threshold of 0.01; log2 fold-change threshold of 1.4). (B) The expression of the top 20 DE genes between PLXNC1high/low and IDO1high/low samples was higher in TCGA-AML cases compared with blood samples from healthy donors available through the GTEx project. (C) Enrichment analysis showing the top significant pathways associated with DE genes between PLXNC1high/low samples. (D) Enrichment analysis showing the top significant pathways associated with DE genes between IDO1high/low samples.
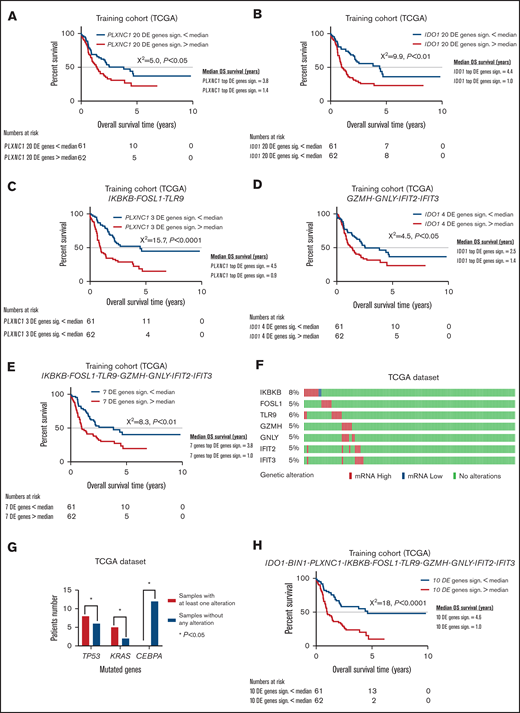
New immune signatures emerge from differently expressed genes between PLXNC1high/low and IDO1high/low samples. (A) Kaplan-Meier estimates of OS according to the signature composed by the top 20 DE genes between PLXNC1high/low samples in the TCGA-AML cases (median used as cutoff, P < .05). (B) Kaplan-Meier estimates of OS according to the signature composed by the top 20 DE genes between IDO1high/low samples in the TCGA-AML cases (median used as cutoff, P < .01). (C) Kaplan-Meier estimates of OS according to the signature composed by the top 3 DE genes (IKBKB, FOSL1, and TLR9) between PLXNC1high/low samples in the TCGA-AML cases (median used as cutoff, P < .0001). (D) Kaplan-Meier estimates of OS according to the signature composed by the top 4 DE genes (GZMH, GNLY, IFIT2, and IFIT3) between IDO1high/low samples in TCGA-AML cases (median used as cutoff, P < .05). (E) Kaplan-Meier estimates of OS according to the signature composed by the top 3 DE genes from the PLXNC1high/low signature (IKBKB, FOSL1, and TLR9) and the top 4 DE genes from IDO1high/low signature (GZMH, GNLY, IFIT2, and IFIT3) in the TCGA-AML dataset (median used as cutoff, P < .01). (F) Representation of genetic alterations of the 7 DE genes deriving from the PLXNC1high/low and IDO1high/low signatures (IKBKB, FOSL1, TLR9, GZMH, GNLY, IFIT2, and IFIT3) in the TCGA-AML dataset. (G) Comparison of frequency of mutations between samples with abnormalities (mRNA high/low) vs without abnormalities of the 7 DE genes derived from the PLXNC1high/low and IDO1high/low signatures (IKBKB, FOSL1, TLR9, GZMH, GNLY, IFIT2, and IFIT3). (H) Kaplan-Meier estimates of OS according to the signature composed by the integration of the 7 DE genes derived from the PLXNC1high/low and IDO1high/low signatures (IKBKB, FOSL1, TLR9, GZMH, GNLY, IFIT2, and IFIT3) with the IDO1, BIN1, and PLXNC1 genes in the TCGA-AML dataset (median used as cutoff, P < .0001).
New immune signatures emerge from differently expressed genes between PLXNC1high/low and IDO1high/low samples. (A) Kaplan-Meier estimates of OS according to the signature composed by the top 20 DE genes between PLXNC1high/low samples in the TCGA-AML cases (median used as cutoff, P < .05). (B) Kaplan-Meier estimates of OS according to the signature composed by the top 20 DE genes between IDO1high/low samples in the TCGA-AML cases (median used as cutoff, P < .01). (C) Kaplan-Meier estimates of OS according to the signature composed by the top 3 DE genes (IKBKB, FOSL1, and TLR9) between PLXNC1high/low samples in the TCGA-AML cases (median used as cutoff, P < .0001). (D) Kaplan-Meier estimates of OS according to the signature composed by the top 4 DE genes (GZMH, GNLY, IFIT2, and IFIT3) between IDO1high/low samples in TCGA-AML cases (median used as cutoff, P < .05). (E) Kaplan-Meier estimates of OS according to the signature composed by the top 3 DE genes from the PLXNC1high/low signature (IKBKB, FOSL1, and TLR9) and the top 4 DE genes from IDO1high/low signature (GZMH, GNLY, IFIT2, and IFIT3) in the TCGA-AML dataset (median used as cutoff, P < .01). (F) Representation of genetic alterations of the 7 DE genes deriving from the PLXNC1high/low and IDO1high/low signatures (IKBKB, FOSL1, TLR9, GZMH, GNLY, IFIT2, and IFIT3) in the TCGA-AML dataset. (G) Comparison of frequency of mutations between samples with abnormalities (mRNA high/low) vs without abnormalities of the 7 DE genes derived from the PLXNC1high/low and IDO1high/low signatures (IKBKB, FOSL1, TLR9, GZMH, GNLY, IFIT2, and IFIT3). (H) Kaplan-Meier estimates of OS according to the signature composed by the integration of the 7 DE genes derived from the PLXNC1high/low and IDO1high/low signatures (IKBKB, FOSL1, TLR9, GZMH, GNLY, IFIT2, and IFIT3) with the IDO1, BIN1, and PLXNC1 genes in the TCGA-AML dataset (median used as cutoff, P < .0001).
In the attempt to refine our 20-gene signatures, we focused on genes that were individually associated with significant differences in OS in TCGA cases. Interestingly, IKBKB, FOSL1, and TLR9 in the PLXNC1high/low signature and GZMH, GNLY, IFIT2, and IFIT3 in the IDO1high/low signature stratified patient survival (HR = 2.4 and log-rank P < .0001; HR =1.6 and log-rank P = .03, respectively; Figures 4C-D). The ability to predict outcomes was improved by combining the 7 DE genes in the PLXNC1high/low and IDO1high/low signatures (HR = 1.9 and log-rank P = .004; Figure 4E). As the next step, we asked whether deregulated expression of the 7 DE genes correlated with specific molecular features in TCGA cases. As shown in Figure 4F, no mutations of the 7 DE genes were documented in TCGA patients. In contrast, abnormalities in the 7 genes used in the query (by default, nonsynonymous mutations, fusions, amplifications, and deep deletions) were detected in 28% of TCGA cases (Figure 4G) and were significantly enriched in patients with adverse-risk molecular features, including TP53 and KRAS mutations36 (P = .016 and P = .019, respectively). Further analyses of mutual exclusivity and cooccurrence patterns indicated that CEBPA mutations, which correlate with more favorable prognosis,36 were negatively associated with abnormalities in the 7 DE genes (P = .016). Moreover, we added the IDO1, BIN1, and PLXNC1 genes to the previously discovered 7 DE genes. The combined 10-gene signature was highly predictive of AML outcome (HR = 2.6 and log-rank P < .0001; Figure 4H). The 7- and 10-gene signatures also predicted survival in the HOVON dataset (respectively, P < .05, supplemental Figure 5A; and P < .0001, supplemental Figure 5B). When patients were stratified by cytogenetic risk, no statistically significant differences in survival emerged according to the 10-gene signature (supplemental Figure 5C-E). Furthermore, regarding FLT3 mutational status, the 10-gene signature enabled survival prediction only in FLT3 wild-type patients (P < .001; supplemental Figure 5F).
Finally, we performed a pan-cancer analysis of TCGA solid tumor types. The expression of genes in the PLXNC1-derived and IDO1-derived signatures in matched tumor samples and adjacent normal tissues is shown in supplemental Figures 6 and 7. This analysis indicated that individual genes in the PLXNC1-derived signature may retain prognostic relevance also in selected solid tumor cell types, including low-grade glioma, and hepatocellular, lung, and adrenocortical carcinoma (supplemental Figure 8A). In contrast, the prognostic power of genes in the IDO1-derived signature was restricted to low-grade glioma, thymoma, and uveal melanoma (supplemental Figure 8B). Taken together, these data indicate that IDO1 and PLXNC1 are implicated in nonoverlapping biological mechanisms and may refine the accuracy of survival prediction in AML.
Discussion
Our data indicate that IDO1 is pivotal for the construction of an immune gene signature predictive of survival in AML patients. Based on its well-known immunologic properties, IDO1 was used as a key input gene to further explore the immunogenomic AML landscape and to identify genes that could be incorporated into a novel prognostic signature for newly diagnosed AML. We identified a previously unexplored correlation between IDO1 and BIN1 in AML and we demonstrated that this 2-gene score predicts OS. Indeed, inclusion of the IDO1-interacting gene PLXNC1 improved the predictive ability of the IDO1-BIN1 signature, especially in patients who received chemotherapy. This observation prompted us to explore the IDO1-related gene network in depth, leading to the identification of highly predictive 7- and 10-gene immunological signatures.
In solid tumors, BIN1 negatively regulates IDO1 expression at the level of IFN-γ-related transcription program via STAT1- and NF-κB.13 Here, we report for the first time that a similar negative correlation between IDO1 and BIN1 mRNA expression exists in AML. Moreover, we showed that a low expression of the key BIN1-regulator RBM2514 correlates with high BIN1 and low IDO1 levels in AML, suggesting a common molecular pathway in IDO1 gene regulation, which may be shared across tumors of different histological types and cell of origin. In line with a previous report,13 our data highlight that IDO1 expression is mainly associated to IFN-related pathways. Of note, our study identified a novel set of IDO1-interacting genes, among which PLXNC1 emerged as a crucial and master one. In myeloid precursors, PLXNC1 expression is restrained by the RUNX1 transcription factor and dependent on KIT signaling.37 Although its function is still elusive, Plexin C1 as receptor for semaphorin 7A38 dampens the acute inflammatory response through the regulation of dendritic cell (DC) activity and migration.38,39 Our data expand to the AML setting the characterization of PLXNC1. In particular, PLXNC1 was co-regulated with genes involved in T-cell differentiation, lymphocyte proliferation, and activation, consistently with the previously mentioned preferential activity of Plexin C1 in the activation of T-cell immune response via DCs. Overall, this analysis revealed an enrichment in pathways correlated with immune response, thus supporting our hypothesis that an IDO1-centered gene signature may be a useful tool to prognostically dissect AML immunological landscape.
By first moving from the negative correlation between IDO1 and BIN1, we demonstrated that these 2 genes constitute a molecular signature, which may predict OS. The addition of PLXNC1 to IDO1 and BIN1 resulted in a more powerful gene immune signature predicting survival, which was further implemented leading to the identification of a highly predictive 7- and 10-gene immunological signature. The robustness of the proposed immune signatures is confirmed by the fact that they retain their predictive value when applied to independent AML datasets. In both HOVON and TCGA-AML, the ability of the IDO1-BIN1-PLXCN1 gene signature to stratify survival was highly significant especially when we analyzed patients who received chemotherapy. Although this finding warrants further investigation, it may suggest that, along with established leukemic cell-intrinsic chromosomal translocations and genetic mutations, cell-autonomous and immune-related factors, such as those deriving from the immune TME, may contribute to regulate response to conventional chemotherapy. Indeed, an increasing body of evidence has highlighted the immunomodulatory effects of some antineoplastic agents, especially anthracyclines, which may act as adjuvants of the immune system along with inducing antiproliferative effects on tumor cells.40 In AML, we reported that chemotherapy is capable to reshape leukemic microenvironment by activating immune effector T cells and, concomitantly, inducing IDO1-expressing tolerogenic DCs and T regulatory cells.41 These data support the notion that the immune composition of BM microenvironment may influence the response to chemotherapy.
Of note, a close association between the immunological TME and cancer-intrinsic genomic alterations has been recently highlighted42 and correlated to the response to chemotherapy. In AML, a specific TME-related immunogenomic profile correlates with increased chemoresistance and with response to immunotherapy,43 and a correlation between TP53 mutations and an immunosuppressive TME has been recently established.44,45 Of note, our targeted immune transcriptomic profiling revealed that abnormalities in immune-related genes in the PLXNC1high/low and IDO1high/low signatures were more frequently documented in patients with adverse-risk molecular features, including TP53 and KRAS mutations, whereas they were negatively correlated with CEBPA mutations, known to confer favorable prognosis and better response to chemotherapy. Consistently, higher levels of PLXNC1 were observed in AML patients with cytogenetic abnormalities, whereas lower mRNA levels were reported in patients with CEBPA mutations and with inv(16) or t(8;21).46,47
Regarding patients who received chemotherapy and allogeneic transplantation, the predictive ability of the IDO1-BIN1-PLXCN1 gene signature is retained in the HOVON dataset, whereas it is not confirmed in the TCGA dataset. Although a formal demonstration was not the main focus of our work, we have argued that the differences in the predicting value of our score among patients who underwent allogeneic transplantation and those who received only chemotherapy may rely on the impact that allogeneic transplantation could exert on tumor immunologic microenvironment.
In conclusion, our data shed light into the biological significance of immune-related gene networks in AML prognostication. In this scenario, IDO1 emerged as pivotal and paramount for the construction of powerful predictive immune gene signatures. In an era of emerging novel approaches targeting the immune system, our results highlight the need to integrate immunogenomic biomarkers into current AML prognostic classification system.
Acknowledgments
The authors thank Marie-Paule Vedrine and Bologna AIL (Associazione Italiana contro le Leucemie)/Section of Bologna for the kind support.
The research was supported by FATRO/Foundation Corrado and Bruno Maria Zaini-Bologna, Fabbri1905, Bologna AIL (Associazione Italiana contro le Leucemie)/Section of Bologna, Associazione Italiana per la Ricerca sul Cancro (IG20654 to A.C.), and the John and Lucille van Geest Foundation (to S. Rutella). M.C. was supported by the University of Bologna (Alma Idea Junior Grant 2017).
Authorship
Contribution: S. Ragaini, S.W., S. Rutella, and A.C. designed the project and supervised the study; S. Ragaini, S.W., J.V., and S. Rutella processed primary patient samples, performed in silico and bioinformatic analyses, and interpreted gene expression data; S. Parisi, G.M., C.S., J.N., G. Cristiano, A.T., M.O., D.O., M. Ciciarello, G. Corradi, E.O., C.P., S. Paolini, and J.V. contributed to data collection and reviewed the manuscript; S. Ragaini, S. Rutella, and A.C. wrote the paper; M. Cavo supervised the study and reviewed the manuscript; and all authors provided final approval of the manuscript.
Conflict-of-interest disclosure: M. Cavo reports consultancies and honoraria from Jannsen, BMS, Celgene, Sanofi, GlaxoSmithKline, Takeda, Amgen, Oncopeptides, AbbVie, Karyopharm, and Adaptive. S. Rutella reports research funding from NanoString Technologies, Inc., MacroGenics, Inc., and Kura Oncology. A.C. reports consultancies, honoraria, and research funding from Novartis, Pfizer, and Abbvie. The remaining authors declare no competing financial interests.
Data sharing statement: The results shown in this paper are in part based upon data retrieved from the Cancer Genome Atlas (TCGA) profiling project and the HOVON (E-MTAB-3444) dataset. The data referring to the validation cohort are included in the Gene Expression Omnibus database (accession number GSE146204).
Correspondence: Michele Cavo, Istituto di Ematologia “Seràgnoli,” Dipartimento di Medicina Specialistica, Diagnostica e Sperimentale, Università degli Studi di Bologna, IRCCS Azienda Ospedaliero-Universitaria di Bologna, via Massarenti 9, Bologna 40138, Italy; e-mail: michele.cavo@unibo.it.

