

Key Points
Hcy increases integrin αIIbβ3 activation by promoting phospholipid hydrolysis and ATX interaction in platelets.
Targeting ATX-mediated integrin αIIbβ3 activation alleviates HHcy-potentiated thrombosis.

Abstract
Hyperhomocysteinemia (HHcy) is associated with an exaggerated platelet thrombotic response at sites of vascular injury. In this study, human medical examination showed that elevated human plasma Hcy levels correlated positively with enhanced blood coagulation and platelet activity, suggesting that humans with HHcy are more prone to thrombus formation at the sites of vascular injury. Accordingly, we observed accelerated platelet activation, primary hemostasis, and thrombus formation in apolipoprotein E-deficient (ApoE−/−) mice with acute or chronic HHcy. Upon homocysteine (Hcy) administration in C57BL/6J mice, platelet aggregation, spreading and clot retraction were markedly induced. More important, Hcy increased the affinity of platelet integrin αIIbβ3 with ligands and enhanced integrin outside-in signaling by promoting membrane phosphatidylserine exposure in vitro. Mechanistically, lipidomics analysis showed that lysophosphatidylcholines were the primary metabolites leading to clustering of HHcy-stimulated platelets. Cytosolic phospholipase A2 (cPLA2) activity and autotaxin (ATX, a secreted lysophospholipase D) secretion were upregulated by Hcy, leading to membrane phospholipid hydrolysis and PS exposure. Moreover, secreted ATX directly interacted with integrin β3. Inhibitors of cPLA2 and ATX activity blocked integrin αIIbβ3 outside-in signaling and thrombosis in HHcy ApoE−/− mice. In this study, we identified a novel mechanism by which HHcy promotes platelet membrane phospholipid catabolism and extracellular ATX secretion to activate integrin outside-in signaling, consequently exacerbating thrombosis and the results revealed an innovative approach to treating HHcy-related thrombotic diseases.
Introduction
Homocysteine (Hcy) is a thiol-containing nonproteinogenic amino acid that is derived from methionine metabolism. Generally, a high plasma Hcy level (>15 μM) is clinically defined as hyperhomocysteinemia (HHcy), which is widespread in Asia because of dietary and genetic factors.1-3 Clinical studies have revealed a close association between HHcy and thrombotic diseases, and HHcy has been identified as a risk factor for stroke and heart attack by the American Heart Association.4 Most patients with HHcy die of various complications associated with atherothrombotic diseases, particularly stroke and myocardial infarction.2
Platelets play a critical role in the development of atherothrombotic diseases by initiating and propagating plaque development.5 The platelets from individuals with HHcy are more reactive than platelets from those without HHcy.6,7 HHcy platelets have elevated cytosolic calcium8 and increased thromboxane A2 (TXA2) levels.6,9 In addition, increased production10 of reactive oxygen species and activation11 of glycoprotein VI signaling contribute to alterations in HHcy-activated platelets. The clinical management of thrombosis risk in patients with HHcy is complicated because platelets are less responsive to the inhibitory effect of the conventional antiplatelet agent aspirin12 and to Hcy-lowering agents, such as folic acids and vitamin B2. The main reason for this altered responsiveness may be that individuals with HHcy are likely to form stable thrombi,13 which are strongly related to irreversible platelet adhesion and aggregation. Therefore, it is urgent to elucidate the underlying mechanisms and develop new therapeutic strategies for HHcy-mediated thrombotic diseases.
Platelet activation is associated with significant changes in membrane lipids, and the formation of diverse bioactive lipids plays essential roles in hemostasis and thrombosis. A major early response of platelet activation involves several phospholipase switches, including cytosolic phospholipase A2 (cPLA2) isoforms, which generate fatty acids and lysophosphatidylcholine (LPC) by hydrolyzing the sn-2 position of phosphatidylcholine (PC).14 Next, autotaxin (ATX), a secreted form of lysophospholipase D (lysoPLD), catalyzes the conversion of LPC to lysophosphatidic acid (LPA),14,15 relying on its catalytic phosphodiesterase domain, and a lack of lysoPLD results in impaired platelet integrin αIIbβ3 activation.16 During platelet activation, phospholipases cleave membrane phospholipids to generate lipid and soluble second messengers, which are associated with significant structural alterations to platelet membranes, including shape changes, spreading and degranulation, as well as the generation of bioactive prothrombotic species.14 In addition, activated platelet membrane phospholipid hydrolysis may disrupt the stabilized state of the integrin transmembrane complex and membrane lipids, leading to platelet integrin being further activated with conformational changes.17,18 However, whether Hcy influences phospholipid metabolism of platelet membrane and subsequently contributes to platelet activation should be investigated.
In this study, HHcy significantly amplified murine platelet activation. It increased the platelet integrin αIIbβ3 high-affinity state and enhanced outside-in signaling by membrane phospholipid hydrolysis via cPLA2 activation, especially ATX secretion. This study provides a novel target for intervention and a therapeutic strategy for platelet hyperactivity in HHcy-induced thrombotic diseases.
Methods
Clinical samples
Human subject procedures were reviewed and approved by Peking University Third Hospital. Clinical samples from medical examination records of human subjects were collected from Peking University Third Hospital. All experiments were conducted according to the principles expressed in the Declaration of Helsinki. Patients with hypertension, diabetes, or liver or kidney dysfunction were excluded. The patients were age-matched with or without HHcy for the study (n = 88). Plasma Hcy levels, activated partial thromboplastin time (APTT), and prothrombin time (PT) were obtained from patients’ records in the hospital medical examination database. The baseline characteristics of the subjects are summarized in supplemental Table 1.
HHcy mouse models
C57BL/6J mice and apolipoprotein E-deficient (ApoE−/−) mice between 6 and 8 weeks of age were purchased from the Animal Center of Peking University Health Sciences Center (Beijing, China). To induce acute HHcy in mice, we injected different types of mice intraperitoneally with Hcy (100 mg/kg; DL-Hcy, Sigma, St Louis, MO). The control group was injected with saline. To induce chronic HHcy, we fed the different types of mice a normal chow diet and drinking water supplemented with or without 1.8 g/L Hcy for 3 weeks, as previously described.19 Plasma Hcy levels were measured on an ARCHITECT i2000SR analyzer (Abbott Laboratories Philippines, Taguig City, Philippines). All animal procedures were reviewed and approved by the Institutional Animal Care and Use Committee of Peking University Health Science Center in accordance with the U.S. Department of Agriculture, International Association for the Assessment and Accreditation of Laboratory Animal Care, and National Institutes of Health (Bethesda, MD) guidelines.
Platelet preparation
Six- to 8-week-old C57BL/6J mice were anesthetized with 1% pentobarbital. Whole blood was drawn from the inferior vena cava and anticoagulated with a 1:7 volume of acid-citrate-dextrose (2.5% trisodium citrate, 2.0% d-glucose, and 1.5% citric acid). Platelet-rich plasma was collected from whole blood by centrifugation at 200g for 11 minutes. Platelets were washed twice with CGS buffer (123 mM NaCl, 33 mM d-glucose, 13 mM trisodium citrate [pH 6.5]), resuspended in modified Tyrode’s buffer (MTB: 2.5 mM HEPES, 150 mM NaCl, 2.5 mM KCl, 12 mM NaHCO3, 5.5 mM d-glucose, 1 mM CaCl2, and 1 mM MgCl2 [pH 7.4]), to a final concentration of 300 × 103/μL, and left to incubate at room temperature for 1 to 2 hours before use.
Platelet aggregation and adenosine triphosphate secretion
C57BL/6J mice were injected intraperitoneally with or without Hcy (100 mg/kg). Then, platelets (300 × 103/μL; 250 μL) were harvested 2 hours later. The control group was injected with saline. For the in vitro Hcy stimulation assay, washed platelets from C57BL/6J mice (300 × 103/μL; 250 μL) were incubated with or without 100 μM Hcy for 10 minutes at 37°C. After treatments, the platelets were stimulated with different agonists, including adenosine diphosphate (ADP Pharmabiology, Beijing, China), collagen, thrombin (Sigma-Aldrich, St Louis, MO), and the thromboxane A2 analogue U46619 (Cayman Chemical, Ann Arbor, MI), with the concentrations indicated in the figure legends. Then, platelet aggregation and secretion were recorded by a Chrono-Log lumi-aggregometer at 37°C with constant stirring at 1200 rpm. In the secretion experiments, luciferin/luciferase (10 μL; Chrono-Log, JP) was added to 240 μL of washed platelet suspension within 2 minutes before stimulation. In the PS exposure inhibitory experiments, washed platelets were incubated with A01 (20 μΜ; Medchem Express, Monmouth Junction, NJ) before Hcy incubation at 37°C. Control groups were incubated with vehicle (dimethyl sulfoxide [DMSO], no greater than 0.1%) before the addition of the agonists. In the inhibition experiments, pyrrophenone (pyrro; 0.5 μM), HA130 (0.6 μM), or vehicle (DMSO; ≤0.1%) was added and left to incubate for 10 minutes. Platelet aggregation was monitored continuously over 5 to 10 minutes.
Lipidomics analysis
For platelet lipidomics analysis, washed platelets from C57BL/6J mice with acute HHcy or control mice in MTB (300 × 103/μL) were activated by collagen (1.5 μg/mL) for 10 minutes at 37°C. The platelet suspensions were centrifuged, and the platelets were collected and quantified by high-performance liquid chromatography-tandem mass spectrometry (HPLC-MS/MS) analysis, as described previously.20 In vitro, washed platelets from C57BL/6J mice in MTB (300 × 103/μL) were activated by collagen (1.5 μg/mL), without or with Hcy (100 μM), for 10 minutes at 37°C. The platelet suspensions were centrifuged, and the platelets were collected and quantified by HPLC-MS/MS analysis. All species were verified with lipid standards. Metabolite abundance was normalized to the number of platelets. Integrated peak areas corresponding to metabolite concentrations were determined with MetaboAnalyst software, version 3.0.21
Statistical analysis
All data are presented as the mean ± standard error of the mean (SEM), unless otherwise stated. Statistical analyses were performed with Prism version 7.0 (GraphPad Software, La Jolla, CA). The significance of the difference between 2 independent samples was determined with the unpaired Student t test. One-way analysis of variance with Tukey’s test was used to compare multiple groups. Correlational analyses were performed with Pearson’s correlation after the normal distribution of the data was determined. P < .05 indicated statistically significant results for all experiments.
See further descriptions of methods in supplemental Materials.
Results
Elevated plasma Hcy levels are associated with a prothrombotic state in both humans and ApoE−/− mice
Previously, study results showed that subjects with HHcy have a series of abnormalities, including a hypercoagulable state.13,22 In the present study, a report in which human medical examination records were used showed that elevated Hcy levels correlated negatively with APTT and PT (Figure 1A-B), suggesting a hypercoagulable state in HHcy blood and that subjects with HHcy were prone to intravascular thrombosis. Human plasma TXA2 (by measuring the stable TXA2 metabolite, TXB2) and sP-selectin levels, which serve as markers of platelet activation in the blood,23,24 correlated positively with Hcy concentrations (Figure 1C-D). The baseline characteristics are summarized in supplemental Table 1. The subjects did not have hypertension, diabetes, or liver or kidney dysfunction. There was no difference in the platelet count, mean platelet volume, platelet distribution width, or plateletcrit in these samples (supplemental Table 2). These findings suggest that humans with HHcy have increased susceptibility to platelet activation and thrombosis.
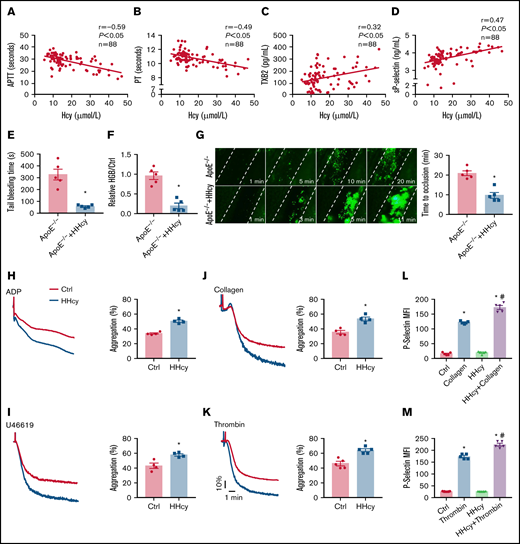
Elevated plasma Hcy levels are associated with a prothrombotic state in both humans and ApoE−/− mice. (A-B) Correlations between human plasma Hcy concentrations and the APTT or PT. (C-D) Human plasma TXB2 and sP-selectin levels were measured by enzyme-linked immunosorbent assay (n = 88; TXB2; Cloud-Clone Corp; sP-selectin; ABclonal Technology). (E-G) ApoE−/− mice were intraperitoneally injected with Hcy (100 mg/kg) or vehicle (saline), and, after 2 hours, tail-bleeding time was determined (E), and blood loss was assessed (F). HGB, hemoglobin. (G) Platelets were labeled with calcein-AM. Representative images of FeCl3-induced mesenteric arteriole thrombosis (left, original magnification, 200×; the dotted line indicates the arterial vessel wall). Occlusion time of the mesenteric arteriole (right). (H-K) Washed platelets harvested from C57BL/6J mice, with or without Hcy (100 mg/kg) injection for 2 hours were stimulated with ADP (0.01 g/mL) (H), U46619 (400 nM) (I), collagen (1.5 μg/mL) (J), and thrombin (0.01 U/mL) (K), at 37°C with constant stirring (1200 rpm). Then, platelet aggregation was monitored, using a turbidimetric aggregometer. Histograms of maximal platelet aggregation under the indicated conditions. (L-M) Flow cytometric analysis of P-selectin expression in platelets from control and HHcy C57BL/6J mice in the presence of collagen (1.5 μg/mL) (L) or thrombin (0.01 U/mL) (M). All data are expressed as the mean ± SEM (n = 5). *P < .05, compared with ctrl (control); #P < .05, compared with thrombin or collagen. MFI, mean fluorescence intensity.
Elevated plasma Hcy levels are associated with a prothrombotic state in both humans and ApoE−/− mice. (A-B) Correlations between human plasma Hcy concentrations and the APTT or PT. (C-D) Human plasma TXB2 and sP-selectin levels were measured by enzyme-linked immunosorbent assay (n = 88; TXB2; Cloud-Clone Corp; sP-selectin; ABclonal Technology). (E-G) ApoE−/− mice were intraperitoneally injected with Hcy (100 mg/kg) or vehicle (saline), and, after 2 hours, tail-bleeding time was determined (E), and blood loss was assessed (F). HGB, hemoglobin. (G) Platelets were labeled with calcein-AM. Representative images of FeCl3-induced mesenteric arteriole thrombosis (left, original magnification, 200×; the dotted line indicates the arterial vessel wall). Occlusion time of the mesenteric arteriole (right). (H-K) Washed platelets harvested from C57BL/6J mice, with or without Hcy (100 mg/kg) injection for 2 hours were stimulated with ADP (0.01 g/mL) (H), U46619 (400 nM) (I), collagen (1.5 μg/mL) (J), and thrombin (0.01 U/mL) (K), at 37°C with constant stirring (1200 rpm). Then, platelet aggregation was monitored, using a turbidimetric aggregometer. Histograms of maximal platelet aggregation under the indicated conditions. (L-M) Flow cytometric analysis of P-selectin expression in platelets from control and HHcy C57BL/6J mice in the presence of collagen (1.5 μg/mL) (L) or thrombin (0.01 U/mL) (M). All data are expressed as the mean ± SEM (n = 5). *P < .05, compared with ctrl (control); #P < .05, compared with thrombin or collagen. MFI, mean fluorescence intensity.
Previous reports have shown that HHcy-promoting thrombotic events require a first hit in vivo, such as dyslipidemia25,26 or hypertension.2 Therefore, the ApoE−/− mice with dyslipidemia were used. To explore the effects of HHcy on hemostasis and thrombosis, ApoE−/− mice were or were not intraperitoneally injected with Hcy (100 mg/kg).27 Plasma Hcy concentrations reached a peak at 2 hours after injection (supplemental Figure 1A). At the same time point, the tail-bleeding time of the mice with acute HHcy decreased (from 327.4 ± 46 to 58.4 ± 6.6 seconds; Fig. 1E), and relative blood loss (hemoglobin; HHcy vs control) was markedly reduced in the mice with acute HHcy (from 0.9 ± 0.1 to 0.2 ± 0.1; Fig. 1F). In a FeCl3-injured mesenteric arteriole thrombosis model, the occlusion time was significantly shortened by acute HHcy treatment of mice (from 20.8 ± 1.2 to 9.6 ± 1.5 minutes; Fig. 1G). The platelet count, mean platelet volume, platelet distribution width, and plateletcrit all showed no change (supplemental Table 3). Furthermore, we used a dietary approach and administered Hcy (1.8 g/L) in the drinking water of ApoE−/− mice for 3 weeks to induce a chronic HHcy model (supplemental Figure 1B). The tail-bleeding times of these chronic HHcy mice were shortened (from 262.2 ± 15.6 to 85.1 ± 6.5 seconds; supplemental Figure 1C), and the blood loss was markedly reduced (from 1.3 ± 0.2 to 0.4 ± 0.1; supplemental Figure 1D). Chronic HHcy decreased the artery occlusion time in these mice (from 17.6 ± 1.2 to 8.2 ± 0.6 minutes; supplemental Figure 1E). Thus, HHcy ApoE−/− mice, both in acute and chronic ones, exhibit earlier thrombosis.
Arterial thrombosis is associated with inappropriate platelet activation.28 Aggregation in response to classic agonists (ADP, U46619, collagen, and thrombin) was significantly increased in platelets harvested from C57BL/6J mice injected with acute Hcy for 2 hours (Figure 1H-K). Moreover, HHcy increased thrombin- and collagen-induced P-selectin expression in platelets (Figure 1L-M). These results indicate that thrombogenesis, at least in part, is related to activated platelets in mice with acute HHcy.
Hcy amplifies platelet aggregation and degranulation in vitro
Next, to investigate the direct effects of Hcy on platelet aggregation and activation induced by various classic agonists in vitro, we used washed platelets from C57BL/6J mice. Interestingly, pretreatment with Hcy (100 μM) potentiated platelet aggregation induced by classic agonists and especially potentiated the second wave of irreversible platelet aggregation (Figure 2A-D). Then, we tested platelet degranulation, as represented by ATP release and P-selectin expression. The results showed that Hcy obviously promoted thrombin- or collagen-induced ATP secretion (Figure 2E-F). On addition, Hcy markedly enhanced P-selectin expression and TXA2 synthesis in platelets treated with these agonists (Figure 2G-J). This result indicates that Hcy synergistically elevates classic agonist-induced stable platelet aggregation and granule secretion in mice.
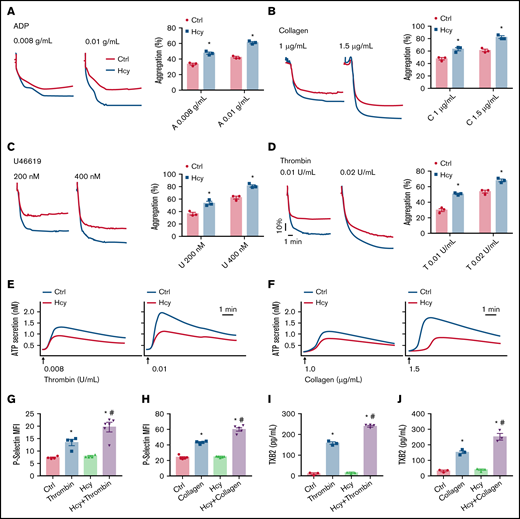
Hcy amplifies platelet aggregation and degranulation in vitro. Washed platelets harvested from C57BL/6J mice were incubated with or without Hcy (100 μM) for 10 minutes and then stimulated with the indicated concentrations of ADP (A), collagen (B), U46619 (C), and thrombin (D) at 37°C, with constant stirring (1200 rpm). Then, platelet aggregation was monitored with a turbidimetric aggregometer. (E-F) ATP secretion was measured in the presence of luciferin/luciferase reagent. The traces in the figures are representative of at least 3 independent experiments. (G-H) Flow cytometric analysis of P-selectin exposure in platelets with or without Hcy stimulation in the presence of thrombin (0.01 U/mL) (G) or collagen (1.5 μg/mL) (H). MFI, mean fluorescence intensity. (I-J) TXB2 production in control and Hcy-treated platelets stimulated with thrombin (0.01 U/mL) (I) or collagen (1.5 μg/mL) (J) was analyzed by enzyme-linked immunosorbent assay. All data are expressed as the mean ± SEM (n = 3-5). *P < .05 compared with ctrl; #P < .05 compared with thrombin or collagen.
Hcy amplifies platelet aggregation and degranulation in vitro. Washed platelets harvested from C57BL/6J mice were incubated with or without Hcy (100 μM) for 10 minutes and then stimulated with the indicated concentrations of ADP (A), collagen (B), U46619 (C), and thrombin (D) at 37°C, with constant stirring (1200 rpm). Then, platelet aggregation was monitored with a turbidimetric aggregometer. (E-F) ATP secretion was measured in the presence of luciferin/luciferase reagent. The traces in the figures are representative of at least 3 independent experiments. (G-H) Flow cytometric analysis of P-selectin exposure in platelets with or without Hcy stimulation in the presence of thrombin (0.01 U/mL) (G) or collagen (1.5 μg/mL) (H). MFI, mean fluorescence intensity. (I-J) TXB2 production in control and Hcy-treated platelets stimulated with thrombin (0.01 U/mL) (I) or collagen (1.5 μg/mL) (J) was analyzed by enzyme-linked immunosorbent assay. All data are expressed as the mean ± SEM (n = 3-5). *P < .05 compared with ctrl; #P < .05 compared with thrombin or collagen.
The high-affinity state of integrin αIIbβ3 mediates HHcy-induced platelet activation and thrombosis in mice
Platelet aggregation requires integrin αIIbβ3 activation, which is associated with an irreversible platelet plug. The JON/A antibody selectively bound to the high-affinity conformation of integrin αIIbβ3,29 which was increased by Hcy treatment in thrombin- or collagen-activated platelets purified from C57BL/6J mice (Figure 3A; supplemental Figure 2A). Fibrinogen binding also increased (Figure 3B; supplemental Figure 2B). Hcy treatment alone did not influence the binding of the JON/A antibody in the absence of agonist-activated platelets (data not shown). Integrin αIIbβ3 outside-in signaling mediates the second wave of platelet activation,30 platelet spreading on immobilized fibrinogen-coated wells,31 and clot retraction.32 In our study, Hcy significantly increased platelet spreading (Figure 3C), clot retraction (supplemental Figure 2C), and outside-in signaling, indicated by increased levels of p-AKTSer473 and p-SrcTyr416 (Figure 3D; supplemental Figure 2D). As Gα13 interacts with integrin αIIbβ3 and mediates integrin outside-in signaling,33 we found that Gα13 in thrombin-activated platelet lysates coimmunoprecipitated with the anti-β3 antibody in a time-dependent manner, and the precipitated amounts were even more pronounced during Hcy stimulation (Figure 3E). The integrin antagonist RGDS peptide abolished agonist-induced AKT and Src phosphorylation in Hcy-treated platelets (supplemental Figure 2E-F). Therefore, Hcy amplifies the second wave of irreversible murine platelet aggregation via integrin αIIbβ3 outside-in signaling.
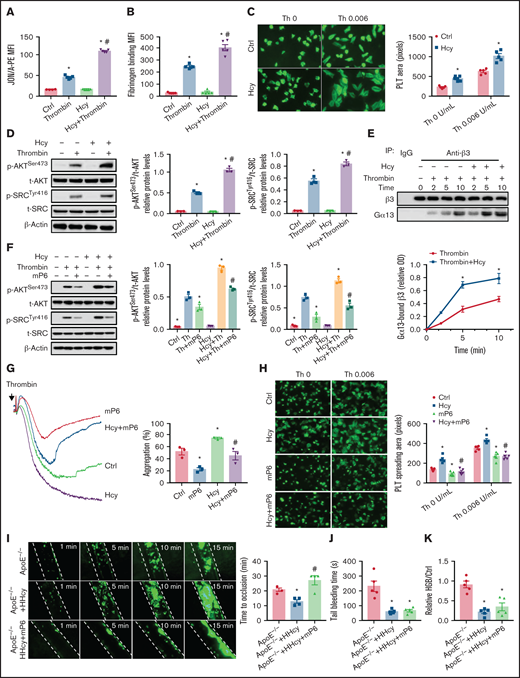
A high-affinity state of integrin αIIbβ3 mediates HHcy-induced platelet activation and thrombosis in mice. (A) Flow cytometric analysis of PE-JON/A binding to control and Hcy-incubated platelets from C57BL/6J mice stimulated with thrombin (0.01 U/mL). (B) Flow cytometric analysis of fluorescein isothiocyanate-labeled fibrinogen binding to control and Hcy-incubated platelets from C57BL/6J mice stimulated with thrombin (0.01 U/mL). MFI, mean fluorescence intensity. (C) Washed platelets from C57BL/6J mice were allowed to adhere and spread on fibrinogen-coated wells in the presence of 100 μM Hcy or vehicle, with or without thrombin (Th), at 37°C for 2 hours. Representative images (left, stained with phalloidin, original magnification, 400×); surface areas of single platelets (right). (D) Western blot analysis of p-AKTSer473 and p-SRCTyr416 protein expression and quantification. β-Actin was used as an internal control. (E) Washed platelets from C57BL/6J mice were solubilized at the indicated time points and the amount of β3 that coimmunoprecipitated with Gα13 was analyzed by western blot (n = 3-5). *P < .05 compared with ctrl; #P < .05 compared with thrombin. (F) p-AKTSer473 and p-SRCTyr416 protein levels in platelets with or without Hcy stimulation and treatment with 10 μM mP6 for 10 minutes with thrombin (0.01 U/mL) were analyzed by western blot (n = 3). *P < .05 compared with agonists; #P < .05 compared with HHcy+agonists. OD, optical density. (G) Platelet aggregation with 10 μM mP6 or control peptide in the presence/absence of Hcy was monitored with a turbidimetric aggregometer. (H) Washed platelets from C57BL/6J mice were allowed to adhere and spread on fibrinogen-coated wells with 100 μM Hcy in the presence of mP6 (20 μM). The spreading area of individual platelets (stainted with phalloidin, original magnification, 200×) was measured with ImageJ software (n = 3-5). *P < .05 compared with ctrl; #P < .05 compared with Hcy. (I-K) ApoE−/− mice were intraperitoneally injected with 100 mg/kg Hcy or vehicle (saline), and after 2 hours, the mice were treated with mP6 liposomes (10 μmol/kg) or vehicle (control peptide liposomes). (I) Platelets were labeled with calcein-AM. Representative images of FeCl3-induced mesenteric arteriole thrombosis (left, original magnification, 200×, the dotted line indicates the arterial vessel wall). Occlusion time of the mesenteric arteriole (right). Tail-bleeding time was determined (J), and blood loss was assessed (K). HGB, hemoglobin. All data are expressed as the mean ± SEM (n = 5). *P < .05 compared with ApoE−/−; #P < .05 compared with ApoE−/−+HHcy. PLT, platelets.
A high-affinity state of integrin αIIbβ3 mediates HHcy-induced platelet activation and thrombosis in mice. (A) Flow cytometric analysis of PE-JON/A binding to control and Hcy-incubated platelets from C57BL/6J mice stimulated with thrombin (0.01 U/mL). (B) Flow cytometric analysis of fluorescein isothiocyanate-labeled fibrinogen binding to control and Hcy-incubated platelets from C57BL/6J mice stimulated with thrombin (0.01 U/mL). MFI, mean fluorescence intensity. (C) Washed platelets from C57BL/6J mice were allowed to adhere and spread on fibrinogen-coated wells in the presence of 100 μM Hcy or vehicle, with or without thrombin (Th), at 37°C for 2 hours. Representative images (left, stained with phalloidin, original magnification, 400×); surface areas of single platelets (right). (D) Western blot analysis of p-AKTSer473 and p-SRCTyr416 protein expression and quantification. β-Actin was used as an internal control. (E) Washed platelets from C57BL/6J mice were solubilized at the indicated time points and the amount of β3 that coimmunoprecipitated with Gα13 was analyzed by western blot (n = 3-5). *P < .05 compared with ctrl; #P < .05 compared with thrombin. (F) p-AKTSer473 and p-SRCTyr416 protein levels in platelets with or without Hcy stimulation and treatment with 10 μM mP6 for 10 minutes with thrombin (0.01 U/mL) were analyzed by western blot (n = 3). *P < .05 compared with agonists; #P < .05 compared with HHcy+agonists. OD, optical density. (G) Platelet aggregation with 10 μM mP6 or control peptide in the presence/absence of Hcy was monitored with a turbidimetric aggregometer. (H) Washed platelets from C57BL/6J mice were allowed to adhere and spread on fibrinogen-coated wells with 100 μM Hcy in the presence of mP6 (20 μM). The spreading area of individual platelets (stainted with phalloidin, original magnification, 200×) was measured with ImageJ software (n = 3-5). *P < .05 compared with ctrl; #P < .05 compared with Hcy. (I-K) ApoE−/− mice were intraperitoneally injected with 100 mg/kg Hcy or vehicle (saline), and after 2 hours, the mice were treated with mP6 liposomes (10 μmol/kg) or vehicle (control peptide liposomes). (I) Platelets were labeled with calcein-AM. Representative images of FeCl3-induced mesenteric arteriole thrombosis (left, original magnification, 200×, the dotted line indicates the arterial vessel wall). Occlusion time of the mesenteric arteriole (right). Tail-bleeding time was determined (J), and blood loss was assessed (K). HGB, hemoglobin. All data are expressed as the mean ± SEM (n = 5). *P < .05 compared with ApoE−/−; #P < .05 compared with ApoE−/−+HHcy. PLT, platelets.
The peptide inhibitor of the Gα13-integrin interaction mP6 selectively targets platelet integrin αIIbβ3 outside-in signaling and is a new antithrombotic treatment that does not cause excessive bleeding.34 In platelets preincubated with mP6 (10 μM), the upregulated p-AKTSer473 and p-SrcTyr416, the second wave of thrombin- or collagen-induced platelet aggregation, and the platelet spreading in response to Hcy stimulation were all significantly abrogated in vitro (Figure 3F-H; supplemental Figure 2G-H). Furthermore, acute HHcy-induced arterial thrombus formation in ApoE−/− mice was inhibited by intravenous injection of mP6 liposomes (10 μmol/kg; Figure 3I), with no prolongation of tail-bleeding time or blood loss (Figure 3J-K). No occlusive platelet thrombus formed in 75% of the mP6-treated mice during a 30-minute observation period. These results indicate that integrin αIIbβ3 outside-in signaling is essential for HHcy-induced local platelet recruitment and activation during arterial thrombosis in vivo.
PS exposure mediates platelet integrin αIIbβ3 activation in response to HHcy stimulation
Integrin αIIbβ3 is maintained in a low-affinity state in resting platelets, and PS paradoxically stabilizes the αIIbβ3 transmembrane complex.17,18 To investigate whether HHcy induces platelet inner membrane PS exposure, PS labeled with an iFluor 555-annexin V antibody was intravenously injected into C57BL/6J mice, along with Hcy, to examine platelet PS exposure in vivo. The platelets in HHcy mice exhibited more PS exposure, with significantly increased mean fluorescence intensity (Figure 4A). The imaging flow cytometry data confirmed the increased fluorescence intensity of thrombin- or collagen-induced Hcy-stimulated platelets in vitro (Figure 4B-C).
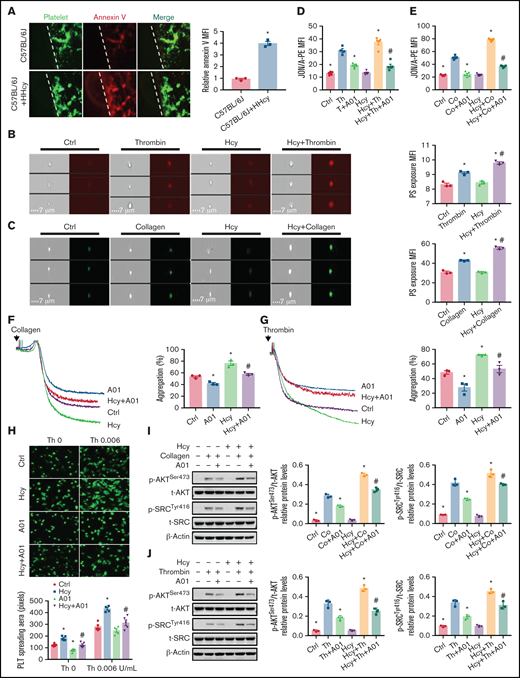
PS exposure mediates platelet integrin αIIbβ3 activation in response to Hcy stimulation. (A) Calcein-AM–labeled platelets and iFluor 555-annexin V antibodies were injected into C57BL/6J mice with or without Hcy (100 mg/kg) injection (left). Representative images of FeCl3-induced mesenteric arteriole thrombosis (green indicates platelets, red indicates annexin V right, the dotted line indicates the arterial vessel wall, original magnification, 400×). The relative quantitation for PS exposure (HHcy-MFI/control-MFI) in vivo. (B-C) Washed platelets from C57BL/6J mice were incubated with or without Hcy (100 μM) for 20 minutes and then stimulated with thrombin (0.01 U/mL) or collagen (1.5 μg/mL) at 37°C for 30 minutes. Representative immunofluorescence staining (left) and quantitation (right) of PS exposure were analyzed by image-capture flow cytometry. All data are expressed as the mean ± SEM (n = 3). *P < .05 compared with ctrl; #P < .05 compared with thrombin or collagen. (D-E) JON/A binding after 20 μM A01 or vehicle (DMSO, no greater than 0.1%) treatment of 10 minutes, followed by stimulation with (D) thrombin (Th, 0.01 U/mL) or collagen (Co, 1.5 μg/mL) (E) in the presence/absence of Hcy (100 μM) was assessed by flow cytometry. All data are expressed as the mean ± SEM (n = 5). *P < .05 compared with agonists; #P < .05 compared with Hcy+agonists. (F-G) Platelets from C57BL/6J mice were aggregated after stimulation with 20 μM A01 or vehicle, followed by collagen (1.5 μg/mL) (F) or thrombin (0.01 U/mL) (G) stimulation in the presence/absence of Hcy on a turbidimetric aggregometer. (H) Washed platelets from C57BL/6J mice were allowed to adhere and spread on fibrinogen-coated wells in the presence of 100 μM Hcy or vehicle with A01 (20 μM). The spreading area of individual platelets (stainted with phalloidin, original magnification, 200×) was measured using ImageJ software. All data are expressed as the mean ± SEM (n = 5). *P < .05 compared with ctrl; #P < .05 compared with Hcy. (I-J) p-AKTSer473 and p-SRCTyr416 protein levels in platelets, with or without Hcy, were analyzed after treatment with 20 μM A01 for 10 minutes with collagen (1.5 μg/mL) (I) or thrombin (0.01 U/mL) (J) by western blot analysis. All data are expressed as the mean ± SEM (n = 3-5). *P < .05 compared with agonists; #P < .05 compared with Hcy+agonists. MFI, mean fluorescence intensity.
PS exposure mediates platelet integrin αIIbβ3 activation in response to Hcy stimulation. (A) Calcein-AM–labeled platelets and iFluor 555-annexin V antibodies were injected into C57BL/6J mice with or without Hcy (100 mg/kg) injection (left). Representative images of FeCl3-induced mesenteric arteriole thrombosis (green indicates platelets, red indicates annexin V right, the dotted line indicates the arterial vessel wall, original magnification, 400×). The relative quantitation for PS exposure (HHcy-MFI/control-MFI) in vivo. (B-C) Washed platelets from C57BL/6J mice were incubated with or without Hcy (100 μM) for 20 minutes and then stimulated with thrombin (0.01 U/mL) or collagen (1.5 μg/mL) at 37°C for 30 minutes. Representative immunofluorescence staining (left) and quantitation (right) of PS exposure were analyzed by image-capture flow cytometry. All data are expressed as the mean ± SEM (n = 3). *P < .05 compared with ctrl; #P < .05 compared with thrombin or collagen. (D-E) JON/A binding after 20 μM A01 or vehicle (DMSO, no greater than 0.1%) treatment of 10 minutes, followed by stimulation with (D) thrombin (Th, 0.01 U/mL) or collagen (Co, 1.5 μg/mL) (E) in the presence/absence of Hcy (100 μM) was assessed by flow cytometry. All data are expressed as the mean ± SEM (n = 5). *P < .05 compared with agonists; #P < .05 compared with Hcy+agonists. (F-G) Platelets from C57BL/6J mice were aggregated after stimulation with 20 μM A01 or vehicle, followed by collagen (1.5 μg/mL) (F) or thrombin (0.01 U/mL) (G) stimulation in the presence/absence of Hcy on a turbidimetric aggregometer. (H) Washed platelets from C57BL/6J mice were allowed to adhere and spread on fibrinogen-coated wells in the presence of 100 μM Hcy or vehicle with A01 (20 μM). The spreading area of individual platelets (stainted with phalloidin, original magnification, 200×) was measured using ImageJ software. All data are expressed as the mean ± SEM (n = 5). *P < .05 compared with ctrl; #P < .05 compared with Hcy. (I-J) p-AKTSer473 and p-SRCTyr416 protein levels in platelets, with or without Hcy, were analyzed after treatment with 20 μM A01 for 10 minutes with collagen (1.5 μg/mL) (I) or thrombin (0.01 U/mL) (J) by western blot analysis. All data are expressed as the mean ± SEM (n = 3-5). *P < .05 compared with agonists; #P < .05 compared with Hcy+agonists. MFI, mean fluorescence intensity.
PS externalization requires TMEM16F, a scramblase that scrambles phospholipids at the plasma membrane.35,36 The TMEM16F-specific inhibitor CaCCinh A01 (20 μM)37 significantly inhibited Hcy-activated platelet PS exposure (supplemental Figure 3) and JON/A binding (Figure 4D-E), as well as irreversible platelet aggregation under thrombin or collagen stimulation in vitro (Figure 4F-G). Furthermore, the increased spreading and p-AKTSer473 and p-SrcTyr416 levels of Hcy-stimulated platelets were also blocked by A01 (Figure 4H-J). Thus, Hcy promotes platelet membrane PS exposure, leading to high-affinity integrin αIIbβ3 activation and irreversible platelet aggregation.
HHcy activates phospholipid hydrolysis of platelet membrane and ATX secretion
PS exposure mediates membrane lipid redistribution and lipid scrambling effects, to reduce the lipid concentration in the intracellular membrane leaflet, and thus influences conformational changes of integrin.38 In this study, we quantitatively measured lipid metabolites in the platelets of C57BL/6J mice with acute HHcy by HPLC-MS/MS. The partial least-squares discriminant analysis of the lipidomics data from collagen-activated platelets isolated from mice with acute HHcy showed lipid metabolic clustering distinct from that in control mice (Figure 5A). An analysis of the variable importance in projection (VIP) score showed that the primary metabolites leading to clustering were LPCs (Figure 5B). A heat map of phospholipids revealed increased LPC levels in HHcy-stimulated platelets (Figure 5C). The levels of 16:0 LPC, 18:0 LPC, 18:1 LPC, and 24:0 LPC were all elevated in HHcy+collagen–stimulated platelets (Figure 5D). LPC generation depends on cPLA2 to hydrolyze the sn-2 position of PC in the platelet plasma membrane.14 As expected, cPLA2 activity was elevated in platelets from C57BL/6J mice with acute HHcy (Figure 5E). In parallel, lipidomics analysis of platelets harvested from C57BL/6J mice directly treated with Hcy in vitro was also performed. The levels of 16:0 LPC, 18:0 LPC, 18:1 LPC, and 24:0 LPC were all significantly elevated by Hcy+collagen stimulation (supplemental Figure 4A-B). In addition, cPLA2 activity was elevated in Hcy-treated platelets (supplemental Figure 4C). These results suggest that Hcy promotes platelet membrane phospholipid PC-LPC hydrolysis via cPLA2 activation both in vivo and in vitro.
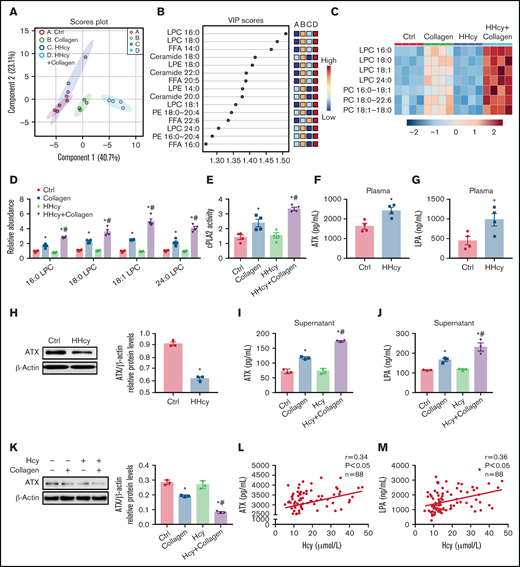
HHcy activates phospholipid hydrolysis of platelet membrane and ATX secretion. (A-E) HPLC-MS/MS analysis of lipid metabolites in platelets from C57BL/6J mice that were intraperitoneally injected with 100 mg/kg Hcy or vehicle (saline) for 2 hours. (A) Principal component analysis (PCA) scatterplot of lipid metabolites in platelets. (B) VIP scatterplot identified by PCA showing the top 15 lipid metabolites in the different groups. (C) Heat map illustrating the phospholipid metabolic profiles in platelets. (D) HPLC-MS/MS analysis of different levels of LPC species in platelets. (E) cPLA2 activity of platelets from acute HHcy and control mice in vivo. (F-H) C57BL/6J mice were intraperitoneally injected with 100 mg/kg Hcy or vehicle (saline) for 2 hours. Plasma ATX (F) and LPA (G) levels were measured via enzyme-linked immunosorbent assay (ELISA; Cloud-Clone Corp). (H) Western blot analysis of ATX expression in platelets. β-Actin was used as an internal control. (I-K) Washed platelets from C57BL/6J were incubated with 100 μM Hcy for 10 minutes, then stimulated with 1.5 μg/mL collagen. The levels of ATX (I) and LPA (J) in platelet-activated supernatant were measured by ELISA. ATX protein expression (K) in platelets was analyzed by western blot, with β-actin used as the internal control. All data are expressed as the mean ± SEM (n = 3-4). *P < .05 compared with ctrl; #P < .05 compared with collagen. (L-M) Correlations between human plasma Hcy concentrations and the levels of ATX (L) and LPA (M) were measured by ELISA (n = 88).
HHcy activates phospholipid hydrolysis of platelet membrane and ATX secretion. (A-E) HPLC-MS/MS analysis of lipid metabolites in platelets from C57BL/6J mice that were intraperitoneally injected with 100 mg/kg Hcy or vehicle (saline) for 2 hours. (A) Principal component analysis (PCA) scatterplot of lipid metabolites in platelets. (B) VIP scatterplot identified by PCA showing the top 15 lipid metabolites in the different groups. (C) Heat map illustrating the phospholipid metabolic profiles in platelets. (D) HPLC-MS/MS analysis of different levels of LPC species in platelets. (E) cPLA2 activity of platelets from acute HHcy and control mice in vivo. (F-H) C57BL/6J mice were intraperitoneally injected with 100 mg/kg Hcy or vehicle (saline) for 2 hours. Plasma ATX (F) and LPA (G) levels were measured via enzyme-linked immunosorbent assay (ELISA; Cloud-Clone Corp). (H) Western blot analysis of ATX expression in platelets. β-Actin was used as an internal control. (I-K) Washed platelets from C57BL/6J were incubated with 100 μM Hcy for 10 minutes, then stimulated with 1.5 μg/mL collagen. The levels of ATX (I) and LPA (J) in platelet-activated supernatant were measured by ELISA. ATX protein expression (K) in platelets was analyzed by western blot, with β-actin used as the internal control. All data are expressed as the mean ± SEM (n = 3-4). *P < .05 compared with ctrl; #P < .05 compared with collagen. (L-M) Correlations between human plasma Hcy concentrations and the levels of ATX (L) and LPA (M) were measured by ELISA (n = 88).
ATX is a secreted lysoPLD that converts LPC into the bioactive lipid mediator LPA, and a lack of it results in impaired activation of the platelet integrin αIIbβ3.15,16,39 Plasma ATX levels were upregulated in C57BL/6J mice with acute HHcy, together with increased plasma LPA levels in vivo (Figure 5F-G). However, platelet ATX protein expression decreased in C57BL/6J mice with acute HHcy (Figure 5H). Similarly, ATX and LPA levels were increased in the supernatants of Hcy-stimulated platelets treated with agonists (Figure 5I-J; supplemental Figure 4D-E). In the meantime, the ATX protein level was decreased in agonist-activated platelets with Hcy treatment (Figure 5K; supplemental Figure 4F), suggesting faster ATX secretion than synthesis in this context. Importantly, human plasma ATX and LPA levels correlated positively with elevated Hcy concentrations (Figure 5L-M). These results suggest that Hcy upregulates plasma levels of ATX protein both in humans and mice, which is, at least in part, secreted from platelets. In addition, the cPLA2 inhibitor pyrro (0.5 μM) or the ATX inhibitor HA130 (0.6 μM) significantly inhibited Hcy-activated platelet PS exposure (supplemental Figure 4G-H), suggesting that membrane lipid PC-LPC hydrolysis promotes Hcy-induced platelet PS exposure.
Secreted ATX interacts with integrin β3 and mediates Hcy-induced platelet integrin αIIbβ3 activation
To determine the potential role of platelet membrane PC-LPC hydrolysis and ATX secretion in facilitating integrin αIIbβ3 hyperactivation in the context of HHcy, pyrro, and HA130 were used respectively, and integrin αIIbβ3 activation was assessed in activated platelets purified from C57BL/6J mice. Pyrro (0.5 μM) decreased ATX levels in the supernatants of Hcy-stimulated platelets treated with agonists (Figure 6A-B). The second wave of thrombin- or collagen-induced platelet aggregation, spreading, and upregulated p-AKTSer473 and p-SrcTyr416 levels induced by Hcy stimulation were all significantly inhibited by pyrro pretreatment (supplemental Figure 5A-E). As expected, HA130 (0.6 μM) significantly inhibited Hcy-induced irreversible platelet aggregation and spreading and increases in p-AKTSer473 and p-SrcTyr416 under thrombin or collagen stimulation (Figure 6C-G). A coimmunoprecipitation assay demonstrated that ATX directly bound to integrin β3 and that the binding of ATX to integrin β3 was upregulated during Hcy stimulation (Figure 6H). Importantly, ATX (10-50 nM) dose dependently upregulated the phosphorylation of AKTSer473 and SrcTyr416 (Figure 6I) and platelet aggregation (supplemental Figure 5F). These results indicate that ATX induced by cPLA2 activation promotes integrin αIIbβ3 activation by binding to integrin β3, which in turn activates the downstream AKT/Src signaling pathway in Hcy-activated platelets.
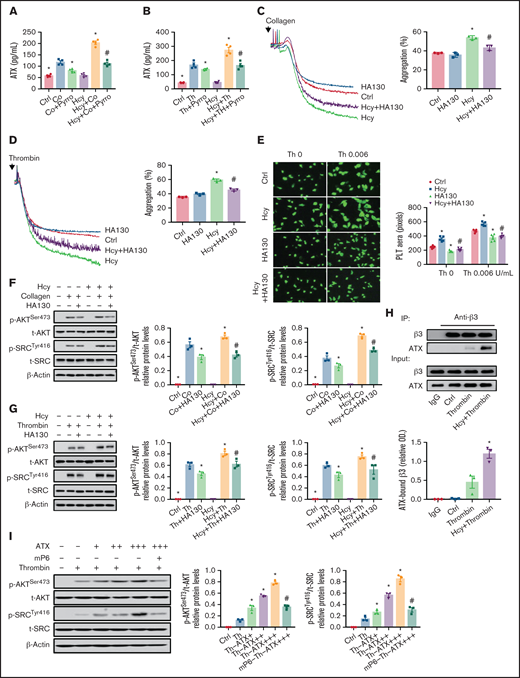
Secreted ATX interacts with integrin β3 and mediates Hcy-induced platelet integrin αIIbβ3 activation. Washed platelets were purified from C57BL/6J mice. (A-B) Supernatant ATX levels were measured by enzyme-linked immunosorbent assay (ELISA). All data are expressed as the mean ± SEM (n = 4). *P < .05 compared with agonists; #P < .05 compared with Hcy+agonists. (C-D) Platelet aggregation after HA130 (0.6 μM) stimulation with collagen (1.5 μg/mL) (C) or thrombin (0.01 U/mL) (D) in the presence/absence of Hcy (100 μM) was monitored with a turbidimetric aggregometer. (E) Washed platelets from C57BL/6J mice were left to adhere and spread on fibrinogen-coated wells with 100 μM Hcy or vehicle in the presence of HA130 (0.6 μM). The spreading area of individual platelets (stainted with phalloidin, original magnification, 200×) was measured with ImageJ software. All data are expressed as the mean ± SEM (n = 3-5). *P < .05 compared with ctrl; #P < .05 compared with Hcy. (F-G) p-AKTSer473 and p-SRCTyr416 protein levels in platelets with or without Hcy incubation were analyzed after treatment with 0.6 μM HA130 for 10 minutes with collagen (1.5 μg/mL) (F) or thrombin (0.01 U/mL) (G) by western blot analysis. All data are expressed as the mean ± SEM (n = 3). *P < .05 compared with agonists; #P < .05 compared with Hcy+agonists. (H) Coimmunoprecipitation of ATX with integrin β3 in platelets from C57BL/6J mice. (I) p-AKTSer473 and p-SRCTyr416 protein levels in platelets from C57BL/6J mice incubated with ATX (+, 10 nM; ++, 20 nM; +++, 50 nM) were analyzed by western blot after incubation with mP6 (20 μM) for 10 minutes. All data are expressed as the mean ± SEM (n = 3). *P < .05 compared with agonists; #P < .05 compared with Hcy+agonists or Th-ATX+++.
Secreted ATX interacts with integrin β3 and mediates Hcy-induced platelet integrin αIIbβ3 activation. Washed platelets were purified from C57BL/6J mice. (A-B) Supernatant ATX levels were measured by enzyme-linked immunosorbent assay (ELISA). All data are expressed as the mean ± SEM (n = 4). *P < .05 compared with agonists; #P < .05 compared with Hcy+agonists. (C-D) Platelet aggregation after HA130 (0.6 μM) stimulation with collagen (1.5 μg/mL) (C) or thrombin (0.01 U/mL) (D) in the presence/absence of Hcy (100 μM) was monitored with a turbidimetric aggregometer. (E) Washed platelets from C57BL/6J mice were left to adhere and spread on fibrinogen-coated wells with 100 μM Hcy or vehicle in the presence of HA130 (0.6 μM). The spreading area of individual platelets (stainted with phalloidin, original magnification, 200×) was measured with ImageJ software. All data are expressed as the mean ± SEM (n = 3-5). *P < .05 compared with ctrl; #P < .05 compared with Hcy. (F-G) p-AKTSer473 and p-SRCTyr416 protein levels in platelets with or without Hcy incubation were analyzed after treatment with 0.6 μM HA130 for 10 minutes with collagen (1.5 μg/mL) (F) or thrombin (0.01 U/mL) (G) by western blot analysis. All data are expressed as the mean ± SEM (n = 3). *P < .05 compared with agonists; #P < .05 compared with Hcy+agonists. (H) Coimmunoprecipitation of ATX with integrin β3 in platelets from C57BL/6J mice. (I) p-AKTSer473 and p-SRCTyr416 protein levels in platelets from C57BL/6J mice incubated with ATX (+, 10 nM; ++, 20 nM; +++, 50 nM) were analyzed by western blot after incubation with mP6 (20 μM) for 10 minutes. All data are expressed as the mean ± SEM (n = 3). *P < .05 compared with agonists; #P < .05 compared with Hcy+agonists or Th-ATX+++.
Pyrro and HA130 alleviate arterial platelet thrombus formation in HHcy ApoE−/− mice
To further characterize the effects of cPLA2 and ATX on in vivo thrombosis, we used pyrro or HA130 in a FeCl3-injured mesenteric arteriole thrombosis model in ApoE−/− mice with acute HHcy. The results showed that the increased plasma ATX levels in the mice were blocked by pyrro treatment (5 μmol/kg; Figure 7A). HHcy-decreased tail-bleeding time and blood loss were significantly reversed by pyrro (Figure 7B-C). The HHcy-mediated reduction in the duration of occlusion and increase in the formation of thrombi were also rescued by pyrro (Figure 7D). HA130 injection (2 μmol/kg) blocked the HHcy-decreased tail-bleeding time and blood loss (Figure 7E-F) and the HHcy-increased arterial thrombogenesis in vivo (Figure 7G). These results demonstrate an important role of membrane PC-LPC hydrolysis and ATX secretion in platelet thrombosis formation, which can be reversed by cPLA2 or ATX inhibitors in HHcy ApoE−/− mice.
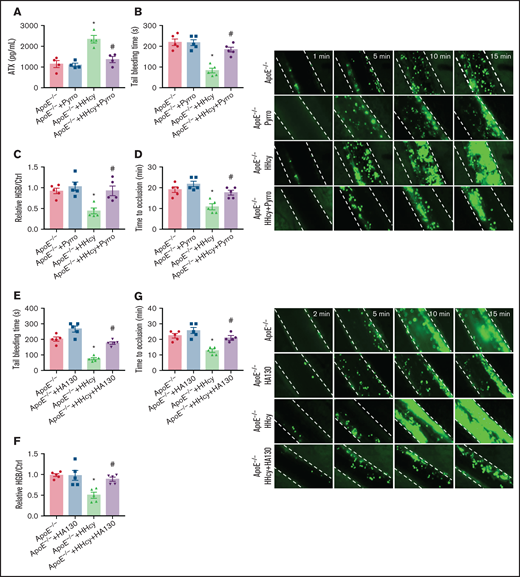
Pyrro and HA130 alleviate arterial platelet thrombus formation in HHcy ApoE−/− mice. (A-D) ApoE−/− mice were intraperitoneally injected with 100 mg/kg Hcy or vehicle (saline), and after 2 hours, the mice were treated with pyrro (5 μmol/kg) or vehicle (DMSO; ≤1:3000/body weight). (A) ATX level in plasma were measured by ELISA. (B) Tail-bleeding time was determined. (C) Blood loss was assessed. HGB, hemoglobin. (D) Platelets were labeled with calcein-AM. Occlusion time of the mesenteric arteriole (left); representative images of FeCl3-induced mesenteric arteriole thrombosis (right, the dotted line indicates the arterial vessel wall, original magnification, 200×). (E-G) ApoE−/− mice were intraperitoneally injected with 100 mg/kg Hcy or vehicle (saline), and after 2 hours, the mice were treated with HA130 (2 μmol/kg) or vehicle (DMSO). Tail-bleeding time was determined (E) and blood loss was assessed (F). (G) Platelets were labeled with calcein-AM. Occlusion time of the mesenteric arteriole (left) and representative images of FeCl3-induced mesenteric arteriole thrombosis (right, the dotted line indicates the arterial vessel wall, original magnification, 200×). All data are expressed as the mean ± SEM (n = 5). *P < .05 compared with ApoE−/−; #P < .05 compared with ApoE−/−+HHcy.
Pyrro and HA130 alleviate arterial platelet thrombus formation in HHcy ApoE−/− mice. (A-D) ApoE−/− mice were intraperitoneally injected with 100 mg/kg Hcy or vehicle (saline), and after 2 hours, the mice were treated with pyrro (5 μmol/kg) or vehicle (DMSO; ≤1:3000/body weight). (A) ATX level in plasma were measured by ELISA. (B) Tail-bleeding time was determined. (C) Blood loss was assessed. HGB, hemoglobin. (D) Platelets were labeled with calcein-AM. Occlusion time of the mesenteric arteriole (left); representative images of FeCl3-induced mesenteric arteriole thrombosis (right, the dotted line indicates the arterial vessel wall, original magnification, 200×). (E-G) ApoE−/− mice were intraperitoneally injected with 100 mg/kg Hcy or vehicle (saline), and after 2 hours, the mice were treated with HA130 (2 μmol/kg) or vehicle (DMSO). Tail-bleeding time was determined (E) and blood loss was assessed (F). (G) Platelets were labeled with calcein-AM. Occlusion time of the mesenteric arteriole (left) and representative images of FeCl3-induced mesenteric arteriole thrombosis (right, the dotted line indicates the arterial vessel wall, original magnification, 200×). All data are expressed as the mean ± SEM (n = 5). *P < .05 compared with ApoE−/−; #P < .05 compared with ApoE−/−+HHcy.
Discussion
HHcy is associated with exaggerated platelet function and arterial thrombosis.6,7,13 In this study, HHcy platelets were more reactive than control platelets. First, the high-affinity integrin αIIbβ3 signaling–dependent second wave of irreversible aggregation was enhanced in HHcy-treated platelets. Second, HHcy increased plasma membrane PC-LPC hydrolysis via cPLA2 activation and ATX secretion by platelets, and then ATX binding to β3 promoted the activation of integrin αIIbβ3 outside-in signaling. Third, and most important, cPLA2 and ATX inhibitors may be novel potential antithrombotic therapeutic agents for HHcy-related thrombotic diseases.
Platelet membrane lipid redistribution leads to PS exposure on the outer leaflet of the plasma membrane, and then the platelet enters a procoagulant state.40 To further explore the potential mechanisms, lipid metabolites of platelets were analyzed by HPLC-MS/MS. A heat map showed that HHcy promoted collagen-activated platelet membrane phospholipid hydrolysis, along with increased levels of metabolites, including 16:0 LPC, 18:0 LPC, 18:1 LPC, and 24:0 LPC, all of which supported platelet membrane lipid scrambling (Figure 5C; supplemental Figure 4B). In addition, HHcy increased the cPLA2 activation and ATX secretion, leading to platelet membrane phospholipid PC-LPC hydrolysis (Figure 5). Furthermore, pyrro and HA130 significantly inhibited Hcy-activated platelet PS exposure (supplemental Figure 4D-E), suggesting that membrane lipid PC-LPC hydrolysis promotes Hcy-induced platelet PS exposure. Therefore, blocking membrane phospholipid hydrolysis with either cPLA2 or ATX inhibitors significantly suppressed platelet integrin αIIbβ3 activation and alleviated arterial platelet thrombus formation in HHcy mice (Figures 6 and 7). These results indicate that HHcy-promoted phospholipid catabolism may change the stability of transmembrane proteins, leading to the activation of integrin αIIbβ3 outside-in signaling.17,18 In accordance with our previous report, the levels of membrane phospholipid metabolites, including LPC, were markedly increased by Hcy-induced metabolic stress in T cells, B cells, and adipocytes.19,20,41 These products may provide bioactive mediators to amplify platelet activation and aggregation.28,42
In addition to its role as a hydrolase during platelet activation,43 ATX may also act as a secreted protein. We found a significant increase in ATX secretion in Hcy-stimulated platelets in vitro and in the mouse and human plasma with HHcy in vivo. ATX may regulate platelet function through autocrine or paracrine mechanisms, amplifying second-wave platelet activation by interacting with integrin αIIbβ3.44 The lack of ATX decreases this activation, particularly under high-shear conditions, suggesting a role of secreted ATX in platelet activation signaling events that lead to integrin αIIbβ3 activation.16 In this study, secreted ATX promoted integrin αIIbβ3 activation by directly binding to integrin β3 (Figure 6H), subsequently synergistically activating the integrin αIIbβ3 outside-in signaling pathway in the context of Hcy stimulation (Figure 6I; supplemental Figure 5F). These findings suggest a distinct HHcy prothrombotic mechanism linked to dysregulated integrin αIIbβ3 activation, which could explain why there is resistance to conventional antiplatelet agents in some HHcy subjects.
We further demonstrated that A01, a specific inhibitor of PS exposure,32 decreased integrin αIIbβ3 activation and outside-in signaling. This finding suggests that PS exposure is responsible for the high-affinity state of integrin αIIbβ3, which subsequently leads to the hyperactivity of HHcy platelets. Anionic lipids, such as PS, stabilize the platelet integrin αIIbβ3 transmembrane complex.18 Recently, Pang et al45 reported that αIIbβ3 integrins serve as shear sensors that activate the Gα13-dependent outside-in signaling pathway to facilitate platelet PS exposure. Therefore, given our findings, PS exposure and integrin αIIbβ3 outside-in signaling combine with each other to facilitate platelet activation and procoagulant functions during vascular injury. Notably, integrin αIIbβ3 in activated platelets plays an important role in blood coagulation because of the exposure of procoagulant PS on the outer plasma membrane and releasing PS-expressed microvesicles, which enables the binding of important coagulation factors, subsequently directly enhances the catalytic efficiencies of coagulation enzymes.46 However, under static conditions in vitro, platelet agonists are inefficient in inducing PS exposure.40,45 We found that Hcy significantly induced activated mouse platelet PS exposure in vitro and in vivo (Figure 4A-C), and the blood of HHcy subjects was in a hypercoagulable state indicated by reduced APTT and PT (Figure 1A-B). The increased PS exposure induced by HHcy not only promoted integrin αIIbβ3 outside-in signaling activation but also contributed to intravascular coagulation. A major early consequence of integrin outside-in signaling is platelet spreading, which requires activation of the protein kinase Src. Subsequent cleavage of the Src binding site in β3 by calpain allows for the activation of RhoA, leading to irreversible platelet aggregation and stable thrombi.47 Hcy obviously increased platelet spreading, clot retraction, and the phosphorylation of SrcTyr416, which contributes to the formation of irreversible platelet plugs and serious thrombotic events in HHcy-related thrombotic diseases.
Previous studies on Hcy-induced platelet activation provided evidence of platelet overactivation after classic receptor stimulation.6,11 Our present study suggests that Hcy promotes the Gα13-β3 interaction, which mediates platelet activation, resulting in the formation of irreversible platelet plugs. These studies indicate that the platelets obtained from HHcy mice are far more reactive than platelets from non-HHcy mice and that Hcy-stimulated platelets exhibit hyperactivity and hyperaggregability in response to classic agonists. Dayal et al48 previously reported that HHcy promoted thrombosis without platelet overactivation with thrombin and convulxin; the dose of thrombin was 0.5 U/mL. The agonist concentration may be so high that the agonist itself may cause platelet overactivation. Importantly, we found that HHcy promoted hemostasis and thrombosis in ApoE−/− mice but not in C57BL/6J mice (data not shown). The finding was consistent with those in another study that showed that elevated plasma Hcy is not sufficient to induce a prothrombotic phenotype in C57BL/6J mice with genetic modifications.49 These results indicate that HHcy-promoting platelet-thrombosis in vivo requires a first hit, such as dyslipidemia.26 It has been suggested that oxidized low-density lipoprotein (ox-LDL) has direct prothrombotic effects by functionally interacting with platelets via CD36 or LOX1 receptors to activate specific intracellular signaling pathways that ultimately lead to platelet activation,50 which is based on ox-LDL accumulation in ApoE−/− mice. Recently, we reported that HHcy increases the secretion of anti-ox-LDL, anti-phospholipid, and anti-β2GPI IgG by B cells.20 Anti-β2GPI IgG may also partially promote platelet aggregation and intravascular coagulation in vivo.51
Patients with HHcy with coronary artery diseases require increased doses of aspirin to prevent cardiovascular events.12 However, the increase means an higher risk of accidental bleeding. The present study showed that phospholipid hydrolysis and ATX secretion mediates platelet integrin αIIbβ3 outside-in signaling activation in HHcy, and blocking ATX activation via HA130 significantly attenuated HHcy-induced integrin αIIbβ3 activation and arterial thrombosis. The cPLA2 inhibitor also blocked the conversion of membrane phospholipid PC to LPC, decreasing ATX secretion in vitro and in vivo (Figure 6A and 7A). Recently, we reported that HHcy exerts its proinflammatory effects in blood vessels by affecting endothelial phospholipid metabolism through phospholipid catabolism and the secretion of regulatory proteins, such as ATX.52 Thus, selective targeting of integrin outside-in signaling may be a new antithrombotic strategy in HHcy-related thrombotic diseases, and aspirin, combined with an ATX inhibitor, may be effective and safe in reducing vascular inflammation and preventing cardiovascular events in patients with HHcy. Further investigation is needed.
In summary, this study provides novel insights into HHcy-mediated platelet activation, which promotes the development of arterial thrombosis. In this process, HHcy increases platelet integrin αIIbβ3 affinity and enhances integrin outside-in signaling via membrane phospholipid hydrolysis and interaction with secreted ATX. Given the effectiveness of cPLA2 and ATX inhibitors in preventing platelet activation and thrombus formation, therapeutic targeting of the high-affinity integrin αIIbβ3 signaling pathway may represent an innovative approach to treating HHcy-related prothrombotic diseases.
Acknowledgments
We are grateful to Junjie Zhang (College of Life Sciences, Beijing Normal University, China) and Jianfeng Chen (University of Chinese Academy of Sciences, Shanghai, China) for their advice.
This study was funded by National Natural Science Foundation of China (grants 82070462, 31872787, 81921001, 91939105, and 81770445) and the Natural Science Foundation of Beijing, China (grant M21008).
Authorship
Contribution: L.H., Y.M., X.Z., X.M., and X.D. designed and performed experiments and analyzed and interpreted the data; Y.Z. contributed to human sample collection and analysis; X.W., J.F., K.D., J.L., W.K., and Q.X. designed and supervised the research; L.H., J.F., and X.W. wrote the manuscript; and all authors approved the final manuscript.
Conflict-of-interest disclosure: The authors declare no competing financial interests.
Correspondence: Xian Wang, Department of Physiology and Pathophysiology, School of Basic Medical Sciences, Peking University, Beijing 100191, People’s Republic of China; e-mail: xwang@bjmu.edu.cn; Juan Feng, Department of Physiology and Pathophysiology, School of Basic Medical Sciences, Peking University, Beijing 100191, People’s Republic of China; e-mail: juanfeng@bjmu.edu.cn; and Kesheng Dai, Jiangsu Institute of Hematology, The First Affiliated Hospital and Collaborative Innovation Center of Hematology, Soochow University, Key Laboratory of Thrombosis and Hemostasis, Ministry of Health, Suzhou 215006, People’s Republic of China; e-mail: kdai@suda.edu.cn.

