

Key Points
BLEAT facilitates the selection of stem cell sources for single HLA-B mismatches.
BLEAT assessment shows 99.99% of more than 2 million HLA-B leader-type alleles have the same leader type as their HLA-B allele family.

Abstract
Sequence variation in the HLA-B gene is critically linked to differential immune responses. A dimorphism at -21 of HLA-B exon 1 gives rise to leader peptides that are markers for risk of acute graft-versus-host disease, relapse, and mortality after unrelated donor and cord blood transplantation. To optimize the selection of stem cell transplant sources based on the HLA-B leader, an HLA-BLeader Assessment Tool (BLEAT) was developed to automate the assignment of leader genotypes, define HLA-B leader match statuses, and rank order candidate stem cell sources according to clinical risk. The base cohort consisted of 9 417 614 registered donors from the Be The Match Registry with HLA-B typing. Among these donors, the performance of BLEAT was assessed in 1 098 358 donors with sequence data for HLA-B exon 1 (2 196 716 haplotypes). The accuracy of leader assignment was then assessed in a second cohort of 1259 patients and their unrelated transplant donors. We furthermore established the frequencies of HLA-B leader genotype (MM, MT, TT) representations in broad racial categories in the 9.42 million donors. BLEAT has direct applications for the selection of optimal stem cell sources for transplantation and broad utility in basic and clinical research in pharmacogenomics, vaccine development, and cancer and infectious disease studies of human populations.
Introduction
HLA-B is the most polymorphic locus in the human genome with >7561 unique alleles recognized currently.1 The HLA-B protein plays an essential role in T-cell and natural killer (NK) cell immunity.2 Antigen presentation of HLA-B to T cells is the basis for host defense against infectious agents and graft acceptance in transplantation.3 Its multidimensional role in both adaptive and innate immunity is the foundation for HLA-B associations with many human diseases and responses to pharmacologic agents.4-9
HLA class I genes comprise 7 exons. Exon 1 encodes a nonamer leader peptide cleaved from the N-terminus of the HLA-B molecule during protein maturation. The resultant peptide can be presented by HLA-E molecules to stabilize their expression on the cell surface and enhance binding to the cognate receptor CD94/NKG2-A on NK cells. Polymorphisms in the sequence of the HLA-E-bound peptide are predicted to alter HLA-E stability and CD94/NKG2-A binding.10-12 Exons 2, 3, and 4 give rise to α1, α2, and α3 domains, respectively, and exons 5 through 7 encode the transmembrane and cytoplasmic tail. Variation within α1 and α2 domains provides structural and functional diversity to the peptide-binding region conventionally assessed for the matching of candidate stem cell donors and cord blood units for transplantation.
Beyond the peptide-binding region, functional sequence variation exists in exon 1.1 The -21 position of exon 1 (rs1050458) is invariant in HLA-A and HLA-C but dimorphic in HLA-B, where a cytosine/thymine change gives rise to leader peptides with threonine (T) or methionine (M) respectively at the second position (P2) of the nonamer peptide.1 Two ancient clades of HLA-B alleles defined by full-length gene sequences demonstrate a strong linkage between the M/T-leader dimorphism and coding variants of a given allele family with very few exceptions.13
Recent data implicate a sentinel role for the HLA-B leader in transplant survivorship, NK responses to leukemia, and HIV control.13-18 In unrelated donor and cord blood transplantation, the HLA-B leader identifies donor and cord blood unit HLA mismatch scenarios that are better tolerated than others and inform transplant survival.13,16,17 The mechanisms through which the dimorphic HLA-B leader affects immune responses in transplantation are not known but may include differential expression of the non-classical class I molecule HLA-E, a ligand for T- and NK-cell receptors.10,11,19
The use of the HLA-B leader to guide the judicious selection of stem cell sources has a particular impact in underserved populations in which HLA-matched stem cell sources are most often unavailable.20 However, a major roadblock for clinical translation of the leader to donor selection is the lack of complete exon 1 sequence data to relate leader assignment to the HLA-B allele. Currently, exon 1 sequences are publicly cataloged for 4148 (55%) of the currently recognized 7561 HLA-B alleles.1 Beyond incomplete HLA-B exon 1 sequence information, clinical laboratories lack tools for translation of HLA-B tissue typing to the leader defined by the P2 dimorphism to inform clinical decision making. This deficiency is particularly acute when HLA typing approaches do not include a direct assessment of exon 1.
To address these needs, we developed HLA-B Leader Assessment Tool (BLEAT), a program to automate leader assignment to each HLA-B allele, define leader genotypes (MM, MT, TT) of individuals, and indicate preferential order for selection of stem cell sources for transplantation based on prior outcome studies. Provision of the patient’s leader genotype provides information on transplant risks conferred by the patient’s germline HLA-B. Pairwise assessment of a patient with each candidate donor or cord blood unit provides information on whether mismatched HLA-B alleles have the same (“leader-matched”) or different (“leader-mismatched”) leaders and whether the matched allele has an M or a T leader. We leveraged phased HLA-B gene sequences in 1 098 358 volunteer US registry donors and a large transplant cohort to develop and validate the leader tool and define leader genotypes in racially diverse US populations. Beyond enhancing the evaluation of unrelated donors and cord blood units for transplantation, BLEAT provides a foundation for anthropologic, pharmacogenomic, and disease association studies.21-24
Materials and methods
Base cohort
As determined by the National Marrow Donor Program (NMDP) institutional review board staff, this study is not human subjects research as defined by regulations. The base cohort includes 9.42 million US-based donors with HLA-B typing from the Be The Match Registry as of May 29, 2020, who self-identified using NMDP race categorizations through either miscellaneous categories (ie, unknown, other, declined, multirace) or broad race categories (ie, African American [AFA], Asian or Pacific Islander [API], White [CAU], Hispanic or Latin American [HIS], American Indian or Alaskan Native [NAM]).25 NMDP broad race categories were mapped to US Census categories as Black or AFA, API, CAU, HIS, and NAM, respectively.26 Specific HLA-B alleles or availability of the leader sequence in International ImMunogGeneTics (IMGT) were not used to define the base cohort.
Cohort 1
Within the base cohort of 9.42 million donors, 1 098 358 donors (cohort 1) were sequenced for HLA-B exons 1 through 7 using single-molecule real-time PacBio sequencing.27 HLA sequencing laboratories prioritize coding sequences but not necessarily noncoding regions. Resulting ambiguity may be represented using any number of typing fields from 1 to 4, which are delimited via colons in an allele name (mock allele: HLA-B*01:02:03:04). Each donor in cohort 1 contributes 2 alleles, resulting in 2 196 716 total alleles. There were 2259 unique HLA-B alleles including 44 G groups (eg, HLA-B*07:02:01G) and 1 multiple allele code (MAC) allele (ie, HLA-B*39:BMFM). G groups represent ambiguous strings of alleles with the same nucleotide sequences across peptide-binding domains (exons 2 and 3 for HLA-B). MAC alleles are ambiguous strings encoded and decoded using a MAC service (HLA-B*39:BMFM encodes 46 alleles).28
Long-read sequences were reported to NMDP from March 2016 to July 2020. The 1 098 358 donors in cohort 1 served as the foundation for analysis of 2 196 716 HLA-B alleles (2259 total unique HLA-B alleles observed in cohort 1). Frequencies of the P2 M- and T-leader alleles and TT, MT, and MM leader genotype for each subject were identified for each broad race group.
Cohort 2
Cohort 2 consisted of 1269 patients with HLA typing in the Center for International Blood and Marrow Transplant Research database who received an unrelated donor transplant. An input supplemental File 1 was imported within BLEAT, leader-assigned, and exported. The resulting output dataset is supplemental File 2. This dataset served as a blinded validation of leader genotype assignment, shared leader P2, and match status of the leader alleles in patients and donors. High-resolution HLA typing was captured for patients and donors as previously described.13 Informed consent was obtained from transplant patients and donors. Protocols were approved by the institutional review boards of the National Institutes of Health Office for Human Research Protections, Be The Match/NMDP, and the Fred Hutchinson Cancer Research Center.
HLA-B exon 1 sequencing analysis
The 2 196 716 exon 1 sequences from 932 692 donors in cohort 1 were analyzed using a Jupyter notebook. The analysis leverages ImmunoPolymorphism Database (IPD)-IMGT/HLA database (version 3.42.0) exon 1 reference sequences1 to verify the exon 1 sequences of alleles with various resolutions: G groups, MAC, 2-to-4-field typing. Analysis scripts are available at https://github.com/nmdp-bioinformatics/b-leader/tree/master/analysis.
Statistical analysis
The genotype frequencies of HLA-B leader genotypes presented in Table 3 were tested for significant differences across 5 distinct broad race categories using Pearson’s χ2 test of independence with 8 degrees of freedom using R (version 4.0.2).29 Residual ambiguity at the level of leader allele polymorphism was resolved by Monte Carlo sampling of the likelihood distribution from statistical imputation based on haplotype frequencies derived from the corresponding US population.
Results
HLA-B leader sequence variation
The rs1050458C/T exon 1 dimorphism of the HLA-B leader is present in all HLA-B alleles recognized to date with very rare exceptions.1 Of the 9.42 million HLA-typed donors (base cohort) evaluated in the current study, a subset of 1 098 358 (cohort 1) were sequenced across exons 1 through 7 and introns 1 through 6, inclusively, with a median of 2724 base pairs and an interquartile range of 13 (2712, 2725) base pairs. HLA-B alleles were assigned based on long-read, phased sequencing of exons 1 through 7,27 with most sequences initiating 33 base pairs downstream of exon 1 in the 5' untranslated region and terminating at the end of exon 7.
Sequence variation at 12 of the 27 base pairs that encode the nonamer peptide (chromosome 6: 31 357,125-31 357,152 [GRCh38/hg38])30 was identified in cohort 1. These variant positions gave rise to 35 unique nucleotide sequences expected to encode 26 unique nonamer leader peptides (Table 1). The 5 most frequently observed sequences were found in 99.99% of the 2 196 716 haplotypes and encoded either T (68.9%) or M (31.1%) at P2. Rare variants were found, including 3 observations of a leader with arginine (R) and 1 observation with valine (V) at P2. Of the 3413 HLA-B alleles that currently lack exon 1 data in IMGT, 510 were present in cohort 1. Most of the 510 HLA-B alleles (99.99%) encoded a leader allele whose P2 aligned with the first-field HLA-B allele family, as demonstrated in Table 2.
Unique exon 1 sequences in cohort 1
| Deduced leader peptide | Nucleotide sequence for nonamer peptide | Total (% of total cohort) | ||||||||
|---|---|---|---|---|---|---|---|---|---|---|
| P1 | P2 | P3 | P4 | P5 | P6 | P7 | P8 | P9 | ||
| VMAPRTVLL* | GTC | ATG | GCG | CCC | CGA | ACC | GTC | CTC | CTG | 683 153 (31.1) |
| VTAPRTVLL† | — | -C- | — | — | — | — | — | — | — | 670 904 (30.5) |
| VTAPRTLLL‡ | — | -C- | — | — | — | — | C- | — | — | 542 311 (24.7) |
| VTAPRTVLL† | — | -C- | -A | — | — | — | — | — | — | 242 366 (11.0) |
| VTAPRTLLL‡ | — | -C- | -A | — | — | — | C- | — | — | 57 747 (2.6) |
| VTEPRTLLL | — | -C- | -A- | — | — | — | C- | — | — | 107 |
| VMAPRTVLL* | — | — | — | — | A- | — | — | — | — | 25 |
| VMAPRTVLL* | — | — | -A | — | — | — | — | — | — | 21 |
| VTAPRTVLL† | — | -CC | — | — | — | — | — | — | — | 16 |
| VTAPRTLLL‡ | — | -C- | -T | — | — | — | C- | — | — | 10 |
| VTAPRTLFL | — | -C- | -A | — | — | — | C- | T- | — | 7 |
| VTASRTLLL | — | -C- | — | T- | — | — | C- | — | — | 6 |
| VMAPRTLLL | — | — | — | — | — | — | C- | — | — | 5 |
| VTASRTVLL | — | -C- | — | T- | — | — | — | — | — | 4 |
| VRAPRTLLL | — | -G- | -A | — | — | — | C- | — | — | 3 |
| VTAPRTILL | — | -C- | — | — | — | — | A- | — | — | 3 |
| VTAPRNLLL | — | -C- | — | — | — | -A- | C-– | — | — | 3 |
| VMAPRTVLL* | — | — | — | — | — | — | — | — | T- | 3 |
| VTAPRTVLL† | — | -C- | -A | — | — | — | — | — | -A | 3 |
| VTAPQTVLL | — | -C- | — | — | -A- | — | — | — | — | 3 |
| VTATRTLLL | — | -C- | — | A- | — | — | C- | — | — | 2 |
| VTALRTVLL | — | -C- | — | -T- | — | — | — | — | — | 1 |
| VTAPRTLVL | — | -C- | — | — | — | — | C- | G- | — | 1 |
| ITAPRTVLL | A- | -C- | — | — | — | — | — | — | — | 1 |
| VMEPRTVLL | — | — | -A- | — | — | — | — | — | — | 1 |
| VTAP*TLLL | — | -C- | — | — | T- | — | C- | — | — | 1 |
| VTAPRTLLL‡ | — | -C- | — | — | — | — | C- | — | -A | 1 |
| VTAPRTFLL | — | -C- | — | — | — | — | T– | — | — | 1 |
| VMATRTVLL | — | — | — | A- | — | — | — | — | — | 1 |
| VMAPGTVLL | — | — | — | — | G- | — | — | — | — | 1 |
| VTAPRTVLQ | — | -C- | — | — | — | — | — | — | -A- | 1 |
| VMAPRSVLL | — | — | — | — | — | -G- | — | — | — | 1 |
| VVAPRTVLL | — | G- | — | — | — | — | — | — | — | 1 |
| VMVPRTVLL | — | — | -T- | — | — | — | — | — | — | 1 |
| VMAPRTVLV | — | — | — | — | — | — | — | — | G- | 1 |
| Total | 2 196 716 | |||||||||
The 1 098 358 donors in cohort 1 contain 2 196 716 observed exon 1 nucleotide sequences (each of which encodes a deduced peptide sequence). Each row details a unique nucleotide sequence. Nucleotide sequence rows are sorted by decreasing observations. Nucleotide sequences are aligned with the most frequent sequence; hyphens indicate consensus nucleotides. The asterisk within VTAP*TLLL indicates a deduced stop codon. The P2 sequence is indicated in bold, which is deduced to encode thymine (T) (1 513 499 observations); methionine (M) (683 213 observations); arginine (R) (three observations), or valine (V) (one observation). Percentages are provided for the top 5 peptides, which represent 99.99% of all observations. Race information for each peptide is provided in Table 4. Deduced leader peptides with multiple unique nucleotide sequences are annotated with footnotes.
These deduced leader peptides have 4 unique exon 1 sequences each in cohort 1.
Summary of HLA-B allele families and their linked leader types in cohort 1
| Existing reference alleles (IMGT) | Genomic sequence-based observations (cohort 1) | ||||
|---|---|---|---|---|---|
| Allele family (leader) | Minor allele(s) | Major alleles | Minor allele(s) | Total | |
| HLA-B (leader) | Count | HLA-B (leader) | Count (broad race*) | ||
| HLA-B*07 (M) | HLA-B*07:65 (T) | 251 053 | 251 055 | ||
| HLA-B*07:271 (T) | |||||
| HLA-B*07:371 (V) | HLA-B*07:371 (V) | 1 (White) | |||
| HLA-B*07:390 (T) | HLA-B*07:390† (T) | 1 (White) | |||
| HLA-B*08 (M) | — | 199 301 | HLA-B*08:207† (T) | 1 (White) | 199 302 |
| HLA-B*13 (T) | HLA-B*13:117 (M) | 54 456 | HLA-B*13:117 (M) | 1 (Asian or Pacific Islander) | 54 457 |
| HLA-B*14 (M) | — | 84 890 | — | — | 84 890 |
| HLA-B*15 (T) | HLA-B*15:68 (M) | 190 429 | HLA-B*15:68 (M) | 2 (Asian or Pacific Islander, multirace) | 190 431 |
| HLA-B*15:180 (M) | |||||
| HLA-B*18 (T) | — | 95 598 | HLA-B*18:01:01† (M) | 2 (White) | 95 600 |
| HLA-B*27 (T) | — | 78 897 | — | — | 78 897 |
| HLA-B*35 (T) | — | 235 193 | HLA-B*35:01:01† (M) | 33 (31 White, 2 multirace) | 235 226 |
| HLA-B*37 (T) | — | 29 684 | — | — | 29 684 |
| HLA-B*38 (M) | — | 45 774 | — | — | 45 774 |
| HLA-B*39 (M) | — | 69 503 | — | — | 69 504 |
| HLA-B*40 (T) | HLA-B*40:416 (M) | 142 805 | HLA-B*40:416 (M) | 2 (White, American Indian or Alaskan Native) | 142 807 |
| HLA-B*41 (T) | — | 17 724 | — | — | 17 724 |
| HLA-B*42 (M) | — | 11 772 | — | — | 11 772 |
| HLA-B*44 (T) | — | 215 355 | — | — | 215 355 |
| HLA-B*45 (T) | — | 17 870 | — | — | 17 870 |
| HLA-B*46 (T) | — | 9781 | — | — | 9781 |
| HLA-B*47 (T) | — | 4074 | — | — | 4074 |
| HLA-B*48 (M) | — | 15 407 | — | — | 15 407 |
| HLA-B*49 (T) | — | 30 234 | — | — | 30 234 |
| HLA-B*50 (T) | — | 21 137 | — | — | 21 137 |
| HLA-B*51 (T) | — | 126 774 | — | — | 126 774 |
| HLA-B*52 (T) | HLA-B*52:90 (M) | 37 355 | HLA-B*52:90 (M) | 1 (White) | 37 356 |
| HLA-B*53 (T) | — | 29 726 | — | — | 29 726 |
| HLA-B*54 (T) | — | 4116 | — | — | 4116 |
| HLA-B*55 (T) | HLA-B*55:91 (R) | 37 710 | HLA-B*55:91 (R) | 3 (2 Asian or Pacific Islander, 1 White) | 37 713 |
| HLA-B*56 (T) | HLA-B*56:68 (M) | 13 845 | — | — | 13 845 |
| HLA-B*57 (T) | — | 78 082 | — | — | 78 082 |
| HLA-B*58 (T) | HLA-B*58:112 (M) | 39 521 | HLA-B*58:112 (M) | 1 (multirace) | 39 522 |
| HLA-B*59 (T) | — | 646 | — | — | 646 |
| HLA-B*67 (M) | — | 698 | — | — | 698 |
| HLA-B*73 (M) | — | 1160 | — | — | 1160 |
| HLA-B*78 (T) | — | 1986 | — | — | 1986 |
| HLA-B*81 (M) | — | 3613 | — | — | 3613 |
| HLA-B*82 (T) | — | 494 | — | — | 494 |
| HLA-B*83 (T) | — | 4 | — | — | 4 |
| Total | 2 196 667 | 49 | 2 196 716 | ||
Reference HLA-B alleles and leader alleles were obtained from IPD-IMGT/HLA version 3.42.0.35 Each first-field HLA-B family is characterized by a major leader allele. A total of 12 minor alleles are found among 8 first-field families. Genomic sequence-based observations of cohort 1 confirmed eight of these 12 minor alleles and additionally detected evidence for another 3 HLA-B alleles with minor leader alleles at exon 1. Minor alleles represented 0.0022% of the leader alleles in cohort 1.
There are 5 possible broad race categorizations (Black or African American, Asian or Pacific Islander, White, Hispanic or Latin American, and American Indian or Alaskan Native) and 4 miscellaneous categories (multirace, unknown, other, and declined). Multirace applies to those who have more than one broad race listed. Additional details are listed in the Materials and Methods.
Four rare, minor alleles encoded novel polymorphisms outside of exons 2 through 4. Three of these alleles encoded minor leader alleles in families with no known prior minor leader alleles. These 4 observed sequences had novel polymorphisms outside of exons 2 through 4 (genomic positions 201-471; 716-992; 1566-1842; respectively) compared with reference sequences first described by IPD-IMGT/HLA version 3.42.0.1 The closest-matching allele was used as a placeholder. Note that the genomic position of P2 on the leader allele spans 10 through 12. The novel polymorphisms for HLA-B*07:390 are −18A>G; 15G>A; 2892T>C; and 2904G>C. HLA-B*08:207 has 11T>C. HLA-B*18:01:01 has −18A>G and 11C>T (GenBank accession MH173353 for the unique sequence). HLA-B*35:01:01 has 18A>G and 11C>T (GenBank accessions MG756798, MH973951, and MG769755 for unique sequences).
In summary, phased sequencing of exon 1 of HLA-B confirmed the general pattern of 1-to-1 linkage for the HLA-B coding region with the M and T dimorphism at P2 of the leader allele. We leveraged the complete sequence data on leader-allele haplotypes in cohort 1 and designed BLEAT to be informative for all currently known exon 1 through 4 HLA-B haplotypes.
Overview of BLEAT
More than 99.9% of HLA-B allele leader haplotypes encode either an M or T leader. Three steps are performed by BLEAT: (1) mapping of subject HLA-B allele typing to M- and T-leader designations (Figure 1); (2) assignment of leader genotype (MM, MT, TT) and match status for transplant pairs with 1 HLA-B mismatch (Figure 2); and (3) rank ordering of candidate donors based on previously defined risks associated with leader matching (Figure 2).

BLEAT leader assignment. Two scenarios are depicted using the 2 HLA-B alleles from 1 subject to illustrate a simple use case (HLA-B*07:06:01) and a more complex use case (HLA-B*56:01:01G). For clarity, only the last 5 alleles (by number) are displayed for HLA-B*56:01:01G.36 (A) The leader peptide is deduced from the exon 1 sequence. (B) The deduced leader peptide is available from IMGT in the Anthony Nolan HLA Informatics Group GitHub repository.35 (C) This information is processed and reflected on BLEAT’s user interface to display P2 information. The user may hover over the P2 “Leader” icon to reveal a tooltip (D) that organizes all potential HLA-B alleles from the provided allele into known and unknown major (and any minor, if applicable) leader alleles. Rare minor leader alleles are highlighted with red on the user interface.
BLEAT leader assignment. Two scenarios are depicted using the 2 HLA-B alleles from 1 subject to illustrate a simple use case (HLA-B*07:06:01) and a more complex use case (HLA-B*56:01:01G). For clarity, only the last 5 alleles (by number) are displayed for HLA-B*56:01:01G.36 (A) The leader peptide is deduced from the exon 1 sequence. (B) The deduced leader peptide is available from IMGT in the Anthony Nolan HLA Informatics Group GitHub repository.35 (C) This information is processed and reflected on BLEAT’s user interface to display P2 information. The user may hover over the P2 “Leader” icon to reveal a tooltip (D) that organizes all potential HLA-B alleles from the provided allele into known and unknown major (and any minor, if applicable) leader alleles. Rare minor leader alleles are highlighted with red on the user interface.
![BLEAT provides a rank order for candidate stem cell sources (“donors”) to optimize therapy selection and patient outcomes. The BLEAT user interface (left) has an infographic (right) that is toggled via the Help button (A). On the interface, users enter HLA-B typing information for each subject. (A) The patient’s leader genotype (MM, MT, or TT) is automatically classified upon entering the patient’s HLA-B typing. Ambiguous alleles can sometimes contain rare leader variants; the tool highlights this possibility in red. (B) HLA-B allele typing for donors can be manually entered or automatically imported. Before or during sorting, (C) the leader match status for each donor (matched with the patient) is calculated. Once calculated, a donor selection guide (D) highlights each selected donor’s relative level of risk for acute GVHD based on the patient’s leader genotype and published outcomes.13 The match status for each donor (E) is displayed through HapLogic match grades (A, allele match; P, potential match; L, allele mismatch; M, antigen mismatch)37 and leader match status (eg, MTT, a 3-letter nomenclature used to designate the leader of the patient’s mismatched HLA-B [first letter], the leader of the donor’s mismatched HLA-B [second letter], and the leader of the shared/matched HLA-B [third letter]).13](https://ash.silverchair-cdn.com/ash/content_public/journal/bloodadvances/6/1/10.1182_bloodadvances.2021004561/4/m_advancesadv2021004561f2.png?Expires=1769121275&Signature=Ps3OLRB2mwhIjX-Qqead~fE3UaC00KdWG~KPU-vrxDATUurASilN-NUVc8YUh20LP6M-cN28s513kN28Lv1MfeK4YtgENVBTWg3f6JB3I0XFPvaNHQW-DO6ULEsqDJNnZBYjQHl5k5yyO55P4hgrnVy8uHiUA14LjapIxu~P7L34SLPZH9eTD0f-yuD41T4asl~vNroeVTuyqiQzGuTxdq7SYrtkbAUYc97TRgHHHBssa~7zl4YsjWQMD8xKQnVHIXNcvo9SjtGR6CzT-iKnoMo6~W0GIkb7LLUsE2aFJwx8-QTdTZBbsqsrTx4dJ-SM-4fhvewmjFMblkF4vqHCsA__&Key-Pair-Id=APKAIE5G5CRDK6RD3PGA)
BLEAT provides a rank order for candidate stem cell sources (“donors”) to optimize therapy selection and patient outcomes. The BLEAT user interface (left) has an infographic (right) that is toggled via the Help button (A). On the interface, users enter HLA-B typing information for each subject. (A) The patient’s leader genotype (MM, MT, or TT) is automatically classified upon entering the patient’s HLA-B typing. Ambiguous alleles can sometimes contain rare leader variants; the tool highlights this possibility in red. (B) HLA-B allele typing for donors can be manually entered or automatically imported. Before or during sorting, (C) the leader match status for each donor (matched with the patient) is calculated. Once calculated, a donor selection guide (D) highlights each selected donor’s relative level of risk for acute GVHD based on the patient’s leader genotype and published outcomes.13 The match status for each donor (E) is displayed through HapLogic match grades (A, allele match; P, potential match; L, allele mismatch; M, antigen mismatch)37 and leader match status (eg, MTT, a 3-letter nomenclature used to designate the leader of the patient’s mismatched HLA-B [first letter], the leader of the donor’s mismatched HLA-B [second letter], and the leader of the shared/matched HLA-B [third letter]).13
BLEAT provides a rank order for candidate stem cell sources (“donors”) to optimize therapy selection and patient outcomes. The BLEAT user interface (left) has an infographic (right) that is toggled via the Help button (A). On the interface, users enter HLA-B typing information for each subject. (A) The patient’s leader genotype (MM, MT, or TT) is automatically classified upon entering the patient’s HLA-B typing. Ambiguous alleles can sometimes contain rare leader variants; the tool highlights this possibility in red. (B) HLA-B allele typing for donors can be manually entered or automatically imported. Before or during sorting, (C) the leader match status for each donor (matched with the patient) is calculated. Once calculated, a donor selection guide (D) highlights each selected donor’s relative level of risk for acute GVHD based on the patient’s leader genotype and published outcomes.13 The match status for each donor (E) is displayed through HapLogic match grades (A, allele match; P, potential match; L, allele mismatch; M, antigen mismatch)37 and leader match status (eg, MTT, a 3-letter nomenclature used to designate the leader of the patient’s mismatched HLA-B [first letter], the leader of the donor’s mismatched HLA-B [second letter], and the leader of the shared/matched HLA-B [third letter]).13
Mapping subject alleles to leader designations
The user may input HLA-B typing for a patient and any number of unrelated donor(s), cord blood unit(s), or other cellular therapy sources (“subjects”). BLEAT assigns a leader designation of M (methionine) or T (threonine) to each input allele based on alignment of reference HLA-B sequences from IMGT1 and primary exon 1 sequence data from this study.
For HLA-B alleles that lack exon 1 information, BLEAT maps the allele to the first-field allele family. A second well-known phenomenon in HLA typing is the presence of ambiguous combinations of HLA-B alleles depending on typing methodology and platform output resolution. For example, HLA-B*07:37:01G is a name that indicates a group of alleles consisting of HLA-B*07:37:01 and HLA-B*07:37:02, both are alleles that encode the M-leader, typical of the HLA-B*07 family. However, a few exceptions require careful consideration. For example, in Figure 1, HLA-B*56:01:01G contains HLA-B*56:68, a rare B*56 M-leader variant.
Leader genotype and leader match status assignment of patient and stem cell sources
As described, BLEAT categorizes >7561 HLA-B alleles by the -21 leader position of each HLA-B allele for an unlimited number of subjects. In transplantation where a patient and any number of candidate donors or cord blood units are under consideration, BLEAT provides the user with the leader genotype (MM, MT, TT) of the patient and each stem cell source and compares the leader genotype of each candidate stem cell source with that of the patient. Pairwise comparisons are then translated into leader match statuses. When the patient and the stem cell source have the same HLA-B alleles (HLA-B-matched), their leader sequences are “leader-matched.” For patient/stem cell sources with 1 HLA-B mismatch, a 3-letter leader nomenclature is used to describe the leader of the patient’s mismatched HLA-B allele, the leader of the stem cell source’s mismatched allele, and the leader of the shared (matched) allele. For single HLA-B mismatched pairs, a total of 8 unique leader match status combinations are possible: TTT, TTM, TMT, MTT, MMM, MMT, MTM, TMM.13 BLEAT uses tooltips and interactive color-coding to help interpret this nomenclature.
Rank ordering of candidate unrelated donor stem cell sources
Finally, BLEAT provides an ordered list of the preferred unrelated donor stem cell sources based on published patient outcomes.13,16,17 Selection order is defined by the patient’s leader genotype: MM and TT patients benefit from leader-matched donors. MT patients have a choice in donors based on leader match status and the leader of the shared allele; graft-versus-host-disease (GVHD) risk is lowest with leader-matched donors who share a T-leader allele (MT donors). Donors who are leader mismatched and/or share an M-leader allele are associated with higher clinical risk. The prioritization of suitable donors for MT patients is illustrated (Figure 2D). For instance, leader-matched MT donors sharing an HLA-B*58 (T-leader) allele (MMT leader match status) are sorted to the top of the donor list, followed by leader-matched MT donors sharing an HLA-B*07 (M-leader) allele (TTM), then leader-mismatched donors (MTT, TTM). Additionally, the possibility of rare, minor P2 alleles within the HLA-B*07:02:01G (HLA-B*07:65, HLA-B*07:271, HLA-B*07:371, HLA-B*07:390) and HLA-B*58:01:01G (HLA-B*58:112) allele groups are highlighted in Figure 2.
Evaluation of BLEAT
We evaluated the performance of BLEAT for the assignment of leader genotype and patient/donor leader match status by testing a cohort of 1269 patient/unrelated donor transplant pairs (cohort 2) whose HLA typing, leader genotypes, and match statuses were previously validated using a T-SQL script on a SQL server.13 In the current study, the user was blinded to the previously assigned leader genotype and match status and applied BLEAT to independently assign the leader genotype to each patient and donor. Supplemental File 1 provides the input of cohort 2 for BLEAT. The leader match status of each transplant pair was determined via BLEAT and exported as supplemental File 2. BLEAT-assigned leader genotypes were concordant as was leader match status (leader-matched vs leader-mismatched; shared M vs shared T leader).
Broad race frequencies of HLA-B leader peptides
Study subjects for clinical and basic research may possess HLA-B typing at various degrees of resolution (fields) for alleles with known or unknown exon 1 sequences. We assessed the capability of BLEAT to assign leader genotypes for large-scale analysis of racially diverse subjects in the base cohort of 9.42 million registered donors selected solely on the basis of availability of HLA-B typing. First, we noted that the major leader allele T is observed in >68% of US registry donors in all race categories. We then examined the distribution of leader alleles and genotypes according to self-described race categories. The distribution of HLA-B leader genotypes differed significantly by donor race (P < 2.2 × 10⁻¹⁶) (Table 3). The frequency of the TT genotype was highest among Asians.
HLA-B leader genotype and allele frequencies in 5 US continental races in the base cohort
| Donor race categories | No. of donors | Leader allele frequencies (%) | Leader genotype frequencies (%) | |||
|---|---|---|---|---|---|---|
| T | M | TT | MT | MM | ||
| White | 5 224 777 | 67.8 | 32.2 | 46.2 | 43.3 | 10.5 |
| Hispanic or Latino | 1 289 395 | 72.7 | 27.3 | 53.0 | 39.3 | 7.7 |
| Asian or Pacific Islander | 951 723 | 85.6 | 14.4 | 73.6 | 24.0 | 2.4 |
| Black or African American | 837 531 | 75.4 | 24.6 | 56.9 | 36.9 | 6.1 |
| American Indian or Alaskan Native | 79 858 | 71.1 | 28.9 | 51.0 | 40.1 | 8.8 |
Allele frequencies across populations vary for T (67.8%-85.6%) and M (14.4%-32.2%), and genotype frequencies vary for TT (51.0%-73.6%), MT (24.0%-43.3%), and MM (2.4%-10.5%). Genotype frequencies were found to differ significantly across races using Pearson's χ2 test of independence (8, N = 9 417 614) = 273 178, P < 2.2 × 10⁻¹⁶. The base cohort total is 9 417 614. There are 1 034 330 omitted donors with a race that is unknown, multirace, other, or was declined to be reported.
Table 4 is a race-based extension of Table 1 from cohort 1. Leader allele frequencies are similar between the base cohort (Table 3) and its subset cohort 1 (Table 4). M-leader allele frequency percentages are similar for White (32.2% [base cohort] vs 34.2% [cohort 1]), Hispanic or Latino (27.3% vs 30.3%), Asian or Pacific Islander (14.4% vs 14.8%), Black or African American (24.6% vs 25.5%), and American Indian or Alaskan Native (28.9% vs 27.7%) groups.
Broad race categories for leader peptides observed in cohort 1
| Deduced leader peptide | Hispanic or Latino | Asian or Pacific Islander | Black or African American | American Indian or Alaskan Native | Multirace | Unknown | Total (% of cohort total) | |
|---|---|---|---|---|---|---|---|---|
| White | Percentage by leader peptide’s total, horizontally (%); percentage by broad race’s total, vertically (%) | |||||||
| VMAPRTVLL* | 64.5; 34.2 | 15.9; 30.3 | 3.6; 14.8 | 3.8; 25.5 | 0.3; 27.7 | 11.1; 29.4 | 0.9; 33.3 | 683 153 (31.1) |
| VTAPRTVLL† | 47.8; | 19.6; | 11.4; | 7.2; | 0.4; | 12.9; | 0.6; | 670 904 (30.5) |
| 24.9 | 36.7 | 46.5 | 47.7 | 34.4 | 33.5 | 23.4 | ||
| VTAPRTLLL‡ | 63.2; | 15.2; | 7.0; | 2.3; | 0.4; | 11.1; | 0.9; | 542 311 (24.7) |
| 26.6 | 23.0 | 22.9 | 12.0 | 26.8 | 23.3 | 28.0 | ||
| VTAPRTVLL† | 61.9; | 12.7; | 6.7; | 5.8; | 0.3; | 11.8; | 0.9; | 242 366 (11.0) |
| 11.6 | 8.6 | 9.8 | 13.8 | 8.9 | 11.0 | 12.8 | ||
| VTAPRTLLL‡ | 59.5; | 8.8; | 16.9; | 1.6; | 0.3; | 12.1; | 0.7; | 57 747 (2.6) |
| 2.7 | 1.4 | 5.9 | 0.9 | 2.2 | 2.7 | 2.4 | ||
| VTEPRTLLL | 77.6 | 10.3 | — | 0.9 | — | 11.2 | — | 107 |
| VMAPRTVLL* | 92.0 | 4.0 | — | — | — | 4.0 | — | 25 |
| VMAPRTVLL* | 9.5 | — | 71.4 | — | 4.8 | 14.3 | — | 21 |
| VTAPRTVLL† | 6.3 | 31.3 | — | 56.3 | — | 6.3 | — | 16 |
| VTAPRTLLL‡ | 10.0 | 50.0 | 40.0 | — | — | — | — | 10 |
| VTAPRTLFL | 100.0 | — | — | — | — | — | — | 7 |
| VTASRTLLL | — | 50.0 | — | 16.7 | — | 33.3 | — | 6 |
| VMAPRTLLL | 80.0 | — | 20.0 | — | — | — | — | 5 |
| VTASRTVLL | 75.0 | — | — | — | — | 25.0 | — | 4 |
| VRAPRTLLL | 33.3 | — | 66.7 | — | — | — | — | 3 |
| VTAPRTILL | 100.0 | — | — | — | — | — | — | 3 |
| VTAPRNLLL | 100.0 | — | — | — | — | — | — | 3 |
| VMAPRTVLL* | 100.0 | — | — | — | — | — | — | 3 |
| VTAPRTVLL† | — | — | 66.7 | — | — | 33.3 | — | 3 |
| VTAPQTVLL | 33.3 | — | — | — | — | 66.7 | — | 3 |
| VTATRTLLL | 100.0 | — | — | — | — | — | — | 2 |
| VTALRTVLL | — | 100.0 | — | — | — | — | — | 1 |
| VTAPRTLVL | 100.0 | — | — | — | — | — | — | 1 |
| ITAPRTVLL | — | — | — | — | — | — | 100.0 | 1 |
| VMEPRTVLL | 100.0 | — | — | — | — | — | — | 1 |
| VTAP*TLLL | 100.0 | — | — | — | — | — | — | 1 |
| VTAPRTLLL‡ | — | 100.0 | — | — | — | — | — | 1 |
| VTAPRTFLL | 100.0 | — | — | — | — | — | — | 1 |
| VMATRTVLL | — | 100.0 | — | — | — | — | — | 1 |
| VMAPGTVLL | — | — | 100.0 | — | — | — | — | 1 |
| VTAPRTVLQ | 100.0 | — | — | — | — | — | — | 1 |
| VMAPRSVLL | — | — | — | — | — | 100.0 | — | 1 |
| VVAPRTVLL | 100.0 | — | — | — | — | — | — | 1 |
| VMVPRTVLL | 100.0 | — | — | — | — | — | — | 1 |
| VMAPRTVLV | — | — | 100.0 | — | — | — | — | 1 |
| Total (% by cohort total) | 1 288 740 (58.7%) | 358 322 (16.3%) | 164 740 (7.5%) | 101 512 (4.6%) | 7104 (0.3%) | 258 404 (11.8%) | 17 592 (0.8%) | 2 196 716 |
The deduced leader peptides from Table 1 are related to the corresponding donor’s broad race. The first percentages are based on the leader peptide’s total (horizontal). The top 5 peptides have percentages based on the broad race’s total (vertical) listed second. Deduced leader peptides with multiple unique nucleotide sequences are annotated with footnotes. The cohort total is 2 196 716.
These deduced leader peptides have four unique exon 1 sequences each in cohort 1.
Access to BLEAT
The BLEAT user interface is accessible through https://bleader.nmdp.org. The codebase and application programming interface are provided at https://github.com/nmdp-bioinformatics/b-leader for flexible integration into any computational workflow and the ability to incorporate future added functionality. This tool has been tested by independent users since early 2020 and is supported as a service to the global transplant center and research community.
Discussion
Elucidation of the HLA-B leader as a functional determinant in HIV, leukemia relapse, and stem cell transplantation has major implications for advancing knowledge of the immunobiology of HLA-B.13-18 For unrelated donor searches that yield HLA-B-mismatched donors, BLEAT is designed to assess whether the HLA-B mismatch is associated with lower (leader matched) or higher (leader mismatched) risk of clinically significant acute GVHD.10 When HLA-B is matched (patient and donor leader genotype are identical) and the donor mismatch is located at either HLA-A, -C, -DRB1, or -DQB1, the clinical significance of an HLA-A, -C, -DRB1, or -DQB1 mismatch depends on the patient/donor leader genotype.14 HLA-B-matched patients and donors with the MM leader genotype have increased risks of mortality, nonrelapse mortality, and acute GVHD relative to HLA-B-matched patients and donors with the TT leader genotype; single HLA-DRB1 and HLA-DQB1 mismatches are better tolerated than other mismatched loci when the patient and donor have the TT leader genotype.14 BLEAT may be used to determine HLA-B leader genotypes to compare risks and enhance donor selection.
Although >7561 unique HLA-B alleles are currently recognized,1 only 55% of these alleles have sequence information on the exon 1 rs1050458 dimorphism. Furthermore, exon 1 sequence data are not readily captured to facilitate clinical decision-making. We approached this unmet need via the validation of HLA-B leader sequences to known HLA-B alleles and the addition of new information on leader sequences for novel or rare HLA-B alleles. With a validated sequence library, we developed a tool to automate leader assignment to an HLA-B allele, derive leader genotypes for patients and donors, and compare leader match status in the patient to candidate transplant donors.
The current study was designed to address unmet needs in transplantation, namely, a user-friendly tool to accurately and efficiently determine the HLA-B leader to facilitate the selection of stem cell sources for patients. To this end, we mandated rigorous quality control for leader assignment and ascertainment of leader match status by the blinded study of a previously characterized cohort of patients and their transplant donors. We also leveraged a unique pool of 1 098 358 registered US donors with phased sequence data for HLA-B to verify the physical linkage of the -21 variant to the coding region and assigned HLA-B allele type. This cohort provided a unique opportunity to explore and extend known sequence information within exon 1 of HLA-B and better understand genotype frequencies of the leader across racially diverse US populations. We confirmed that >99.9% of 1 098 358 donors have leader alleles with either M or T at P2. We found striking differences in major and minor M- and T-leader frequencies across 1 098 358 donors representative of US continental populations. Although we present data on a large US population for HLA-B, the frequencies of HLA-B M and T leaders remain to be validated independently. The extension of these studies to other diverse populations remains an important research objective.
Although complete donor HLA matching at HLA-A, -B, -C, -DRB1 (HLA-8/8), and -DQB1 (HLA-10/10) lowers acute and chronic GVHD and improves survival after unrelated donor hematopoietic cell transplantation,10 many patients only have mismatched donor options.19 Current donor criteria consider the total number of HLA mismatches with preference given to donors mismatched at only 1 HLA gene (HLA-7/8 or HLA-9/10) over donors mismatched at 2 HLA loci (HLA-6/8 or HLA-8/10) to lower risks. When a search yields donors mismatched at HLA-A, -C, -DRB1, or -DQB1, the patient leader genotype defines the risks of mismatching; for all leader genotypes, a single HLA-DQB1 or -DRB1 mismatch is better tolerated compared with an HLA-A or -C mismatch, but risks depend on the combination of the leader genotype as well as the mismatched locus.14 Use of BLEAT enhances donor selection to lower overall risks to patients with HLA-mismatched donors. Although global leader genotype frequencies may differ across diverse populations, the HLA-B leader has clinical significance in all patients and donors; hence, the integration of BLEAT into clinical practice is expected to improve survival and lower transplant-associated risks for patients of all race/ethnic backgrounds.10,14 The specific mechanisms by which the leader influences GVHD and survival are the subjects of current research efforts; however, mechanisms include the potential role for NK and T-cell recognition of HLA-E. Class I leader peptides promote cell surface expression of HLA-E, where it may interact with T-cell and NK-cell receptors.11,12,16-18
Beyond applications in transplantation, BLEAT has utility in population-based studies and research on diseases with strong associations to HLA-B (Figure 3). BLEAT may be used by clinical and basic researchers and stem cell registries to automate leader assignment in small- or large-scale studies to define the population genetics of HLA-B and help inform recruitment of future stem cell donors to support transplantation. Clinical and basic researchers may also use BLEAT to understand the functional significance of the leader particularly when information on HLA-B exon 1-linked variation is desirable.15,18 Because BLEAT requires HLA-B typing, it is subject to the limitations of both data captured in reference databases and data supplied by the user. High-resolution (allele) typing data are ideal; however, BLEAT accommodates typing at lower levels of resolution and when exon 1 is not directly sequenced. We demonstrate that general concordance of HLA-B leader assignments using first-field typing holds true for 2259 unique alleles encoded by 2.2 million haplotypes, but exceptions do occur. These exceptions give rise to both major and minor leader alleles in some allele families more than others. When HLA-B typing is acquired at low-resolution (ie, first-field), BLEAT signals the potential existence of an alternative leader based on the frequencies of major and minor leader alleles in a given allele family. As new HLA-B alleles are discovered, delineation of their exon 1 sequences will continue to be an important element of annotating the full spectrum of HLA-B variation.
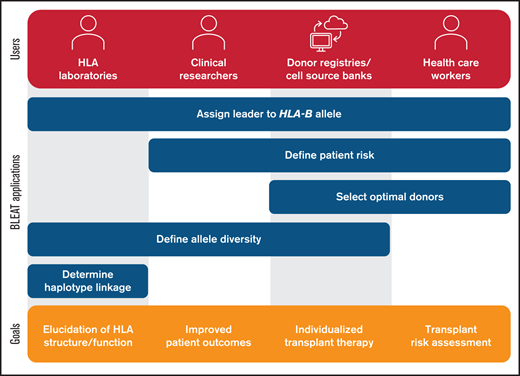
Utility of BLEAT for diverse applications. The assignment of the leader genotype to the HLA-B allele may be useful for downstream applications by HLA laboratories, clinical researchers, donor registries, cell source banks, and health care workers. For HLA laboratories involved in basic research, these include exploration of allele diversity and haplotype linkage involving HLA-B to examine HLA structure and function. Laboratories may also supply this information for clinical research pursuits in understanding historical patient risk or modeling future risk to improve outcomes. Health care workers can apply BLEAT toward the selection of optimal donors based on transplant risk that can also be facilitated by donor registries or cell source banks. The assessment of HLA-B allele diversity can also aid in ensuring that therapies are available for diverse populations and enable individualized treatment.
Utility of BLEAT for diverse applications. The assignment of the leader genotype to the HLA-B allele may be useful for downstream applications by HLA laboratories, clinical researchers, donor registries, cell source banks, and health care workers. For HLA laboratories involved in basic research, these include exploration of allele diversity and haplotype linkage involving HLA-B to examine HLA structure and function. Laboratories may also supply this information for clinical research pursuits in understanding historical patient risk or modeling future risk to improve outcomes. Health care workers can apply BLEAT toward the selection of optimal donors based on transplant risk that can also be facilitated by donor registries or cell source banks. The assessment of HLA-B allele diversity can also aid in ensuring that therapies are available for diverse populations and enable individualized treatment.
At the population level, the assignment of the HLA-B leader genotypes for registered unrelated donors and cord blood units can be automated upon entry of validated HLA data into the registry systems. Such application is already underway for the automatic interpretation of HLA-B typing entries in the Stem Cell Therapeutic Outcomes Database at the Center for International Blood and Marrow Transplant Research and for the Be The Match Registry operated by the NMDP.
The intended application of BLEAT in transplantation is to aid the user in handling HLA genetic information rather than replace clinical decision-making. Selection of stem cell sources for hematopoietic cell transplantation is complex. Individual HLA features (eg, the HLA-B leader and HLA-DPB1 mismatching)31 and non-HLA characteristics (eg, donor age)32 affect the success of transplantation; however, the impact of HLA and non-HLA factors in combination remain important research questions. As potential synergistic effects of HLA and non-HLA features are elucidated, characteristics that define an “ideal” donor for a given patient provide an important basis for building the next generation of tools to facilitate donor selection. To this end, BLEAT components are provided for connection to existing pipelines and interfaces.
We envision a flexible user interface in which therapy selection criteria and sorting are provided based on evidence-based research guidelines in the HLA-mismatch setting. Exact criteria and sorting rules can be designated by the user as desired for different disease categories, therapy options, and other needs in the application. Future refinements to BLEAT to accommodate prioritization of preferable cord blood units based on the leader are forthcoming. In addition, a display of the results from the HLA-DPB1 TCE Prediction Tool for assessment of HLA-DPB1 permissive mismatches31 along with BLEAT may connect to a consolidated interface or other platform and enable users to view both HLA-B and HLA-DPB1 risk calculations among available stem cell source options. The utility of a comprehensive HLA genetic tool has particular relevance when there is clinical urgency to proceed to transplantation and when the only available stem cell sources are HLA-mismatched. With the continued development of new transplant regimens, the impact of HLA and non-HLA factors in different clinical settings will also be an important area for future investigation.
Each year, approximately 18 000 patients need an unrelated or cord blood hematopoietic cell transplant to cure a life-threatening blood disorder.33,34 Many of these patients will have only HLA-mismatched stem cell sources.20 New information on the role of the HLA-B leader in HLA-mismatched transplantation showcases the clinical importance of variation located outside of the peptide-binding region. The availability of BLEAT for the direct translation of HLA-B sequence variation to donor selection and pretransplant risk assessment represents a patient-directed approach for improving clinical outcomes.
Acknowledgments
The authors thank Caroline McKallor for data support and Pradeep Bashyal for software infrastructure.
This work was supported by grants from the National Institutes of Health National Institute of Allergy and Infectious Diseases (AI069197) and National Cancer Institute (CA231838 and CA100019) to E.W.P. and C.M. Bioinformatics methods development was supported in part by the Office of Naval Research Grant N00014-19-1-2705 to National Marrow Donor Program/Be The Match. Funding agencies had no role in study design, data collection and analysis, the decision to submit the manuscript for publication, or preparation of the manuscript.
Authorship
Contribution: E.W.P. and Y.-T.B. conceived and supervised the study; R.S. developed BLEAT; R.S. conducted sequence analysis on cohort 1 and leader annotation on cohort 2; M.J.M. conducted frequency analysis on the base cohort; and all authors contributed to the manuscript figures, tables, and text.
Conflict-of-interest disclosure: The authors declare no competing financial interests.
Data sharing statement: The user interface and code for BLEAT and leader analysis are available at https://bleader.nmdp.org and https://github.com/nmdp-bioinformatics/b-leader, and supporting data and details are provided in supplemental Materials and Methods. Genbank accession numbers are MH173353, MG756798, MH973951, and MG769755 for novel sequences. For more information, please contact bioinformatics-web@nmdp.org.
Correspondence: Yung-Tsi Bolon, Immunobiology and Bioinformatics Research, National Marrow Donor Program/Be The Match, Center for International Blood and Marrow Transplant Research, 500 N 5th St, Minneapolis, MN 55455; e-mail: ybolon@nmdp.org.

