

Key Points
High concentrations of eltrombopag suppress cord blood MK differentiation and proliferation in vitro.
These effects are mediated by the iron-chelating effects of eltrombopag and are modulated by the iron status of the MK progenitors.

Abstract
Eltrombopag (ELT) is a thrombopoietic agent approved for immune thrombocytopenia and also a potent iron chelator. Here we found that ELT exhibited dose-dependent opposing effects on in vitro megakaryopoiesis: low concentrations (≤6 µM, ELT6) stimulated megakaryopoiesis, but high concentrations (30 µM, ELT30) suppressed megakaryocyte (MK) differentiation and proliferation. The suppressive effects of ELT30 were reproduced by other iron chelators, supporting iron chelation as a likely mechanism. During MK differentiation, committed MK progenitors (CD34+/CD41+ and CD34−/CD41+ cells) were significantly more sensitive than undifferentiated progenitors (CD34+/CD41− cells) to the suppressive effects of ELT30, which resulted from both decreased proliferation and increased apoptosis. The antiproliferative effects of ELT30 were reversed by increased iron in the culture, as were the proapoptotic effects when exposure to ELT30 was short. Because committed MK progenitors exhibited the highest proliferative rate and the highest sensitivity to iron chelation, we tested whether their iron status influenced their response to ELT during rapid cell expansion. In these studies, iron deficiency reduced the proliferation of CD41+ cells in response to all ELT concentrations. Severe iron deficiency also reduced the number of MKs generated in response to high thrombopoietin concentrations by ∼50%, compared with iron-replete cultures. Our findings support the hypothesis that although iron deficiency can stimulate certain cells and steps in megakaryopoiesis, it can also limit the proliferation of committed MK progenitors, with severity of iron deficiency and degree of thrombopoietic stimulation influencing the ultimate output. Further studies are needed to clarify how megakaryopoiesis, iron deficiency, and ELT stimulation are clinically interrelated.
Introduction
Romiplostim (ROM) and eltrombopag (ELT) are Food and Drug Administration–approved thrombopoietin (TPO) mimetics used in adults and children with chronic thrombocytopenia of different etiologies.1,2 In a study assessing responses of neonatal and adult human megakaryocyte (MK) progenitors to TPO, ROM, and ELT, we observed that both TPO and ROM increased the number of MKs generated in vitro in a similar, dose-dependent manner. In contrast, we found that ELT stimulated megakaryopoiesis at low concentrations but had inhibitory effects at concentrations >6 µM and induced significant cell death at 30 µM. These findings were consistent with a prior study showing that ELT concentrations of 6 µg/mL (13.6 µM) profoundly reduced the number of cord blood (CB)–derived MKs generated in vitro.3
The mechanisms underlying these observations have not been previously investigated. Given an increased recognition of the potent iron-chelating effects of ELT on leukemia cells,4 cardiomyocyte cell lines,5 osteoclasts,6 and neonatal hippocampal neurons,7 this study was designed to evaluate whether ELT-induced iron chelation mediates some of the toxic effects of ELT in CB-MK progenitors. As a secondary objective, we aimed to establish whether iron availability and the cellular iron status of MK progenitors influence the responses to ELT in vitro. This is clinically relevant because the iron status of patients treated with ELT is extremely variable, ranging from significant iron deficiency in patients with immune thrombocytopenia (ITP) and frequent bleeding to iron overload in patients with aplastic anemia who are red cell transfusion dependent.
In addition, although iron deficiency is commonly associated with thrombocytosis, thrombocytopenia has been reported in children and adults with severe iron deficiency anemia, which resolved following treatment with iron administration or red cell transfusion.8,9 Thus, we also explored whether iron deficiency affected TPO-induced megakaryopoiesis in vitro, independently of ELT. These studies demonstrated that severe iron deficiency significantly impaired the expansion of differentiated MK progenitors (CD41+ cells) in response to high TPO concentrations, revealing a potential biphasic role for iron on megakaryopoiesis, particularly in the setting of thrombopoietic stimulation.
Materials and methods
Cell cultures
CB was collected with Institutional Review Board approval from healthy full-term neonates at Beth Israel Medical Center Labor and Delivery, and CD34+ cells were isolated by positive magnetic selection (Miltenyi Biotec). The study was conducted in accordance with the Declaration of Helsinki. Granulocyte colony-stimulating factor–mobilized adult peripheral blood (PB) CD34+ cells were purchased from the Fred Hutchinson Cancer Institute (Seattle, WA). For initial experiments, CD34+ cells from either source were cultured in a serum-free commercial culture medium (StemSpan; Stemcell Technologies, Canada) with increasing concentrations of TPO (1-100 ng/mL; PeproTech), ROM (1-200 ng/mL; Nplate, Amgen), and ELT (1-30 µM; Santa Cruz Biotechnology, Santa Cruz, CA, and Selleck Chemical Company, Houston, TX) or with low TPO concentrations (3 ng/mL, TPO3) plus increasing concentrations of ELT (0-30 µM). All cultures underwent twice-weekly media changes for 14 days as described.10 Cell counts were obtained using a hemocytometer under the microscope (20X) after staining with trypan blue for 3 to 5 minutes. K562 cells (human erythroblastic leukemia) were maintained in Dulbecco’s modified Eagle medium supplemented with 10% fetal bovine serum, 10 000 units penicillin, and 10 mg streptomycin per mL.
To assess the effects of iron chelation on megakaryopoiesis, CB CD34+ cells were cultured for 14 days in StemSpan (as described) with TPO 3 ng/mL alone or TPO 3 ng/mL plus different concentrations of ELT (6 and 30 µM) or the iron chelators deferoxamine (DFO) or deferiprone (DFP), both at 6, 30, or 100 µM. Cell growth was quantified twice weekly, and MK differentiation was assessed by flow cytometry on culture-day 7. In order to generate MKs with different iron content, cells were cultured in Iscove modified Dulbecco medium (IMDM) supplemented with 1% bovine serum albumin, 400 μg/mL human transferrin, 2mM l-glutamine, 10 μg/mL insulin, and 40 μg/mL low-density lipoproteins.10 All cultures had the same total transferrin concentration (400 µg/mL) but with different holo-transferrin (HOLO, fully iron-saturated) to apo-transferrin (APO, iron-free; both Calbiochem) ratios. This generated Fe-depleted (100% APO), Fe-deficient (10% HOLO/90% APO), and Fe-replete progenitors (100% HOLO). In preliminary studies, we also investigated the effects of 50% HOLO. This condition gave very similar results to 100% HOLO and for that reason was not included in all studies. All cultures contained TPO, either at optimal growth concentrations (50 ng/mL) or physiologic concentrations (3 ng/mL). Iron status/ELT interactions were evaluated by adding different ELT concentrations to these cultures.
Calcein iron assays
K562 cells (an erythroleukemia cell line) or day-11 CB-MKs, in their original culture media (StemSpan medium for CB-MKs and 10% Dulbecco’s modified Eagle medium for K562 cells), were incubated with 2 nM calcein-acetoxymethyl ester for 15 minutes. After washing twice with IMDM, cells (at a density of 5 × 10⁵/mL) were resuspended in IMDM containing 1% bovine serum albumin. 90 µL of cell suspension were added to U-shape 96-well plates, preloaded with 10 µL of 10x concentrated solutions. After a 1-hour incubation, the calcein mean fluorescence intensity (MFI) was measured by flow cytometry. Cells treated with 30 µM ELT always generated the highest MFI, which was used as the maximal fluorescence. The ΔFluorescence was calculated by subtracting the fluorescence in different treatments from the maximal fluorescence, which was applied as an indicator of the intracellular labile iron pool (LIP).
MK expansion and differentiation
The effects of ELT and the iron chelators DFO and DFP on cell expansion and MK differentiation and maturation were determined. Cell expansion was assessed by counting cells at times of media changes (0, 4, 7, and 11) and on culture-day 14. Cell proliferation was expressed as the cell number per 1000 CD34+ cells plated or as fold expansion in short-term experiments. MK differentiation was evaluated as the percentage of live cells expressing the MK marker CD41+. For flow cytometric evaluation at the indicated times, cells were first incubated with 5 μM Hoechst 33342 (final concentration) for 1 hour. Cell suspensions (200 000 cells in 50 μL) were then incubated with 10 μL of different fluorochrome-conjugated anti-human CD34, CD41, CD42b, and TfR1 (CD71) antibodies for 15 to 20 minutes (all from BD Biosciences, San Jose, CA). Surface expression levels of the different markers were analyzed using a LSRII FACS analyzer, and isotype IgGs were applied as references.
Cell proliferation and apoptosis
Cell proliferation was evaluated using the Click-iT EdU (Invitrogen-Thermo Fisher Scientific, Waltham, MA) assay. Briefly, a proportion of cultured cells were incubated with 10 μM (final concentration) of 5-ethynyl-2-deoxyuridine (EdU) for 1 hour. After centrifugation, cells were incubated with allophycocyanin-conjugated anti-CD41 antibody and BV421-conjugated anti-CD34 antibody for 20 minutes, after which they were suspended in 2 mL of PBS and fixed in 2% paraformaldehyde (final concentration). Fixed cells might be preserved at 4°C in dark. After permeabilization, cells were incubated for the copper-catalyzed alkyne-azide cycloaddition (“Click” reaction) following manufacturer’s instructions. A selected fluorochrome (Alexa 555) was chemically linked to DNA-incorporated EdU and analyzed by flow cytometry. Data were presented as percent of EdU+ cells in the different cell populations. Cells remaining after FACS analysis were processed for cytospin and examined under a Nikon Epi-fluorescent microscope.
Apoptosis was evaluated by terminal deoxynucleotidyltransferase-mediated dUTP nick end labeling (TUNEL) assay. Cells labeled with anti-CD34 and anti-CD41 antibodies as described were permeabilized and incubated for terminal deoxynucleotidyltransferase reaction following the manufacturer’s protocol (BD Biosciences). After labeling with an anti-BrdU antibody, apoptotic cells were quantified by flow cytometry and further examined by fluorescent microscopy.
Statistical Analysis
The effects of ELT and other iron chelators on MK differentiation were assessed by analysis of covariance, yielding an estimate of the change in cell number per unit concentration of chelator (slope), stratifying by cell population. We used 2-factor analysis of variance to evaluate the joint effects of ELT and iron availability on a variety of cellular responses including cell numbers, TfR-1 surface expression, proliferation, apoptosis, and expansion. Analysis of variance was performed separately in each cell population, and cell numbers were log-transformed for analysis. Where we found significant interaction of ELT with iron status (HOLO %), we assessed the influence of iron status at each ELT concentration separately, constructing and testing contrasts across the levels of HOLO from the fitted model parameters.
All statistical analyses included random effects to account for variability among independent cultures or replicate experiments. We applied robust regression methods to detect and down-weight or eliminate outlying data points. R and SAS software (version 9.4, Cary, NC) were used for statistical computations.
Results
MK responses to TPO, ROM, and ELT
In our in vitro cultures, CB-MK progenitors generated ∼10 times more MKs (per CD34+ cell) than adult PB progenitors in response to all thrombopoietic agents. For both cell sources, the maximal number of MKs (CD41+ cells) generated with ELT was lower than that achieved with TPO (P = .03 and .002 for CB and PB, respectively) or ROM (supplemental Figure 1A). At all TPO, ROM, or ELT concentrations, CB-MKs exhibited lower ploidy levels (supplemental Figure 1B) but higher percentages of CD42b+ MKs (a mature MK marker) than PB cultures (supplemental Figure 1C), consistent with the previously described pattern of neonatal megakaryopoiesis.11,12
In these cultures, ELT concentrations ≤6 µM increased MK counts, but cultures containing 30 µM ELT exhibited substantial cell death. Because ELT binds to a different part of the TPO receptor than TPO or ROM, we also evaluated them in combination. The inhibitory effects of high ELT concentrations were not abrogated by the addition of TPO at concentrations that might be found in hyporegenerative thrombocytopenias (3 ng/mL, TPO3) (supplemental Figure 2).
ELT chelates intracellular iron in MKs
ELT has been recognized as a potent iron chelator in leukemia cells,4 cardiomyocyte cell lines,5 and neonatal hippocampal neurons.7 Thus, we evaluated whether ELT has iron-chelating effects in human MKs. In K562 cells, ELT depleted the intracellular LIP in a dose-dependent manner, as indicated by the progressive increase in calcein fluorescence (Figure 1A). ELT concentrations >10 µM reduced the LIP to lower levels than did DFP at a concentration of 200 µM (Figure 1B), indicating the strength of ELT’s iron-chelating properties. The iron-chelating effects of ELT were similar in CB-MKs and K562 cells (Figure 1B).

Dose-dependent iron-chelating effects of ELT on megakaryopoiesis. (A) The iron-chelating effects of ELT were evaluated using the calcein iron assay in K562 cells. Free calcein fluorescence increased as intracellular free iron decreased in response to ELT in a dose-dependent manner. (B) ΔFluorescence, calculated as the maximal calcein fluorescence minus the fluorescence with a specific treatment, was used to reflect the intracellular LIP, which decreased with increasing ELT concentrations. Thirty µM ELT always induced the highest calcein fluorescence, which was used as maximal fluorescence for these calculations. Shown are the results for CB-MKs treated with ELT (n = 4), K562 cells treated with ELT (n = 3), and K562 cells treated with the intracellular iron chelator DFP (n = 3). (C-E) CB-CD34+ cells were cultured with TPO3 alone, TPO3 plus the indicated concentrations (µM) of ELT, or TPO3 plus the iron chelators DFO or DFP for 14 days. Cells were counted biweekly at the time of media changes. Compared with TPO3, ELT6 significantly stimulated cell growth (C), whereas ELT30 suppressed cell growth (D), similarly to DFO100 or DFP100 (E). Data shown represent the mean ± standard deviation (SD) of 4 independent cultures. **P < .01; ***P < .001.
Dose-dependent iron-chelating effects of ELT on megakaryopoiesis. (A) The iron-chelating effects of ELT were evaluated using the calcein iron assay in K562 cells. Free calcein fluorescence increased as intracellular free iron decreased in response to ELT in a dose-dependent manner. (B) ΔFluorescence, calculated as the maximal calcein fluorescence minus the fluorescence with a specific treatment, was used to reflect the intracellular LIP, which decreased with increasing ELT concentrations. Thirty µM ELT always induced the highest calcein fluorescence, which was used as maximal fluorescence for these calculations. Shown are the results for CB-MKs treated with ELT (n = 4), K562 cells treated with ELT (n = 3), and K562 cells treated with the intracellular iron chelator DFP (n = 3). (C-E) CB-CD34+ cells were cultured with TPO3 alone, TPO3 plus the indicated concentrations (µM) of ELT, or TPO3 plus the iron chelators DFO or DFP for 14 days. Cells were counted biweekly at the time of media changes. Compared with TPO3, ELT6 significantly stimulated cell growth (C), whereas ELT30 suppressed cell growth (D), similarly to DFO100 or DFP100 (E). Data shown represent the mean ± standard deviation (SD) of 4 independent cultures. **P < .01; ***P < .001.
High doses of ELT or iron chelators inhibit MK differentiation and expansion
To test whether the toxic effects of ELT30 on megakaryopoiesis could be reproduced by iron chelators, CB-CD34+ cells were cultured with TPO3 alone or TPO3 plus ELT (6 and 30 µM), DFO, or DFP (6, 30, and 100 µM) for 14 days. TPO at concentrations that can be found in patients with hyporegenerative thrombocytopenias (3 ng/mL) was added to all cultures to mimic the clinical circumstances of patients treated with ELT, who have variable levels of plasma TPO. As seen in Figure 1C, ELT6 stimulated cell growth to a final level 2.4-fold above TPO3 alone (P < .01), whereas ELT30 (Figure 1D) suppressed cell expansion and progressively reduced the number of cells in culture (P < .0001). A similar inhibitory effect was observed in response to DFO100 or DFP100 (Figure 1E; P < .0001 vs TPO3), confirming that high doses of iron chelators could suppress megakaryopoiesis.
Next, we assessed whether ELT or other iron chelators affected MK differentiation. As shown in Figure 2A-B, the percentage of CD34+/CD41– cells present after 7 days of culture was significantly increased by ELT30 (63.0 ± 3.2% vs 23.7 ± 9.9% in TPO3 plus ELT30 vs TPO3 alone; P = .0004), an effect that was reproduced by DFO100 and DFP100. This relative increase in undifferentiated progenitors was accompanied by a significant decrease in the percentage of CD34−/CD41+ cells (P < .0001 vs TPO3). In regard to actual cell numbers, high concentrations of ELT, DFO, or DFP reduced all cell populations (reflecting the reduced overall cell expansion) compared with cultures with TPO3 only. However, the magnitude of this effect varied in different cell populations, with more pronounced reductions observed on CD34+/CD41+ and CD34−/CD41+ cells compared with undifferentiated CD34+/CD41− cells (P < .001 for ELT, DFO, and DFP) (Figure 2C).
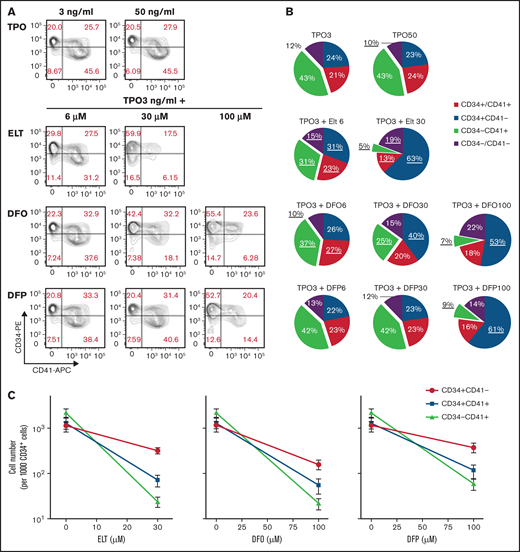
Effects of ELT and iron-chelators on MK differentiation. MK differentiation was analyzed at day 7 of culture, under the same conditions as in Figure 1. (A) Results of a representative experiment showing the flow cytometric analysis of CD34 expression (y-axis, PE) and CD41 expression (x-axis, APC) in cells under the culture conditions shown. (B) Pie charts showing the distribution of cell populations based on CD34 and CD41 surface expression on day 7 of culture with TPO alone or TPO3 plus escalating concentrations of ELT, DFP, or DFO. Values shown represent the means of 6 independent experiments. Underlined values are significantly different from those obtained in cultures with TPO3 alone (P < .05). (C) Absolute cell numbers for each population under the different culture conditions were calculated based on cell counts and percentages obtained on day 7. Although all cell populations decreased in cultures containing high doses of ELT of iron chelators, the effects were more pronounced on cells expressing CD41, indicating MK commitment. Values shown in panels B and C represent the means ± SD of 6 independent experiments.
Effects of ELT and iron-chelators on MK differentiation. MK differentiation was analyzed at day 7 of culture, under the same conditions as in Figure 1. (A) Results of a representative experiment showing the flow cytometric analysis of CD34 expression (y-axis, PE) and CD41 expression (x-axis, APC) in cells under the culture conditions shown. (B) Pie charts showing the distribution of cell populations based on CD34 and CD41 surface expression on day 7 of culture with TPO alone or TPO3 plus escalating concentrations of ELT, DFP, or DFO. Values shown represent the means of 6 independent experiments. Underlined values are significantly different from those obtained in cultures with TPO3 alone (P < .05). (C) Absolute cell numbers for each population under the different culture conditions were calculated based on cell counts and percentages obtained on day 7. Although all cell populations decreased in cultures containing high doses of ELT of iron chelators, the effects were more pronounced on cells expressing CD41, indicating MK commitment. Values shown in panels B and C represent the means ± SD of 6 independent experiments.
Iron status influences MK differentiation and cell expansion in response to high dose ELT
Next, we tested whether iron availability in the culture influenced MK differentiation and cell expansion in response to high ELT concentrations. To assess this, we generated iron-depleted, iron-deficient, and iron-replete MK cultures by using different ratios of APO (iron-free) to HOLO (iron-saturated) in the culture medium and evaluated cell number and MK differentiation after 7 days of culture in the presence of TPO3 plus escalating concentrations of ELT. As seen in Figure 3A-B, increased iron (HOLO%) in the culture had opposite effects on different cell populations; it significantly decreased the percentage of CD34+/CD41− cells but increased the percentage of CD34−CD41+ cells (P < .0001 for overall effects of HOLO% on both cell populations), and these effects were most pronounced at the highest concentration of ELT (P < .04 and P < .03, respectively, for ELT/iron interaction; Figure 3A). When evaluating cell number rather than percentage, increased iron availability in the cultures significantly increased the numbers of CD34+CD41+ and CD34−/CD41+ cells generated at all ELT concentrations (P < .001 for both), indicating a significant effect of iron on the response of these cells (but not CD34+/CD41− cells) to ELT in vitro (Figure 3C). If cells cultured with ELT30 for 7 days were allowed to grow an additional 7 days with TPO3 in the absence of ELT, the cell expansion improved following removal of ELT. The ultimate cell expansion was influenced by iron availability throughout the culture period (supplemental Figure 3).

Iron status influences early MK differentiation and expansion in response to ELT. CB CD34+ cells were cultured in conditions of iron depletion (0% HOLO), iron deficiency (10% HOLO), and iron repletion (100% HOLO) and with TPO plus different ELT concentrations. Cell number and differentiation were analyzed on culture-day 7 by flow cytometry. (A) Representative results of flow cytometric analysis of CD34 (y-axis, PE) and CD41 expression (x-axis, APC) in cells cultured with TPO3 plus ELT30 and various levels of iron availability, showing increased CD41 differentiation with increased iron availability. (B) Distribution of cell populations based on CD34 and CD41 surface expression on day 7 of culture with TPO3 plus escalating concentrations of ELT. Each line represents different levels of iron availability in culture. (C) Absolute cell numbers of each population were calculated based on cell numbers and percentages and are shown based on ELT concentration and iron status. Each data point reflects the mean ± SD from 6 independent experiments.
Iron status influences early MK differentiation and expansion in response to ELT. CB CD34+ cells were cultured in conditions of iron depletion (0% HOLO), iron deficiency (10% HOLO), and iron repletion (100% HOLO) and with TPO plus different ELT concentrations. Cell number and differentiation were analyzed on culture-day 7 by flow cytometry. (A) Representative results of flow cytometric analysis of CD34 (y-axis, PE) and CD41 expression (x-axis, APC) in cells cultured with TPO3 plus ELT30 and various levels of iron availability, showing increased CD41 differentiation with increased iron availability. (B) Distribution of cell populations based on CD34 and CD41 surface expression on day 7 of culture with TPO3 plus escalating concentrations of ELT. Each line represents different levels of iron availability in culture. (C) Absolute cell numbers of each population were calculated based on cell numbers and percentages and are shown based on ELT concentration and iron status. Each data point reflects the mean ± SD from 6 independent experiments.
To further explore the interaction between iron availability and ELT dose on intracellular iron status during in vitro MK differentiation, we evaluated transferrin receptor protein 1(TfR-1) surface expression (which is upregulated in response to intracellular iron deficiency) in the different cell populations. These studies demonstrated that, in cultures with TPO only, TfR-1 surface expression was significantly upregulated in committed MK progenitors (CD34+/CD41+ and CD34−/CD41+ cells) compared with undifferentiated CD34+/CD41− cells, with the highest TfR-1 levels found in CD34+/CD41+ cells (Figure 4A-B; P < .0001). This upregulation of TfR-1 during MK differentiation was independent of iron availability, as it was observed in iron-replete (100% HOLO), iron-deficient (10% HOLO), and iron-depleted (0% HOLO) cultures containing TPO only (Figure 4B). In each one of these 3 cell types, ELT upregulated surface TfR-1 expression in a dose-dependent manner, supporting a correlation between ELT concentration and intracellular iron deficiency (P < .0001 for ELT effects on all cells) (Figure 4C-D). Furthermore, we found a significant ELT/iron status interaction in committed MK progenitors (P < .001). In CD34+/CD41+ and CD34−/CD41+ cells cultured with ELT6, decreased iron availability increased surface TfR-1 expression in a dose-dependent manner, reflecting the expected relationship between iron availability and intracellular iron status (P = .02 and 0.003, respectively). However, in cells cultured with ELT30 this relationship was reversed, and TfR-1 surface expression was paradoxically lowest in cells cultured in iron-depleted conditions (P ≤ .001 in all 3 cell populations) (Figure 4D). This suggested either an inability to compensate for the severity of iron deficiency under those conditions and/or cell death.
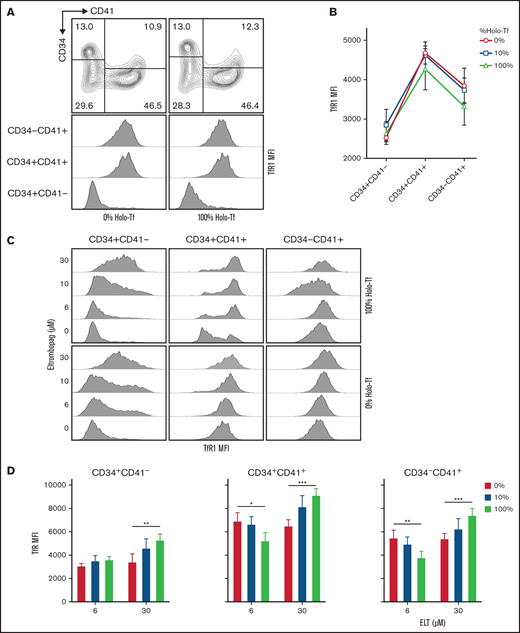
Surface expression of TfR1 is influenced by differentiation status, ELT concentration, and iron availability in culture. The surface expression of TfR1 was determined by FACS at day 7 of culture. (A) Representative flow cytometry results showing the gating strategy and histogram showing the changes in TfR1 expression (MFI) during MK differentiation. (B) TfR1 MFI levels in different cell types based on CD34 and CD41 expression, showing the highest levels in CD34+CD41+ cells. The iron availability in the media in which cells were cultured had a nonsignificant effect on TfR1 expression level. (C) Representative FACS results showing dose-dependent upregulation of TfR1 by ELT in all 3 cell types studied. (D) In CD34+CD41+ and CD34−CD41+ cells treated with ELT6 and ELT30, iron availability had a significant effect: Increased iron reduced TfR1 MFI in cells treated with ELT6, but it had the opposite effect on cells treated with ELT30. Data reflect the mean ± SD from 5 independent experiments. *P < .05; **P < .01; ***P < .001.
Surface expression of TfR1 is influenced by differentiation status, ELT concentration, and iron availability in culture. The surface expression of TfR1 was determined by FACS at day 7 of culture. (A) Representative flow cytometry results showing the gating strategy and histogram showing the changes in TfR1 expression (MFI) during MK differentiation. (B) TfR1 MFI levels in different cell types based on CD34 and CD41 expression, showing the highest levels in CD34+CD41+ cells. The iron availability in the media in which cells were cultured had a nonsignificant effect on TfR1 expression level. (C) Representative FACS results showing dose-dependent upregulation of TfR1 by ELT in all 3 cell types studied. (D) In CD34+CD41+ and CD34−CD41+ cells treated with ELT6 and ELT30, iron availability had a significant effect: Increased iron reduced TfR1 MFI in cells treated with ELT6, but it had the opposite effect on cells treated with ELT30. Data reflect the mean ± SD from 5 independent experiments. *P < .05; **P < .01; ***P < .001.
ELT30 inhibits cell proliferation and induces apoptosis, but only proliferation is rescued by addition of iron
To determine whether the reduced progenitor expansion induced by ELT30 was due to decreased proliferation or to increased apoptosis, we then performed EdU incorporation and TUNEL assays in CD34+cells cultured for 7 days with escalating concentrations of ELT and variable iron availability (Figure 5A-B). These studies revealed significant effects of both iron availability and ELT concentration on the proliferation of all cell types examined and a significant ELT/iron interaction. Specifically, iron status significantly affected the proliferation of CD34+/CD41+ and CD34−/CD41+ cells treated with ELT30, which was markedly reduced in iron-depleted cultures but normalized in iron-containing cultures (P < .0001 for both cell types) (Figure 5C). Interestingly, in CD34+/CD41− cells cultured with TPO only, iron depletion led to significantly higher EdU incorporation compared with iron sufficiency (P = .02), consistent with the hypothesis that intracellular iron deficiency promotes the expansion of undifferentiated progenitor cells.13 (Figure 5C)
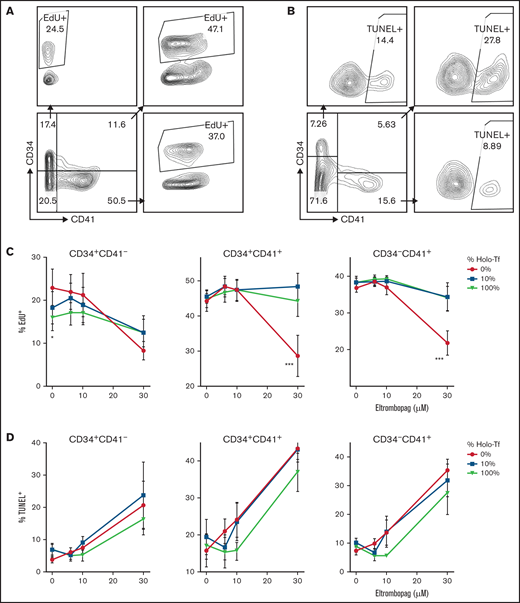
Effects of ELT on cell proliferation and apoptosis. The effects of ELT on cell proliferation and apoptosis were assessed on day 7 of culture using EdU incorporation and TUNEL assays, respectively. (A) Representative FACS density plots showing EdU incorporation in different cell populations. (B) Representative FACS density plots showing the TUNEL+ fraction in different cell populations. (C) In EdU incorporation assays, 30 µM of ELT significantly suppressed the proliferation of CD34+CD41+ and CD34−CD41+ cells cultured in iron-depleted conditions, a finding that was reversed by increased iron availability in culture. In contrast, CD34+/CD41− cells cultured with TPO only had significantly higher EdU incorporation when cultured in iron-depleted conditions. (D) Thirty µM of ELT also induced apoptosis in all 3 cell populations, but increased iron availability did not significantly reduce the level of apoptosis. Data reflect the mean ± SD of 5 independent experiments. *P < .05; ***P < .001.
Effects of ELT on cell proliferation and apoptosis. The effects of ELT on cell proliferation and apoptosis were assessed on day 7 of culture using EdU incorporation and TUNEL assays, respectively. (A) Representative FACS density plots showing EdU incorporation in different cell populations. (B) Representative FACS density plots showing the TUNEL+ fraction in different cell populations. (C) In EdU incorporation assays, 30 µM of ELT significantly suppressed the proliferation of CD34+CD41+ and CD34−CD41+ cells cultured in iron-depleted conditions, a finding that was reversed by increased iron availability in culture. In contrast, CD34+/CD41− cells cultured with TPO only had significantly higher EdU incorporation when cultured in iron-depleted conditions. (D) Thirty µM of ELT also induced apoptosis in all 3 cell populations, but increased iron availability did not significantly reduce the level of apoptosis. Data reflect the mean ± SD of 5 independent experiments. *P < .05; ***P < .001.
ELT also had a significant effect on apoptosis, with ELT30 inducing high levels of apoptosis in all cell 3 cell types. Unlike with proliferation, this effect was not completely reversed by increased iron availability in the cultures (although there was a trend with ELT10), and there was no statistically significant ELT/iron interaction on the percentage of apoptotic cells (Figure 5D).
The preexisting iron status of MK progenitors regulates their proliferation and expansion in response to ELT
Because iron status and ELT dose during early MK differentiation impacted the survival and proliferation of committed MK progenitors to a greater extent than those of undifferentiated progenitors (CD34+/CD41− cells), we then hypothesized that the iron status of already differentiated CD41+ cells would significantly influence their response to ELT during the period of fastest cell expansion in culture, between 7 and 10 days. To test this, we generated iron-depleted, iron-deficient, and iron-replete MK progenitors by culturing them with different concentrations of HOLO and APO, as described, without ELT. MK iron uptake from HOLO in the culture medium was confirmed by measuring the increase in intracellular LIP by Δ calcein fluorescence following exposure of iron-depleted MKs to increasing concentrations of HOLO (supplemental Figure 4). After 7 days, CD41+ cells cultured with 0%, 10%, and 100% HOLO exhibited similar degrees of expansion and differentiation (data not shown). Next, these cells were cultured for an additional 72 hours in the presence of TPO3, TPO3 plus ELT6, or TPO3 plus ELT30 while remaining in the same media with variable iron concentrations. As hypothesized, both ELT dose and iron status had significant effects on the expansion of CD41+ cells, with a significant ELT/iron status interaction (P = .004). At both ELT concentrations tested, improved iron status was significantly correlated with increased CD41+ cell expansion (P = .01 and P < .0001 for ELT6 and ELT30, respectively). The best cell expansion was achieved in cultures with TPO3 plus ELT6 and 100% HOLO (Figure 6A). Consistently, iron status had a profound effect on CD41+ cell proliferation under all culture conditions, with iron-depleted cultures exhibiting significantly lower percentages of EdU+ cells compared with iron-sufficient cultures (P < .001 for all) (Figure 6B-D). The percentage of apoptotic MKs, on the contrary, was only increased in iron-depleted cultures with ELT30 and decreased to baseline in iron-replete cultures (mean ± standard error of the mean, 36.6 ± 3.7% vs 8.5 ± 3.7%, respectively; P < .0001) (Figure 6C).
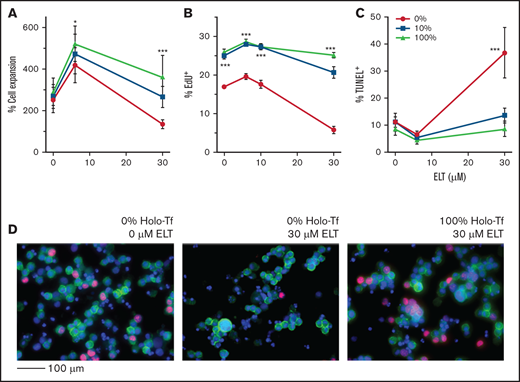
ELT concentration and iron status influence the proliferation and apoptosis of committed MK progenitors. For these studies, CD34+cells were cultured for 7 days in iron-depleted, iron-deficient, and iron-replete conditions with 50 ng/mL of TPO to generate committed MK progenitors with variable iron status. At the end of 7 days, cells (mostly committed MK progenitors) were cultured for an additional 3 days in the same media but supplemented with TPO3 and escalating ELT concentrations. (A) Cell expansion improved with improved iron status and was maximal in cells preloaded with iron and cultured with ELT6. (B) Iron deficiency significantly reduced cell proliferation at all ELT concentrations but most strikingly in cells cultured with ELT30. (C) Treatment with ELT30 for 3 days significantly increased MK apoptosis in iron-depleted cells. This effect was attenuated in cells with improved iron status. (D) Representative images of EdU incorporation assays after FACS analysis: 0% HOLO and 0 µM ELT (left), 0% HOLO and 30 µM ELT (middle), and 100% HOLO and 30 µM ELT (right). EdU+ cells were identified by their red nuclear staining. CD41 was labeled in green, and DAPI was used for nuclear staining. N = 6 independent experiments. *P < .05; ***P < .001.
ELT concentration and iron status influence the proliferation and apoptosis of committed MK progenitors. For these studies, CD34+cells were cultured for 7 days in iron-depleted, iron-deficient, and iron-replete conditions with 50 ng/mL of TPO to generate committed MK progenitors with variable iron status. At the end of 7 days, cells (mostly committed MK progenitors) were cultured for an additional 3 days in the same media but supplemented with TPO3 and escalating ELT concentrations. (A) Cell expansion improved with improved iron status and was maximal in cells preloaded with iron and cultured with ELT6. (B) Iron deficiency significantly reduced cell proliferation at all ELT concentrations but most strikingly in cells cultured with ELT30. (C) Treatment with ELT30 for 3 days significantly increased MK apoptosis in iron-depleted cells. This effect was attenuated in cells with improved iron status. (D) Representative images of EdU incorporation assays after FACS analysis: 0% HOLO and 0 µM ELT (left), 0% HOLO and 30 µM ELT (middle), and 100% HOLO and 30 µM ELT (right). EdU+ cells were identified by their red nuclear staining. CD41 was labeled in green, and DAPI was used for nuclear staining. N = 6 independent experiments. *P < .05; ***P < .001.
Because we had previously observed that the increased apoptosis of MK progenitors induced by ELT30 was not reversed by the presence of iron in the cultures (Figure 5D), we hypothesized that these differences could be due to the different lengths of exposure to high doses of ELT (7 days vs 3 days). Indeed, whereas the apoptotic effects were reversed by iron in MKs with shorter exposure times (Figure 6C), CD41+ cells cultured with ELT30 for a longer time (6 days vs 3 days) exhibited significantly higher levels of apoptosis, which were partially but not fully reversed by increased iron availability in the cultures (60.5 ± 3.3% vs 38.9 ± 3.3% in ELT30 cultures with 0% HOLO vs 100% HOLO, respectively) (supplemental Figure 5A-B).
Based on observations in proximal renal tubular cells, in which iron chelation induced cell death by downregulating the antiapoptotic protein Bcl-xL,14 we then tested the effects of exposure to ELT30 (± iron depletion) for up to 3 days on Bcl-xL, the proapoptotic Bak, and caspase 3 protein expression in MKs. As shown in supplemental Figure 5C, these studies showed no significant effect of ELT30 on the levels of these known regulators of apoptosis in MKs.15,16
Iron deficiency limits megakaryopoiesis in response to high TPO concentrations
Based on these findings, we then tested the hypothesis that severe iron deficiency, even in the absence of ELT, would impair megakaryopoiesis in response to stimulation with high TPO concentrations. In these studies, CD34+ cells cultured for 14 days with 50 ng/mL of TPO in iron-depleted conditions (0% HOLO) generated approximately half the number of MKs generated in iron-replete (100% HOLO) cultures (P = .025; Figure 7A,D). This difference was largely due to reduced cell expansion, although there was also a small reduction in the percentage of CD41+ cells in iron-depleted compared with iron-replete cultures (95.8 ± 1.6% vs 91.7 ± 2.6%, P = .013) (Figure 7B). Iron-dependent differences in cell number were evident on culture-days 11 and 14, concordant with the period of fastest proliferation in our culture system, and did not affect MK maturation (measured as CD42b surface expression) (Figure 7C). Cells cultured in the absence of transferrin in the culture medium, presumably leading to extreme intracellular iron deficiency due to an inability to incorporate iron into the cells, failed to expand and exhibited high levels of cell death by light microscopy (Figure 7A,B,D). Addition of ferrous or ferric iron to the cultures lacking transferrin did not rescue megakaryopoiesis (data not shown).
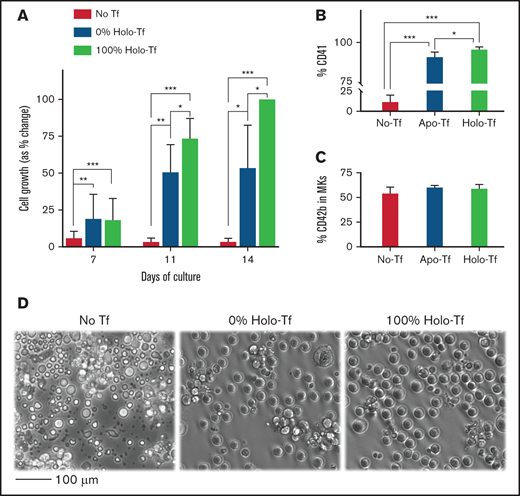
Effects of iron deficiency on in vitro TPO induced megakaryopoiesis. To evaluate the effects of iron deficiency on TPO-induced megakaryopoiesis (in the absence of ELT), CD34+ cells were cultured for 14 days in medium supplemented with either 100% HOLO, 100% APO, or no transferrin and 50 ng/mL of TPO to stimulate maximal proliferation and maturation. (A) Bars display the percentage of cells in every condition and timepoint related to the number of CD41+ cells generated at the end of 14 days in cultures with 100% HOLO (set at 100%). Cell expansion was reduced in cultures containing 0% HOLO compared with those with 100% HOLO, starting on day 11 of culture. (B) The percentage of CD41+ cells was also reduced by iron deficiency, with severe reductions in cultures without transferrin. (C) The maturation of committed MKs, indicated as the percentage of CD42b+ cells in the CD41 positive population, was not influenced by iron status. (D) Shown are representative photomicrographs of cells on day 14 of culture. Cells in 100% APO were reduced in number, and cultures without transferrin exhibited extensive cell death. Images present the average of 4 independent experiments. *P < .05; **P < .01; ***P < .001.
Effects of iron deficiency on in vitro TPO induced megakaryopoiesis. To evaluate the effects of iron deficiency on TPO-induced megakaryopoiesis (in the absence of ELT), CD34+ cells were cultured for 14 days in medium supplemented with either 100% HOLO, 100% APO, or no transferrin and 50 ng/mL of TPO to stimulate maximal proliferation and maturation. (A) Bars display the percentage of cells in every condition and timepoint related to the number of CD41+ cells generated at the end of 14 days in cultures with 100% HOLO (set at 100%). Cell expansion was reduced in cultures containing 0% HOLO compared with those with 100% HOLO, starting on day 11 of culture. (B) The percentage of CD41+ cells was also reduced by iron deficiency, with severe reductions in cultures without transferrin. (C) The maturation of committed MKs, indicated as the percentage of CD42b+ cells in the CD41 positive population, was not influenced by iron status. (D) Shown are representative photomicrographs of cells on day 14 of culture. Cells in 100% APO were reduced in number, and cultures without transferrin exhibited extensive cell death. Images present the average of 4 independent experiments. *P < .05; **P < .01; ***P < .001.
Similarly, CB CD34+ cells cultured for 14 days in media with variable iron availability and ELT6 or ELT30 demonstrated a reduction in the percentage of CD41+ cells in iron-deficient cultures containing ELT30. Cells cultured with ELT30 also had reduced percentages of CD42b+ cells compared with ELT6 cultures (independent of iron availability), but there were no significant differences in MK ploidy (supplemental Figure 6).
Finally, we hypothesized that the reduced proliferation and differentiation of MKs under conditions of iron deficiency would be at least partially due to decreased TPO and/or ELT signaling. To test this hypothesis, we cultured MKs in iron-sufficient (100% HOLO) or iron-depleted (100% APO) conditions and, after overnight starvation, stimulated them with escalating concentrations of TPO or ELT and examined the phosphorylation of ERK1/2 and STAT1 (downstream of JAK-2) by western blot. These studies showed that iron deficiency negatively affects the phosphorylation of both ERK1/2 and STAT1 in response to TPO or ELT stimulation (supplemental Figure 7).
Discussion
This study found that, at clinically achievable concentrations,17 the thrombopoietic agent ELT has dose-dependent contrasting effects on human TPO-induced megakaryopoiesis. At lower concentrations (≤6 µM, 2.7 µg/mL), ELT stimulated megakaryopoiesis, as shown in prior studies.18 At higher concentrations (30 µM, 13.2 µg/mL), however, ELT impaired MK differentiation and cell expansion through both a reduction of proliferation and an increase in apoptosis. The observation that ELT concentrations >10 µM did not support the survival and proliferation of CB hematopoietic progenitor cells in vitro was also consistent with a previous study,3 although the mechanisms mediating this finding were so far unknown.
ELT has structural homology with Fe chelators and suppresses leukemic cell proliferation by decreasing intracellular iron. This was initially observed in malignant cells and was thought to represent a selective anticancer effect.4 In more recent studies, however, functionally relevant iron-chelating effects were reported in cardiomyocyte cell lines,5 osteoclasts,6 neonatal hippocampal neurons,7 and human cytomegalovirus.19 Depending on the specific cell type and clinical situation, the iron-chelating effects of ELT could be either clinically beneficial (as for cardiomyocytes in clinical conditions associated with iron overload) or detrimental (such as for neonatal neurons).
In the hematopoietic system, a recent study demonstrated that ELT led to a reduction in the LIP of human and murine hematopoietic stem cells (HSCs), which induced a molecular reprogramming that enhanced HSC self-renewal and increased the numbers of HSCs and multipotent progenitor cells.13 This effect on HSCs, which was elegantly shown to be independent of the TPO receptor and related to iron chelation, is likely to be an important mechanism responsible for the beneficial effects of ELT on multilineage hematopoiesis in patients with acquired bone marrow failure syndromes and might contribute to the persistence of positive effects of ELT even after its discontinuation.
Consistent with the study by Kao et al, we also observed an increased percentage of CD34+CD41− (uncommitted progenitor) cells in response to increasing concentrations of ELT (Figure 2). This finding was reproduced by escalating concentrations of the iron chelators DFO and DFP in the cultures, supporting the role of iron chelation as the key mechanism. However, in our liquid culture system this increased percentage of uncommitted progenitor cells was accompanied by a significant reduction in the percentage and absolute number of CD41+ cells, representing committed MK progenitors, in response to the highest ELT concentration.
Using a combination of EdU and TUNEL assays, we demonstrated that the reduced cell number by culture-day 7 was due to a combination of reduced proliferation and increased apoptosis, which was most pronounced in CD34+CD41+ cells. In a culture system with tight control over iron availability, the marked reduction in proliferation observed with ELT30 was consistently reversed by increased iron availability (Figures 5C and 6B), indicating that the reduced proliferation in response to high ELT concentrations was caused by intracellular iron deficiency and was influenced by the iron status of the cell. The increased apoptosis, in contrast, was influenced by treatment dose and duration and, unlike EdU incorporation, was not completely reversed by increased iron in the culture if the exposure to ELT30 was longer than 3 days. Because our culture system undergoes media changes every 3 days, this could be the result of cumulative uptake of ELT by the cells, with each media change leading to increasingly worse intracellular iron depletion and apoptotic cell death. Alternatively, the mechanisms through which ELT induced apoptosis in our system may be different from those that suppress proliferation and not necessarily related to its iron-chelating properties. Unlike in proximal renal tubular cells, however, in which iron chelation induces cell death by downregulating the antiapoptotic protein Bcl-xL,14 we found no changes in the protein expression levels of Bcl-xL, the proapoptotic Bak, or caspase 3 following exposure of MKs to ELT30 (± iron depletion) for up to 3 days (supplemental Figure 5C).
The ELT concentrations we used in our cultures were within the range achieved clinically. For adults with ITP, the highest recommended dose is 75 mg/d, but higher doses (up to 150 mg/d) are used in patients with aplastic anemia.20 In small children (1-5 years), the mean dose used in the PETIT2 trial was 1.7 mg/kg per day,2 which is equivalent to 127.5 mg/d in a 75 kg adult. In pharmacokinetic studies, healthy adults who received a single 75 mg oral dose of ELT achieved peak concentrations of 10.9 (8.68-13.6) µg/mL,21 and healthy adult volunteers taking 100 mg/day of ELT for 5 days achieved a peak serum concentration of 14.9 (11.0-20.8) µg/mL.17 These are comparable to the highest ELT concentration we tested (30 µM), which is equivalent to 13.3 µg/mL.
In clinical trials, these concentrations typically raise platelet counts, and studies so far have not shown any evidence of dose-dependent negative effects of ELT on megakaryopoiesis. This may reflect the fact that the highest doses of ELT are frequently used in patients with aplastic anemia, who are typically iron overloaded as a result of chronic red cell transfusions and likely benefit from the iron-chelating effects of ELT without becoming iron-depleted22 and from the iron chelation-induced increased numbers of HSCs.13 Patients with ITP, in contrast, usually respond to lower doses, which effectively stimulate megakaryopoiesis.
Iron deficiency, which is highly prevalent among children and women of childbearing age in low-income settings, is most commonly associated with thrombocytosis rather than thrombocytopenia. In a recent study using genetic and dietary murine models of iron deficiency that develop anemia and thrombocytosis, Xavier-Ferrucio et al found that iron deficiency in the bone marrow environment induced decreased proliferation of megakaryocyte-erythroid progenitors (MEPs) accompanied by a bias of these MEPs toward the MK lineage at the expense of bipotent or erythroid-committed progenitors. This MK commitment bias was secondary to a MEP molecular reprogramming characterized by decreased ERK signaling, downregulation of MAPK/ERK target genes, and altered metabolic pathways such as asparagine and cholesterol biosynthesis and b-alanine degradation.23 Consistent with reports that vascular endothelial growth factor is elevated in iron deficiency,24 the investigators also showed that vascular endothelial growth factor stimulation decreased phospho-ERK in murine MEPs to levels similar to those seen in their models. Taken together, these findings suggested that low iron in the bone marrow environment affects MEP metabolism, slows proliferation, causes lower ERK phosphorylation, and biases cell commitment toward the MK lineage.23 Of note, this molecular reprogramming seems to occur in vivo in response to signals from an iron-deficient bone marrow environment because decreasing the iron content in the culture medium in vitro markedly impaired MEP survival without reproducing the MK bias, similar to our findings.23 Prior studies also demonstrated that the thrombocytosis observed in iron-deficiency anemia is independent of TPO and its receptor.25
ELT is a potent extracellular and intracellular iron chelator, and its use in children and adults with ITP (particularly in low-resource settings) has been associated with the development of iron-deficiency anemia in treated patients.26,27 However, the interaction between iron deficiency and ELT responses has never before been systematically investigated. Our data suggest that iron is essential for the rapid proliferation of MK progenitors in response to high ELT concentrations as well as for optimal responses to high TPO concentrations. Furthermore, we found that iron-deficient MKs exhibited decreased ERK1/2 and STAT1 phosphorylation in response to stimulation with TPO or ELT, providing a potential mechanism for the decreased MK progenitor proliferation in response to these thrombopoietic agents (supplemental Figure 7). In contrast to hematopoietic stem and multipotent progenitor cells, which expand in conditions of iron deficiency, committed MK progenitors (CD34+CD41+ cells) seem to be most sensitive to the deleterious effects of severe iron deficiency, particularly under stimulatory conditions. This is not surprising because these are the cells with the highest proliferative rate in our MK cultures as evidenced by their high percentage of EdU+ cells (Figure 5C) and high baseline surface expression of TfR-1 (also a marker of rapidly cycling cells) (Figure 4B). Iron is a cofactor for over 398 human proteins, many of which are involved in vital biological processes (beyond hemoglobin and oxygen transport in red cells), such as cytochromes in the mitochondrial respiratory chain and ribose nucleotide reductase in DNA replication. The association and dissociation of iron from these proteins is a dynamic process, and a strong iron chelator can interfere with their biological functions by removing iron from otherwise fully formed proteins, by inhibiting its incorporation during protein synthesis, or by altering the iron redox state.28 The biological consequences of iron chelation are likely determined by the most vulnerable processes in the cells of interest. In our study, DNA replication, measured by the EdU incorporation assay, was significantly reduced in the most rapidly proliferating cells when exposed to high ELT concentration and very limited iron availability, and was reversed by increased iron.
Consistent with this observation, several case reports and case series in the literature have reported thrombocytopenia in children with very severe Fe deficiency, which resolved with Fe administration.29–33 More recently, 2 independent groups reported series of adult patients, mostly females, who presented with severe iron deficiency and thrombocytopenia (sometimes diagnosed as steroid-unresponsive ITP), which resolved following IV iron administration or red blood cell transfusion.8,9 A different group reported 2 patients with iron deficiency-associated thrombocytopenia who were differentiated from patients with ITP by their low immature platelet fraction, indicating decreased platelet production as the mechanism underlying the thrombocytopenia.34 Interestingly, patients carrying a TfR-1 mutation that interferes with iron uptake into the cells also presented with moderate thrombocytopenia, suggesting a previously unrecognized need for iron and transferrin for normal platelet production.35 Taken together, these observations support the hypothesis that although mild or moderate iron deficiency leads to thrombocytosis (likely through a combination of hematopoietic stem cell and multipotent progenitor expansion13 and MEP reprogramming toward MK commitment23 ), severe iron deficiency can cause thrombocytopenia by limiting the proliferative rate of committed MK progenitors, particularly in response to stimulation by TPO or ELT.
We recognize that our study has limitations. First, this was an in vitro study and therefore did not incorporate the full complexities of the in vivo environment. Second, ELT is also a calcium chelator, and this could have contributed to our findings, particularly to the effects of ELT on apoptosis that seem to be at least in part independent of iron. However, the contribution of iron chelation to our observations was corroborated by use of other more iron-specific chelators like DFO and DFP. Third, although this study focused on the effects of ELT and/or iron deficiency on early MK differentiation and proliferation, it is also possible that iron deficiency might affect MK size and ploidy25,36 or proplatelet formation. We did not observe significant differences in the ploidy levels of MKs cultured with ELT6 or ELT30 and different degrees of iron deficiency. However, we used CB CD34+ cells as a source of MKs, and it is known that neonatal MKs do not increase their ploidy in response to increased demand or thrombopoietic stimulation.37-39 Thus, it is possible that adult MKs could increase MK ploidy under conditions of iron deficiency as some studies have suggested.25,36 Nevertheless, to our knowledge this is the first study to evaluate the interaction between iron status and the responses of human MKs to ELT and TPO. Our findings support the hypothesis that iron deficiency can stimulate certain cells and steps in the process of megakaryopoiesis while limiting others and suggest that the severity of the iron deficiency and the degree of thrombopoietic stimulation influence the ultimate thrombopoietic output. The varied clinical manifestations of iron deficiency on platelet counts might reflect this delicate balance in individual patients, with our observations providing a potential mechanistic explanation for the relatively uncommon occurrence of thrombocytopenia associated with severe iron deficiency. Further studies are needed to clarify how megakaryopoiesis and thrombopoiesis, iron deficiency, iron repletion, and stimulation with ELT are clinically interrelated.
Acknowledgment
Grant supporting the writing of this paper: NIH P01 HL046925.
Authorship
Contribution: Z.-J.L. and E.D. designed and performed most of the experiments, analyzed results, generated the figures, and wrote the manuscript; H.E.R., B.P., and E.V. performed experiments and reviewed the manuscript; N.C., J.P., M.G., and J.B. contributed to the design of experiments, critically reviewed the data, edited the manuscript, and approved of the final submission; H.A.F. performed the statistical analysis; and M.S.-V. designed the studies, interpreted the data, and wrote the paper.
Conflict-of-interest disclosure: The authors declare no competing financial interests.
Correspondence: Martha Sola-Visner, Division of Newborn Medicine, Boston Children’s Hospital, 300 Longwood Ave, Enders 961, Boston, MA 02115; e-mail: martha.sola-visner@childrens.harvard.edu.

