

Key Points
5-hydroxymethylcytosine and TET2 messenger RNA (mRNA) downregulation are common in myelodysplastic syndromes irrespective of TET2 mutations.
TET3 mRNA expression levels are associated with distinct clinical outcomes in myelodysplastic syndromes with and without TET2 mutations.
Abstract
Decrease in DNA dioxygenase activity generated by TET2 gene family is crucial in myelodysplastic syndromes (MDS). The general downregulation of 5-hydroxymethylcytosine (5-hmC) argues for a role of DNA demethylation in MDS beyond TET2 mutations, which albeit frequent, do not convey any prognostic significance. We investigated TETs expression to identify factors which can modulate the impact of mutations and thus 5-hmC levels on clinical phenotypes and prognosis of MDS patients. DNA/RNA-sequencing and 5-hmC data were collected from 1665 patients with MDS and 91 controls. Irrespective of mutations, a significant fraction of MDS patients exhibited lower TET2 expression, whereas 5-hmC levels were not uniformly decreased. In searching for factors explaining compensatory mechanisms, we discovered that TET3 was upregulated in MDS and inversely correlated with TET2 expression in wild-type cases. Although TET2 was reduced across all age groups, TET3 levels were increased in a likely feedback mechanism induced by TET2 dysfunction. This inverse relationship of TET2 and TET3 expression also corresponded to the expression of L-2-hydroxyglutarate dehydrogenase, involved in agonist/antagonist substrate metabolism. Importantly, elevated TET3 levels influenced the clinical phenotype of TET2 deficiency whereby the lack of compensation by TET3 (low TET3 expression) was associated with poor outcomes of TET2 mutant carriers.
Introduction
TET2 and the highly homologous TET1 and TET3 genes are the only known DNA dioxygenases catalyzing the conversion of 5-methylcytosine (5-mC) to 5-hydroxymethylcytosine (5-hmC).1 Because of the inability of methyltransferases to recognize 5-hmC during DNA replication, TET enzymes can be considered as demethylases. Hematopoietic stem and progenitor cells (HSPCs) express ubiquitous levels of TET2 and TET3 while expressing very low levels of TET1.2 Although TET2 is a bona fide tumor suppressor gene and its hypomorphic mutations lead to HSPCs clonal expansion, a minimal dioxygenase function appears essential for survival and for maintaining proliferative advantage.3–7 This notion is also supported by murine models showing lethality of triple knockouts (KOs) (Tet1/2/3).8,9 Indeed, the effects of a double deletion of TET genes during early embryogenesis are considerably more marked than those derived from the ablation of individual genes (either Tet1 or Tet3). Although loss of individual Tet1 and Tet2 in mice is compatible with life, suggesting a compensatory effect of TET genes during embryogenesis, deletion of Tet3 leads to neonatal lethality.10 Tet1/3 double-KO 8-cell embryos manifest with a loss of 5-hmC and gain of 5-mC, indicating that Tet1 and Tet3 are primary contributors to oxi-mC generation during early development.11 Additional studies have shown that Tet1/2 double-homozygous mutant mice survive into adulthood.12 However, loss of both enzymes leads to a hypermethylation phenotype and compromises genetic imprinting. In particular, we previously demonstrated that TET2 deletion caused proliferative advantage of K562 over control cells, and further deletion of either TET1 or TET3 led to a significant reduction of global 5-hmC, parallel to a severe cellular growth impairment.3
The high frequency of TET2 mutations in myeloid neoplasia (MN) and the sole function of TET-dioxygenases as 5-hmC hydroxylases emphasize the crucial role of this gene in controlling the fate of HSPCs by epigenetic regulation of lineage-commitment and self-renewal programs, including differentiation and skewing of monocytic lineage.8,9 Indeed, our group has recently published on the beneficial effect of a TET-selective small molecule inhibitor blocking the clonal outgrowth of TET2 mutant cells.3
TET2 mutations are also frequent in clonal hematopoiesis of indeterminate potential (CHIP) and may represent an adaptive response of the immune system to age-related attrition of HSPC compartment.13,14 The clinical course of CHIP carriers suggests that TET2 hits are weak drivers, a conclusion also supported by the lack of impact of TET2 mutations on survival and progression-free survival in myelodysplastic syndrome (MDS).13–17 However, the inability to assign clinical significance to TET2 lesions may be linked to the interdependencies of TET2 activity with posttranslational mechanisms, substrate, or substrate antagonist availability and expression level of TET2 itself vs TET3 compensation for mutational loss-of-activity. In addition, various studies suggest that a decrease in 5-hmC levels is by far more widely spread than TET2 lesions, and thus other pathways may affect TET2 activity, obscuring a precise determination of its clinical impact within prognostic schemes.6,18–20 Although some of these are well known (eg, IDH1/2 mutations), others (yet unknown indirect effects) need to be uncovered. Because neither TET2 lesions nor low 5-hmC levels impact survival outcomes,15,16 we aim to clarify some of the pathways explaining a widespread deficiency of 5-hmC in MDS and better resolve the prognostic impact of TET2-deficiency by analyzing factors that may mitigate the functional consequences of TET2 mutations.
Methods
Patients
Ethics approval and patients’ consent to participate in the study were approved by the institutional review boards of the Cleveland Clinic Foundation and the Munich Leukemia Laboratory. All procedures were carried out in accordance with guidelines set forth by the Declaration of Helsinki. Written informed consent was obtained from all patients. Patient specimens were collected according to the Declaration of Helsinki and protocols approved by the internal review boards of participating organizations. Details on genomic studies and characteristics of the patients have been previously reported18–23 (supplemental Material; supplemental Table 1).
RNA-sequencing
Total RNA was isolated from bone marrow (BM) specimens and processed with TruSeq Total Stranded RNA library preparation kit (Illumina). Paired-end reads of 100 bp were sequenced by a NovaSeq 6000 with median depth of 50 million reads/sample. Sequences were aligned using STAR (STAR 2.5.0) to the human reference genome hg19 (GRCh37, Ensembl annotation).22 Gene counts were estimated with Cufflinks (v2.2.1) and normalized by applying Trimmed mean of M values normalization method. Data were expressed in log2_CPM values. Results of RNA-sequencing from CD34+ cells of healthy subjects (HC) and MDS were obtained from the Gene Expression Omnibus (accession number GSE63569).
5-mC/5-hmC quantification
Genomic DNA was isolated from BM specimens of MDS patients and HC and processed using high-performance liquid chromatography-tandem mass spectrometry. Determination of 5-mC and 5-hmC of confirmatory cohorts was performed as previously reported.18–20 All data were expressed as ratio of 5-hmC/5-mC (%).
Results and discussion
When we studied the clinical impact of TET2 mutations in a large cohort of patients with MN (supplemental Table 1), no major impact on progression or survival was found in carriers of TET2 lesions (supplemental Figures 1 and 2) including those with biallelic, truncating, or missense mutations as previously reported by our group.17,24,25 However, in a larger cohort of chronic myelomonocytic leukemia, a longer overall survival was found in patients with multiple TET2 mutations as opposed to those with single mutations or wild-type (WT) TET2 and, similarly, in patients harboring truncating vs nontruncating TET2 mutations, demonstrating a possible context-dependent significance in the myelodysplastic syndrome/myeloproliferative neoplasms (MDS/MPN) subtype.26
By using 5-hmC levels as a functional readout of TET activity in a subset of patients, low 5-hmC levels were also encountered in a proportion of WT cases. Moreover, 5-hmC levels were highly variable in TET2 mutants (Figure 1A) beyond the effects expected from the variability of clonal burdens (supplemental Figure 3). This finding was also confirmed through an extensive meta-analysis (n = 598) of previous studies of 5-hmC content in MNs (supplemental Figure 4). Besides posttranslational/translational modifications, which are not studied here, decrease in 5-hmC levels in WT cases could be also explained by transcriptome modifications. Indeed, when we assessed the expression of TET family of genes, MDS patients had lower TET2 mRNA levels in total and in CD34+ cells as compared with HC, irrespective of their TET2 mutational/copy number status (Figure 1B-C), providing one explanation for the decreased 5-hmC levels found also in WT cases. One could speculate that TET2-deficiency is more globally involved in MDS pathogenesis than by the only consideration of the mutant cases fraction. Indeed, “low expressor” status (defined by TET2 expression <25th percentile of HC) was found in 74% of patients. In addition, 5-hmC deficiency could also derive from the inhibition of enzymatic IDH1/2 mutations (Figure 1B-C).
![TET-family of gene dysfunction in myelodysplastic syndromes. (A) Bar plot showing 5-hmC levels (percent of 5-hmc/5-mC) in our internal cohort of patients (n = 81). Levels of statistical significance were assessed by Mann-Whitney U test. *P < .05, ***P < .0001. Pink quadrant indicates median level of expression in the WT cohort. On the right, pie charts representing percentage of patients with TET2 dysfunction (72%) and, among those, cases with TET2 mutations (60%). (B) Scatter plots of TET2 messenger RNA (mRNA) expression levels (log2_CPM). Left panel shows fractionated CD34+ cells of HC and MDS obtained from the Gene Expression Omnibus (accession number GSE63569) (P = .07). Middle panel shows a population of healthy controls (HC, n = 64) and our entire study cohort (MDS/MPN, n = 780). Right panel shows a breakdown of our study cohort (pure deletion4q24 = 13, TET2 mutant [MT] = 203, TET2, WT = 535, IDH MT = 29). Levels of statistical significance were assessed by Mann-Whitney U test. *P < .05, ***P < .0001. Pink quadrant indicates 25% lower percentile level of expression in the HC cohort. (C) Pie charts showing the percentages of patients in our cohort defined as low expressors and the breakdown of causes leading to TET2 dysfunction. (D) Scatter plot showing TET3 mRNA expression levels (log2_CPM) in a cohort of healthy controls (HC, n = 64), all cohort (MDS/MPN, n = 780), and TET2 WT (n = 577). Levels of statistical significance were assessed by Mann-Whitney U test. *P < .05, ***P < .0001. (E) TET3 vs TET2 mRNA expression (log2_CPM) in TET2 WT (n = 577). (F) Linear regression analyses of TET2 and TET3 mRNA expression (log2_CPM) vs TET2 variant allele frequency (n = 203). Variant allele frequency was expressed as percentage.](https://ash.silverchair-cdn.com/ash/content_public/journal/bloodadvances/6/1/10.1182_bloodadvances.2021005418/5/m_advancesadv2021005418f1.png?Expires=1765886211&Signature=m90R2VUgv7bMSN2vSDmnRznGeYgC2BptojLol30oWvql4yLjrrUxeJ8XpFbd09kp8OOkliAvpZ2FXlpN3Rdhh0C1VoAsHz3pnE7zT0Uw2gz9HflKduoEF~Ct7ILCW-nZCq3Sy0fxXEQWveQc8Juo1nuvaOyiVoYpe51y25E6jEtL8UeESzsViGa5Ctjj7o4oqmrwifpxSFT2qodnWPbmH~h6iClOKhJmO6KjRcy~jg4OtN0XOeBIGwY7RQ~uUYb-wGpmOm2mmSTPSQ7J6I-2-vWd71bSjxdDgpy1X4YqvQsMbSsNIUc1yKOXx~ntAt~NoGm1Fz489CPJzlyZEh-isQ__&Key-Pair-Id=APKAIE5G5CRDK6RD3PGA)
TET-family of gene dysfunction in myelodysplastic syndromes. (A) Bar plot showing 5-hmC levels (percent of 5-hmc/5-mC) in our internal cohort of patients (n = 81). Levels of statistical significance were assessed by Mann-Whitney U test. *P < .05, ***P < .0001. Pink quadrant indicates median level of expression in the WT cohort. On the right, pie charts representing percentage of patients with TET2 dysfunction (72%) and, among those, cases with TET2 mutations (60%). (B) Scatter plots of TET2 messenger RNA (mRNA) expression levels (log2_CPM). Left panel shows fractionated CD34+ cells of HC and MDS obtained from the Gene Expression Omnibus (accession number GSE63569) (P = .07). Middle panel shows a population of healthy controls (HC, n = 64) and our entire study cohort (MDS/MPN, n = 780). Right panel shows a breakdown of our study cohort (pure deletion4q24 = 13, TET2 mutant [MT] = 203, TET2, WT = 535, IDH MT = 29). Levels of statistical significance were assessed by Mann-Whitney U test. *P < .05, ***P < .0001. Pink quadrant indicates 25% lower percentile level of expression in the HC cohort. (C) Pie charts showing the percentages of patients in our cohort defined as low expressors and the breakdown of causes leading to TET2 dysfunction. (D) Scatter plot showing TET3 mRNA expression levels (log2_CPM) in a cohort of healthy controls (HC, n = 64), all cohort (MDS/MPN, n = 780), and TET2 WT (n = 577). Levels of statistical significance were assessed by Mann-Whitney U test. *P < .05, ***P < .0001. (E) TET3 vs TET2 mRNA expression (log2_CPM) in TET2 WT (n = 577). (F) Linear regression analyses of TET2 and TET3 mRNA expression (log2_CPM) vs TET2 variant allele frequency (n = 203). Variant allele frequency was expressed as percentage.
TET-family of gene dysfunction in myelodysplastic syndromes. (A) Bar plot showing 5-hmC levels (percent of 5-hmc/5-mC) in our internal cohort of patients (n = 81). Levels of statistical significance were assessed by Mann-Whitney U test. *P < .05, ***P < .0001. Pink quadrant indicates median level of expression in the WT cohort. On the right, pie charts representing percentage of patients with TET2 dysfunction (72%) and, among those, cases with TET2 mutations (60%). (B) Scatter plots of TET2 messenger RNA (mRNA) expression levels (log2_CPM). Left panel shows fractionated CD34+ cells of HC and MDS obtained from the Gene Expression Omnibus (accession number GSE63569) (P = .07). Middle panel shows a population of healthy controls (HC, n = 64) and our entire study cohort (MDS/MPN, n = 780). Right panel shows a breakdown of our study cohort (pure deletion4q24 = 13, TET2 mutant [MT] = 203, TET2, WT = 535, IDH MT = 29). Levels of statistical significance were assessed by Mann-Whitney U test. *P < .05, ***P < .0001. Pink quadrant indicates 25% lower percentile level of expression in the HC cohort. (C) Pie charts showing the percentages of patients in our cohort defined as low expressors and the breakdown of causes leading to TET2 dysfunction. (D) Scatter plot showing TET3 mRNA expression levels (log2_CPM) in a cohort of healthy controls (HC, n = 64), all cohort (MDS/MPN, n = 780), and TET2 WT (n = 577). Levels of statistical significance were assessed by Mann-Whitney U test. *P < .05, ***P < .0001. (E) TET3 vs TET2 mRNA expression (log2_CPM) in TET2 WT (n = 577). (F) Linear regression analyses of TET2 and TET3 mRNA expression (log2_CPM) vs TET2 variant allele frequency (n = 203). Variant allele frequency was expressed as percentage.
Along with variable 5-hmC levels, concomitant differences in TET1/TET3 expression were also observed. TET1 levels were too low to be evaluated in our cohort (supplemental Figure 5), consistent with previous studies demonstrating its role and highest expression levels especially in embryonic stem cells.27 Furthermore, the very low levels of TET1 in hematopoietic cells point toward tissue-specific utilization of TETs dioxygenases, which may be a result of distinct genomic target requirements in different tissues.28,29 Global TET3 expression levels were markedly higher in all cohort and in WT MDS compared with HC (Figure 1D). In addition, TET2/TET3 expression levels were inversely correlated in WT patients, whereas TET2 clonal burden did not influence TET3 expression in mutant cases (Figure 1E-F). We then compared the expression of TET2 and TET3 across all age groups of our cohorts of WT patients and HC and found a decreased TET2 expression and a compensatory upregulation of TET3 expression levels (Figure 2A; supplemental Figure 6), which is in agreement with increasing prevalence and mutational burden with aging (supplemental Figure 7).17 These findings support partially overlapping functions of both genes in determining clinical phenotypes as also indicated by simultaneous KO models of Tet dioxygenase genes.30 Nota bene, analysis of IDH1/2 mutations revealed that these hits were accompanied by a compensatory up-modulation of TET3 but not TET2 mRNA (supplemental Figure 8).
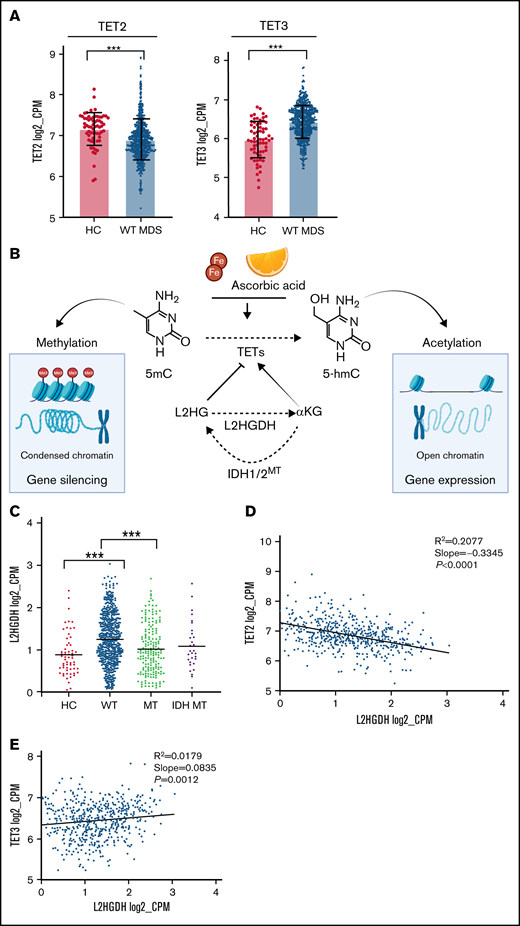
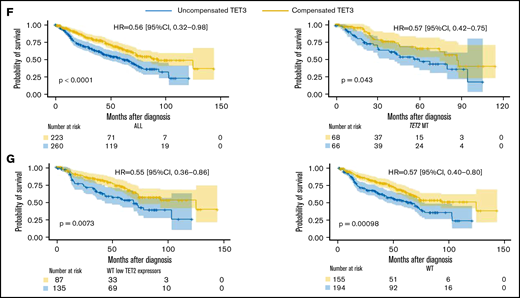
Compensatory mechanism by TET3 expression and correlation with clinical phenotypes. (A) Bar graphs representing TET2 and TET3 expression (log2_CPM) in TET2 WT (n = 577) MDS patients vs healthy controls (HC, n = 64), ***P < .0001. (B) Schematic representation of the role of L-2-hydroxyglutarate (L2HG) and L2HG dehydrogenase (L2HGDH) in cellular TETs function and global methylation status. (C) L2HGDH mRNA expression levels (log2_CPM) in HC (n = 64), TET2 MT (n = 203), IDH MT (n = 35), and TET2 (n = 577). (D-E) TET2 and TET3 vs L2HGDH mRNA expression (log2_CPM) in TET2 WT patients (n = 577). Kaplan-Meier curves estimate the probability of survival of patients stratified according to uncompensated and compensated TET3 (cutoff, median of expression in the entire cohort) in (F) TET2 MTs (right panel) and all cohort (left panel) and (G) WT cases with low TET2 expression (left panel) and all WT cases (right panel). P values and hazard ratios are depicted in the corresponding panels.
Compensatory mechanism by TET3 expression and correlation with clinical phenotypes. (A) Bar graphs representing TET2 and TET3 expression (log2_CPM) in TET2 WT (n = 577) MDS patients vs healthy controls (HC, n = 64), ***P < .0001. (B) Schematic representation of the role of L-2-hydroxyglutarate (L2HG) and L2HG dehydrogenase (L2HGDH) in cellular TETs function and global methylation status. (C) L2HGDH mRNA expression levels (log2_CPM) in HC (n = 64), TET2 MT (n = 203), IDH MT (n = 35), and TET2 (n = 577). (D-E) TET2 and TET3 vs L2HGDH mRNA expression (log2_CPM) in TET2 WT patients (n = 577). Kaplan-Meier curves estimate the probability of survival of patients stratified according to uncompensated and compensated TET3 (cutoff, median of expression in the entire cohort) in (F) TET2 MTs (right panel) and all cohort (left panel) and (G) WT cases with low TET2 expression (left panel) and all WT cases (right panel). P values and hazard ratios are depicted in the corresponding panels.
To further explore whether other factors were associated with low TET2 levels, we studied TET2 expression in WT cases as to the presence of other mutations. We found that TET2 expression was significantly lower in patients harboring solely DNMT3A (P < .0001), SF3B1 (P < .0001), and SRSF2 (P = .04) compared with HC (supplemental Figure 9A). In particular, patients carrying SF3B1 mutations (except for R622) showed significantly lower TET2 expression. Similarly, DNMT3A missense (but not the canonical R882) showed globally decreased TET2 expression (P < .0001) compared with HC (supplemental Figure 9B). However, lack of correlation between levels of TET2 and mutational clonal burden argues against a direct mechanistic relationship (supplemental Figure 9C-D).
Decreased hydroxylation of 5-mC may be not only a result of 2HG-mediated inhibition (IDH1/2 mutant) but also be caused by endogenous L2HG produced via malate shunt (Figure 2B). Accordingly, the levels of L2HGDH catabolizing L2HG and malate dehydrogenases (MDH1/2) supplying L2HG would influence TET2 activity in a reciprocal fashion.31,32 Consistent with the theory that low 5-hmC levels are a ubiquitous feature of MDS, we found that MDH1/2 mRNA expression levels were increased in MDS (supplemental Figure 10) and stipulate that L2HGDH up-modulation may correspond to a compensatory increase also in WT cases to handle elevated L2HG loads (Figure 2C). Moreover, linear regression analyses revealed that L2HGDH levels were correlated inversely with TET2 and positively with TET3 expression in WT cases (Figure 2D-E). These functional relationships indicate that diverse mechanisms can alter 5-hmC/5-mC homeostasis and that TET2/IDH mutational status may predict the ability to counteract L2HG load by increasing L2HGDH activity.31
One important implication of the widespread 5-hmC levels due to various metabolic perturbances is, as for TET2 lesions, the lack of their unequivocal impact on outcomes as shown by previous studies18,19 and our patients. Although these findings do not support the TET3 compensation theory and may raise cautiousness as to the interpretation of our study, it has to be noticed that global 5-hmC levels (oftentimes derived from different methodologies, eg, high-performance liquid chromatography-tandem mass spectrometry, DNA ELISA kits) might not be as reflective of the 5-hmC content of relevant DNA sites. This heterogeneity in 5-hmC levels may be due to either compensation of TET2-deficiency by up-modulation of TET3 or by factors other than mutations that influence 5-hmC in WT cases, as previously reported.33
Our results indicate that elevated TET3 levels compensated TET2 deficiency in terms of clinical outcomes in both univariate and multivariate settings (Figure 2F-G; supplemental Tables 2 and 3). Linear regression analysis provided additional indirect support to our hypothesis by confirming that, indeed, lack of compensation by TET3 (low TET3 expression) was associated with high-risk features (supplemental Figure 11). In this context, one could stipulate that TET3 noncompensated cases may be those whose systems were not quick enough to rebalance the TET2/TET3 equilibrium, unveiling a lack of metabolic plasticity. Indeed, An et al34 showed that acute depletion of TET2/TET3 functions in myeloid progenitors and mature myeloid-lineage cells led to accumulation of DNA damage with impairment of mechanisms of DNA repair. Comutational events in epigenetic modifiers or genes involved in TET metabolism may also play a role in determining compensatory TET3 expression mechanisms. Furthermore, lack of compensatory overexpression of TET3 may be related to inherent characteristics of the MDS populations, which are typically enriched in elderly individuals, less efficiently able to respond to metabolic perturbances. Lastly, previous literature35,36 demonstrated how either a depletion or a forced expression of TET3 impairs HSPCs differentiation, emphasizing the importance of its balanced expression. In MDS, the resulting net cellular activity of TETs (ie, the Δ between the remaining TET2 activity and a well-adjusted TET3 upregulation) determines HSPCs differentiation capabilities.
The inability to subdivide patients with TET2 mutations according to 5-hmC and TET3 expression levels represents a limitation of our study. 5-hmC levels in relation to TET3 compensation status is an important topic that may provide more definitive information with prognostic implications. However, to rigorously establish the compensatory modes, further analysis is needed utilizing protein chemistry and single-cell RNA-sequencing as well as top-down mass spectrometry to identify posttranslational modification of overexpressed TET3 or underexpressed TET2.
Furthermore, the growing body of literature concerning TET2 and its homeostatic regulation of immune responses and pathogenesis of inflammatory diseases (eg, atherosclerosis and CHIP37 ) raises questions as to the possible role of mechanisms other than epigenetic modifications (aging, environmental noxae, or inflammatory stimuli, to name a few) in determining some of the features observed in TET2 mutations or whether these may be primary causes rather than effects.38,39 In particular, the high frequency of TET2 mutations in CHIP and MDS may be the result of a pressure to decrease TET2 expression (eg, via transcriptional repression), thereby conferring a growth advantage over normal HSPCs.
In sum, our results demonstrate that MDS can be considered a generalized 5-hmC deficiency disorder driven by direct or indirect loss of TET2 functions by mutations or down-modulation due to various mechanisms. In fact, TET2 downregulation is a finding that goes beyond the mere presence of TET2 mutations, and TET3 upregulation is a general feature of MDS, possibly compensating the above-mentioned TET2 impairment. Finally, even among TET2 mutant patients, the presence of contra-balanced mechanisms (eg, TET3 compensation) might influence clinical phenotypes and outcomes, enabling the identification of higher-risk patients requiring precision therapeutic approaches. One of the limitations of our study consists of the absence of large-scale data of 5-hmC measurements performed on the same cohort used for RNA-sequencing analysis that, if available, would have allowed us to explore the relationship between 5-hmC levels and transcriptomic profiles of TET1/2/3 genes along with their application in clinical practice. Indeed, future prospective studies including a complete tetrad of data (treatment response, TET2 mutational status, 5-hmC and RNA-sequencing) are warranted to further explore the role of TET3 compensation upon treatment with hypomethylating agents in MDS.
Acknowledgments
The authors thank Cassandra M. Kerr for insightful suggestions. The authors also thank the Edward P. Evans Foundation and the Henry & Marilyn Taub Foundation.
This work was supported by the National Institutes of Health grants R01HL118281, R01HL123904, R01HL132071, and R35HL135795 (J.P.M.); the Aplastic Anemia and Myelodysplastic Syndromes International Foundation (V.V. and J.P.M); the VeloSano Pilot Award; the Vera and Joseph Dresner Foundation for MDS research (V.V.); and the Leukemia and Lymphoma Society grant #6582-20-LLS (B.K.J). C.G. was supported by the American-Italian Cancer Foundation Post-Doctoral Research Fellowship.
Authorship
Contribution: C.G., J.P.M., and V.V. generated and conceived the study design, draw figures, and tables and wrote the manuscript; C.G., S.P., and V.V. performed and analyzed sequencing data; Y.N. performed initial analysis; V.A. and C.E.H. performed initial processing of genomic analyses; H.A., S.K., and M.Z. reviewed clinical data, took part in samples selection, and edited the manuscript; D.F.C., I.R.Z., J.-S.A., H.-J.K., D.D.H.K., M.D.M., and J.H.J. kindly provided data to compile the meta-analysis studies and edited the manuscript; M.M., C.H., and T.H. provided data of gene analyses and edited the manuscript; Y.G. and B.K.J. generated data of 5-hmC of the Cleveland Clinic cohort and provided important feedbacks to the manuscript; and all authors participated in the critical review of the final paper and submission.
Conflict-of-interest disclosure: The authors declare no competing financial interests.
Correspondence: Valeria Visconte, Department of Translational Hematology and Oncology Research, Taussig Cancer Institute, 9620 Carnegie Ave N building, Building NE6-250, Cleveland, OH 44106, e-mail: visconv@ccf.org.

