

Key Points
SETBP1 overexpression activates a HOXA signature and collaborates with FLT3-ITD to drive AML in the absence of class-defining mutations.
AMLs driven by Setbp1 overexpression and Flt3-ITD have several specific genetic vulnerabilities, including Kdm1a and other druggable genes.

Abstract
Advances in cancer genomics have revealed genomic classes of acute myeloid leukemia (AML) characterized by class-defining mutations, such as chimeric fusion genes or in genes such as NPM1, MLL, and CEBPA. These class-defining mutations frequently synergize with internal tandem duplications in FLT3 (FLT3-ITDs) to drive leukemogenesis. However, ∼20% of FLT3-ITD–positive AMLs bare no class-defining mutations, and mechanisms of leukemic transformation in these cases are unknown. To identify pathways that drive FLT3-ITD mutant AML in the absence of class-defining mutations, we performed an insertional mutagenesis (IM) screening in Flt3-ITD mice, using Sleeping Beauty transposons. All mice developed acute leukemia (predominantly AML) after a median of 73 days. Analysis of transposon insertions in 38 samples from Flt3-ITD/IM leukemic mice identified recurrent integrations at 22 loci, including Setbp1 (20/38), Ets1 (11/38), Ash1l (8/38), Notch1 (8/38), Erg (7/38), and Runx1 (5/38). Insertions at Setbp1 led exclusively to AML and activated a transcriptional program similar, but not identical, to those of NPM1-mutant and MLL-rearranged AMLs. Guide RNA targeting of Setbp1 was highly detrimental to Flt3ITD/+/Setbp1IM+, but not to Flt3ITD/+/Npm1cA/+, AMLs. Also, analysis of RNA-sequencing data from hundreds of human AMLs revealed that SETBP1 expression is significantly higher in FLT3-ITD AMLs lacking class-defining mutations. These findings propose that SETBP1 overexpression collaborates with FLT3-ITD to drive a subtype of human AML. To identify genetic vulnerabilities of these AMLs, we performed genome-wide CRISPR-Cas9 screening in Flt3ITD/+/Setbp1IM+ AMLs and identified potential therapeutic targets, including Kdm1a, Brd3, Ezh2, and Hmgcr. Our study gives new insights into epigenetic pathways that can drive AMLs lacking class-defining mutations and proposes therapeutic approaches against such cases.
Introduction
Acute myeloid leukemia (AML) is an aggressive cancer of hematopoietic stem cells (HSCs) that presents abruptly with complications of bone marrow failure.1,>2 Currently, only 30% to 40% of patients survive the disease, and new treatments have had only a modest impact on prognosis.2 Next-generation sequencing studies have unveiled the significant genetic heterogeneity of AML and provided the foundation for a “genomic classification” that can predict outcomes and guide therapeutic choices.3
Mutations in FLT3, the gene for FMS-like tyrosine kinase 3, are found in more than a third of AML cases.2,4 More than 75% are internal tandem duplications (FLT3-ITD) leading to constitutive kinase activation.5 They are late events in AML evolution and synergize with antecedent class-defining mutations, such as chimeric fusion genes and NPM1, MLL, and RUNX1 mutations,2,4 to transform subclinical HSC clones into aggressive leukemia.4,6-9 Interestingly, ∼20% of FLT3-mutant AMLs lack class-defining mutations, with many carrying no other driver mutations of any kind.4 As FLT3 mutations are not able to engender acute leukemia in isolation,10,11 we hypothesized that as yet undefined leukemogenic gene expression programs are activated in these cases by epigenetic/transcriptional mechanisms.
In this study, we used Sleeping Beauty insertional mutagenesis12 (IM) to identify genes and pathways that synergize with FLT3-ITD to drive AML in the absence of class-defining mutations, in a well-validated mouse model of these mutations.11-14 All mutagenized Flt3-ITD mice11 developed acute myeloid leukemia (AML in >80% of cases), with most cases harboring common integration sites (CISs) at 1 of 6 genes: Setbp1, Ets1, Ash1l, Notch1, Erg, or Runx1. Setbp1 insertions were by far the most common (20 of 38 mice) and were invariably associated with AML driven by a gene expression signature similar to, but distinct from, those with mutant NPM1 or MLL gene fusions (Figure 3A).15-17 By analyzing multiple human data sets, we found that human FLT3-ITD AMLs lacking class-defining mutations indeed displayed significantly increased SETBP1 expression, corroborating the interaction between SETBP1 and FLT3-ITD. Collectively, our findings suggest that overexpression of wild-type SETBP1 can operate in place of class-defining somatic mutations to drive a distinct subtype of AML. To identify genetic vulnerabilities in this subtype, we used Flt3ITD/+/Setbp1IM+ AMLs to perform CRISPR-Cas9 recessive screening and identify >100 druggable genes, including Kdm1a, Brd3, Ezh2, and Hmgcr.
Methods
IM
QiSeq.
Quantitative insertion sequencing (QiSeq) was performed as described before.18,19 In brief, eukaryotic transposon direct insert sequencing libraries were generated from sheared leukemic cell DNA and sequenced on Illumina-HiSeq2500.
Identification of common integration sites.
Transposon integrations were mapped to the mouse genome GRCm37 using SSAHA2,20 and common insertion sites were identified by combining Transposon Annotation Poisson Distribution Association Network Connectivity Environment (TAPDANCE)21 (top 25 insertions per tumor/leukemia) and Gaussian kernel convolution (60-kb window) analysis as described before.22-24 CISs located within 2 Mb of the GrOnc donor site on chromosome 19 were discarded, as they likely represented “local hopping.”12 To generate co-occurrence plots for insertions in select genes (Figure 2B; supplemental Figure 1C), all insertions were recovered from FTD-IM leukemias, including those with low read counts. Read counts for each leukemia were normalized to rank them between 0 and 1. Normalized read counts depict the contribution of each insertion within a leukemia.
Insertion validation.
Selected insertions were confirmed by reverse transcription polymerase chain reaction (RT-PCR) and capillary sequencing. Primers amplified from the transposon splice donor to the exon immediately after the insertion. Insertion coordinates and primer sequences are listed in supplemental Table 2.
Generation of stable Cas9 expressing primary cell lines
Primary bone marrow–derived cell lines from leukemia samples 6, 11, and 12 (Figure 2B), harboring activating Setbp1 insertions were transduced with the lentiviral expression construct pKLV2-EF1aBsd2ACas9-W25 (supplemental Figure 6C). After blasticidin selection for 10 days, several stable Cas9-expressing cell lines were established from each of the 3 primary leukemias, starting from single cells. Persistence of the Setbp1 transposon insertions was confirmed by PCR, and Cas9 activity was tested with the lentiviral reporter pKLV2-U6gRNA5(gGFP5)-PGKBFPGFP-W (supplemental Figure 6C-D), as described before.25 Cas9-expressing cell lines from samples 6 and 12 were selected for genome-wide CRISPR screening. Because mouse 12 also harbored a Runx1 transposon insertion (Figure 2F; supplemental Table 4), we confirmed the absence of Runx1 insertions in the derivative cell-line used in CRISPR screening by using QiSeq (supplemental Table 5).
CRISPR dropout screening
Genome-wide dropout screenings were performed on 2 Cas9-expressing clones from the primary leukemic mouse samples 6 and 12 and the hematopoietic progenitor-like HPC7 cell line. Cells 30 × 106 were transduced with our murine v2 lentiviral guide RNA (gRNA) library containing 90 230 gRNAs against 18 424 genes, as described.25,26 Transduced cells were selected with puromycin (1.5 μg/mL; cat. no. P9620; Sigma) for 4 days, kept in culture, harvested every 48 hours from 4 to 30 days after transduction, and sequenced on Illumina HiSeq2500 (supplemental Methods).25 The HPC7 cell line screening was conducted over 15 days. The Model-based Analysis of Genome-wide CRISPR-Cas9 Knockout software was used to identify depleted and enriched genes.27
In vitro validation of dropout genes
See supplemental Methods for details of the procedure.
Leukemia transplants and in vivo validation
To validate leukemogenic potential, 1 × 10⁶ AML cells were injected into the tail veins of sublethally irradiated (500 rad) syngeneic mice. The mice were monitored closely and culled when sick. For in vivo dropout gene validation, 1 × 10⁶ luciferase-expressing Flt3ITD/+/Setbp1IM+;Cas9+ cells transduced with selected lentiviral gRNA28,29 were injected into the tail veins of NOD-SCID mice (supplemental Methods and supplemental Figure 8). Tumor engraftment was monitored weekly for up to 3 months with an IVIS imager after intraperitoneal injection of d-luciferin 150 mg/kg (cat. no. 7903-1G; BioVision).
All animal studies were performed in accordance with the Animals (Scientific Procedures) Act 1986 (United Kingdom) and were approved by the Ethics Committee at the Sanger Institute.
Results
The GrOnc transposon synergizes with Flt3-ITD to drive leukemogenesis
To identify genes and genetic pathways that can co-operate with mutant FLT3 to drive leukemogenesis, we crossed mice carrying a constitutive Flt3-ITDallele (Flt3ITD/+),11 a conditional Sleeping Beauty transposase (Rosa26flox-SB), the bifunctional GrOnc transposon,12 and the HSC-active inducible recombinase transgene Mx1-Cre30 (Figure 1A-B). The following cohorts were generated, pIpC-treated and aged: (1) Mx1-Cre+;Flt3ITD/+ (FTD), (2) Mx1-Cre+;GrOnc+;Rosaflox-SB/+ (WT-IM), (3) Mx1-Cre+;Flt3ITD/+;GrOnc+;Rosaflox-SB/+ (FTD-IM), and (4) Flt3+/+, GrOnc−, and Rosaflox-SB/+ single transgenics (WT controls) (Figure 1B).

IM of Flt3ITD/+mouse HSCs leads to rapid-onset AML. (A) The GrOnc transposon carrying unidirectional gene-activating (Gr1.4 LTR) and bidirectional gene-inactivating or -truncating (βa-SA and En2-SA) elements flanked by repeats for both Sleeping Beauty (SB) and PiggyBac (PB) transposases.12 (B) Mouse breeding scheme. (C) Kaplan-Meier survival curves for the different mouse genotypes, showing significantly decreased survival of FTD vs WT control mice (medians, 103 vs 245 days; P = .0001) and of FTD-IM vs WT-IM mice (medians, 73 vs 103 days; P = .009; Mantel-Cox). (D) Of the leukemias in the mice; most were AMLs (81%). (E) Hematoxylin and eosin–stained spleen histology sections from representative control mice and mice with myeloid and lymphoid leukemia, showing splenic effacement in leukemic samples. Bars represent 250 μm. (F) Representative FTD-IM mouse bone marrow sections stained for MPO, B220, and CD3e. Bars represent 100 μm. (G) Blood cell counts and spleen weights in mice with different genotypes. Mice from the 3 experimental cohorts displayed elevated white blood cell counts, reduced platelet counts, and larger spleen sizes compared with controls. **P < .005; ***P < .0005; 1-way analysis of variance. ns, not significant; RBC, red blood cell count; WBC, white blood cell count.
IM of Flt3ITD/+mouse HSCs leads to rapid-onset AML. (A) The GrOnc transposon carrying unidirectional gene-activating (Gr1.4 LTR) and bidirectional gene-inactivating or -truncating (βa-SA and En2-SA) elements flanked by repeats for both Sleeping Beauty (SB) and PiggyBac (PB) transposases.12 (B) Mouse breeding scheme. (C) Kaplan-Meier survival curves for the different mouse genotypes, showing significantly decreased survival of FTD vs WT control mice (medians, 103 vs 245 days; P = .0001) and of FTD-IM vs WT-IM mice (medians, 73 vs 103 days; P = .009; Mantel-Cox). (D) Of the leukemias in the mice; most were AMLs (81%). (E) Hematoxylin and eosin–stained spleen histology sections from representative control mice and mice with myeloid and lymphoid leukemia, showing splenic effacement in leukemic samples. Bars represent 250 μm. (F) Representative FTD-IM mouse bone marrow sections stained for MPO, B220, and CD3e. Bars represent 100 μm. (G) Blood cell counts and spleen weights in mice with different genotypes. Mice from the 3 experimental cohorts displayed elevated white blood cell counts, reduced platelet counts, and larger spleen sizes compared with controls. **P < .005; ***P < .0005; 1-way analysis of variance. ns, not significant; RBC, red blood cell count; WBC, white blood cell count.
FTD and WT-IM mice succumbed after a median of 245 and 103 days (Figure 1C), respectively, from a range of hematological malignancies, in keeping with previous findings12,31 (Figure 1D; supplemental Figure 1A-C and supplemental Table 3). FTD-IM mice succumbed significantly earlier, revealing strong synergy between Flt3-ITDand the GrOnc transposon (median, 73 days; Figure 1C), with 81% of analyzed mice (26 of 32 mice) developing AML and 9.3% (3 of 32) T-cell acute lymphoblastic leukemia (T-ALL; Figure 1D-F; supplemental Figure 1A and supplemental Table 3). Mice from all 3 experimental cohorts displayed higher white cell counts, lower platelet counts, and larger spleen sizes than the WT controls (Figure 1G).
Recurrent integration sites reveal Flt3-ITD–collaborating genes
Transposon integration sites from 38 unselected Flt3-ITD-IM mouse leukemias were mapped using QiSeq.18 Insertions were identified throughout the genome with notable peaks near genes such as Ash1l, Ets1, Notch1, Erg, and Setbp1 (Figure 2A). Genotype-specific CIS lists were generated using TAPDANCE (top 25 insertions) and Kernel convolution (60-kb window) analyses (supplemental Tables 6 and 7).12,21,22,24 Chromosome 19 CISs were discarded, as they likely represented “local hopping.”12 In total, we identified 22 CISs, including several at genes recurrently mutated in human AML including Runx1, Kdm6a, Flt3, and Bcor (Figure 2B).
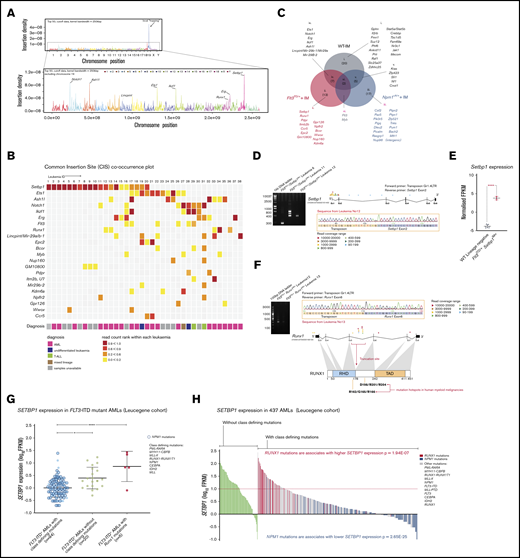
IM identifies known and novel collaborators with Flt3-ITD. (A) Genome-wide distribution of transposon integration site densities in 38 FTD-IM leukemic samples (only insertions reported by ≥20 reads were included), showing previously reported local hopping around the GrOnc transposon donor site on chromosome 19 (top)12 and smaller peaks at genes such as Notch1, Ash1l, Lincpint, Ets1, Ikzf1, Runx1, Erg, and Setbp1 (bottom). (B) Grid displaying transposon CISs and associated leukemia types in FTD-IM leukemia samples (n = 38). CIS lists were generated separately by TAPDANCE and kernel convolution analyses and combined. Read counts were normalized for each leukemia and ranked 0 to 1 (see key and “Methods”), to make use of the quantitative nature of QiSeq mapping and depict whether a particular insertion is in the main leukemic clone or in a subclone. (C) Overlap of CISs in different IM cohorts using the GrOnc transposon: FTD, Npm1cA/+,12 and WT (with the WT-IM cohort combined with the equivalent Npm1+/+ control cohort). (D) RT-PCR validation of transposon insertions in intron 1 of Setbp1 from 3 different leukemias (including sample 11 with multiple insertions) and location of all Setbp1 insertions in our FTD-IM cohort (n = 38). A chromatogram shows the transposon-initiated transcript splices into exon 2 of Setbp1 and upstream of its native ATG initiation codon, predicting overexpression of the full-length SETBP1 protein. (E) Significantly increased Setbp1 mRNA expression in Flt3ITD/+/Setbp1IM+ leukemias compared with WT lineage-negative cells. ****P < .0001. (F) RT-PCR validation of transposon insertions in exon 5 of the Runx1 gene and location of all Runx1 insertions in our FTD-IM cohort (n = 38). The predicted RUNX1 protein truncation closely mimics the effect of hotspot mutations in the runt homology domain (RHD) seen in human myeloid cancers (mouse and human RUNX1 amino acid sequences are identical between amino acids 60 and 240). TAD, transactivating domain. (G) Comparison of SETBP1 expression between 3 FLT3-ITD+ AML subgroups showing that, compared with AMLs with class-defining mutations, SETBP1 expression is higher in cases lacking such mutations and also those harboring a mutant RUNX1. Mean ± standard deviation. *P < .05, ****P < .00005; 1-way analysis of variance. (H) SETBP1 expression in AMLs without (green bars) and with (other color bars) class-defining mutations in the Leucegene cohort. Within the latter group, SETBP1 expression was higher in RUNX1-mutant and lower in NPM1-mutant AMLs.
IM identifies known and novel collaborators with Flt3-ITD. (A) Genome-wide distribution of transposon integration site densities in 38 FTD-IM leukemic samples (only insertions reported by ≥20 reads were included), showing previously reported local hopping around the GrOnc transposon donor site on chromosome 19 (top)12 and smaller peaks at genes such as Notch1, Ash1l, Lincpint, Ets1, Ikzf1, Runx1, Erg, and Setbp1 (bottom). (B) Grid displaying transposon CISs and associated leukemia types in FTD-IM leukemia samples (n = 38). CIS lists were generated separately by TAPDANCE and kernel convolution analyses and combined. Read counts were normalized for each leukemia and ranked 0 to 1 (see key and “Methods”), to make use of the quantitative nature of QiSeq mapping and depict whether a particular insertion is in the main leukemic clone or in a subclone. (C) Overlap of CISs in different IM cohorts using the GrOnc transposon: FTD, Npm1cA/+,12 and WT (with the WT-IM cohort combined with the equivalent Npm1+/+ control cohort). (D) RT-PCR validation of transposon insertions in intron 1 of Setbp1 from 3 different leukemias (including sample 11 with multiple insertions) and location of all Setbp1 insertions in our FTD-IM cohort (n = 38). A chromatogram shows the transposon-initiated transcript splices into exon 2 of Setbp1 and upstream of its native ATG initiation codon, predicting overexpression of the full-length SETBP1 protein. (E) Significantly increased Setbp1 mRNA expression in Flt3ITD/+/Setbp1IM+ leukemias compared with WT lineage-negative cells. ****P < .0001. (F) RT-PCR validation of transposon insertions in exon 5 of the Runx1 gene and location of all Runx1 insertions in our FTD-IM cohort (n = 38). The predicted RUNX1 protein truncation closely mimics the effect of hotspot mutations in the runt homology domain (RHD) seen in human myeloid cancers (mouse and human RUNX1 amino acid sequences are identical between amino acids 60 and 240). TAD, transactivating domain. (G) Comparison of SETBP1 expression between 3 FLT3-ITD+ AML subgroups showing that, compared with AMLs with class-defining mutations, SETBP1 expression is higher in cases lacking such mutations and also those harboring a mutant RUNX1. Mean ± standard deviation. *P < .05, ****P < .00005; 1-way analysis of variance. (H) SETBP1 expression in AMLs without (green bars) and with (other color bars) class-defining mutations in the Leucegene cohort. Within the latter group, SETBP1 expression was higher in RUNX1-mutant and lower in NPM1-mutant AMLs.
Of these 22 CIS genes, 13 were specific to FTD-IM and not identified in WT-IM leukemias or in our previous IM screening using the same transposon system in WT or Npm1c-mutant12 mice (Figure 2C; supplemental Figure 1B-C). Similarly, none of these 13 insertions was identified in a screening using the same transposon (GrOnc) in BCR-ABL mice, but analyzed by a different platform.32 Most striking among these, were insertions at Setbp1 present in 20 of 38 tumors (Figure 2B). Most, including all insertions with high read coverage, were located at the 5′ end of Setbp1 with the GrOnc enhancer in the forward orientation, predictive of a gene-activating effect (Figure 2D-E). mRNA transcripts initiated at the GrOnc promoter, spliced into exon 2 (Figure 2D) and were associated with marked Setbp1 overexpression (Figure 2E). All Setbp1IM+ leukemias analyzed were AMLs (Figure 2B; supplemental Figure 1A and supplemental Table 3) and displayed a trend toward shorter overall survival than leukemias without Setbp1 insertions (supplemental Figure 2A-B). Although transposon-driven leukemias can be multiclonal, Setbp1 insertions were usually in the dominant clone and maintained or enhanced their dominance after transplantation into secondary recipients (supplemental Figure 2C). The next most common Flt3-ITD–specific CIS involved truncating insertions in the Runx1 gene that recapitulated the RUNX1 mutations known to collaborate with mutant FLT3 in both human4 and mouse33 AML (Figure 2F). The remaining CISs found in at least 5 leukemias involved genes Ets1, Ashl1, Erg, Ikzf1, Notch1, Mir29a/b, and Flt3 itself, all of which were also identified in WT-IM and were thus not specific to Flt3-ITD IM (Figure 2B-C; supplemental Figure 3).
SETBP1 overexpression is a feature of many human FLT3-ITD+ AMLs
Our finding that Setbp1 overexpression synergizes with Flt3-ITD to drive murine AML, proposes that this synergy also operates in human FLT3-mutant AMLs lacking class-defining mutations. To investigate, we compared gene expression profiles between FLT3-ITD+ AMLs, with vs without class-defining mutations, excluding RUNX1, within the Leucegene AML cohort.34-37 We observed that SETBP1 expression was significantly higher in FLT3-ITD+ AMLs lacking class-defining mutations (Figure 2G; supplemental Table 9). Two independent AML cohorts corroborated this finding, albeit with less extensive mutational profiling38 or fewer cases3 (supplemental Figure 4A and supplemental Tables 10-11). Within The Cancer Genome Atlas (TCGA) cohort, for which outcome data were available, SETBP1high AMLs were associated with a significantly shorter survival than SETBP1low AMLs (supplemental Figure 4B and supplemental Tables 12-13).
In addition, we found that AMLs with RUNX1 mutations displayed higher SETBP1 expression (Figure 2G), suggesting that it, in part, drives their leukemogenic effects. To explore this possibility, we examined the relationship between class-defining mutations and SETBP1 expression in all AMLs, irrespective of FLT3 mutation status. We first noted that among 10% of AMLs with the highest SETBP1 expression 49% (21 of 43) had no class-defining mutations and 30% (13 of 43) had RUNX1 mutations (Leucegene data set).34-37 Overall, among AMLs with highest SETBP1 expression (log10 fragments per kilobase of exon per million reads mapped [FPKM] > 1.0), two-thirds had either a RUNX1 mutation or no class-defining mutation (Figure 2H).
Setbp1 insertions drive Flt3-ITD AML with Hoxa gene overexpression
To investigate molecular pathways activated by Setbp1 insertions, we compared the transcriptomes (RNA sequencing) of Flt3ITD/+/Setbp1IM+ and Flt3ITD/+/Setbp1IM− leukemias and identified 803 differentially expressed genes (log-fold ≥ 2, Padj ≤ .05; Figure 3A; supplemental Table 14). Gene set enrichment analysis revealed enrichment for expression patterns in NPM1-mutant16 and MLL-AF9-driven AMLs,17 typified by HOXA gene overexpression (Figure 3A). To contrast the pathways driven by Setbp1 overexpression to those activated by mutant Npm1, we compared the transcriptomes of Flt3ITD/+/Setbp1IM+ and Flt3ITD/+/Npm1cA/+12 murine AMLs. Setbp1, Meis1, Kdm1a, Mecom, Gfi1, Myc, Myb, and Bcl2 were relatively overexpressed in Flt3ITD/+/Setbp1IM+ AMLs (Figure 3B), whereas Flt3ITD/+/Npm1cA/+ AMLs showed higher expression of Nkx2.3 and lower expression of Cd34, as described before.31,39 Expression levels of Hoxa9, Hoxa10, and Flt3 were similar in both AMLs (Figure 3B-C). Similarly, in human data sets (TCGA), NPM1-mutant AMLs showed high HOXA9 and NKX2.3 expression (log10 FPKM > 4), whereas most of the SETBP1high AMLs (log10 FPKM > 1) displayed high HOXA9, but not NKX2.3 expression (Figure 3D; supplemental Figure 4C), mirroring our findings. Also, we found that HOXA/B genes were more highly expressed in FLT3-mutant vs FLT3-WT AMLs (supplemental Figure 4D; Leucegene).
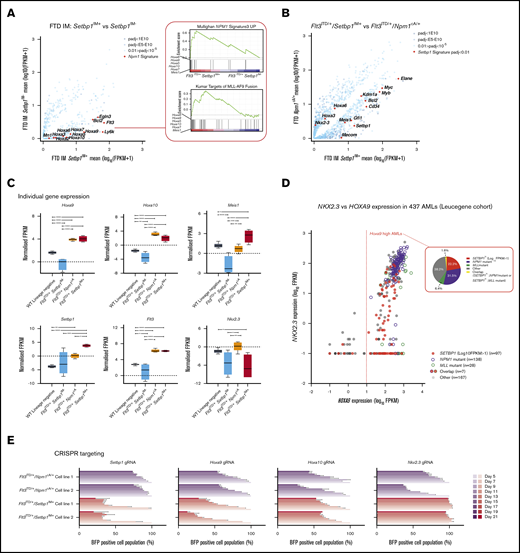
Setbp1 overexpression drives a gene expression signature that overlaps, but is distinct, from that associated with mutant NPM1 and MLL gene fusions. (A) Comparative gene-expression profiles of differentially expressed genes between Flt3ITD/+/Setbp1IM+and Flt3ITD/+/Setbp1IM− leukemias, highlighting a Hoxa-rich gene signature that overlaps with that seen with NPM1 mutations and the MLL-AF9 gene fusion. (B) Comparative gene-expression profile of differentially expressed genes between Flt3ITD/+/Setbp1IM+ and Flt3ITD/+/Npm1cA/+ AMLs (adjusted to average log10 FPKM for each group). (A-B) Adjusted P values (Padj). (C) Gene expression of selected genes in WT lin− cells and Flt3ITD/+/Setbp1IM−, Flt3ITD/+/Npm1cA/+, and Flt3ITD/+/Setbp1IM+ leukemias. (D) NKX2.3 and HOXA9 expression levels in AMLs in Leucegene cohort showing that NPM1-mutant leukemias uniformly express high HOXA9 and NKX2.3 (P = 2.08E-43; Fisher’s exact test), whereas the majority of SETBP1high (log10 FPKM >1) leukemias express only high HOXA9 and significantly associate with lower NKX2.3 expression (P = 1.72E-15; Fisher’s exact test). The pie chart shows that SETBP1 overexpression and mutant NPM1 are almost completely mutually exclusive and associated with relatively similar proportions of HOXA9high AMLs. (E) Impact of CRISPR gRNA gene knockouts in competitive coculture in Flt3ITD/+/Npm1cA and Flt3ITD/+/Setbp1IM+ AML cell lines (n = 3 per cell line). The results show that, although both types of AML are vulnerable to loss of Hoxa9 and Hoxa10, only Flt3ITD/+/Setbp1IM+ cells are vulnerable to loss of Setbp1, and only Flt3ITD/+/Npm1cA AMLs are vulnerable to loss of Nkx2.3.
Setbp1 overexpression drives a gene expression signature that overlaps, but is distinct, from that associated with mutant NPM1 and MLL gene fusions. (A) Comparative gene-expression profiles of differentially expressed genes between Flt3ITD/+/Setbp1IM+and Flt3ITD/+/Setbp1IM− leukemias, highlighting a Hoxa-rich gene signature that overlaps with that seen with NPM1 mutations and the MLL-AF9 gene fusion. (B) Comparative gene-expression profile of differentially expressed genes between Flt3ITD/+/Setbp1IM+ and Flt3ITD/+/Npm1cA/+ AMLs (adjusted to average log10 FPKM for each group). (A-B) Adjusted P values (Padj). (C) Gene expression of selected genes in WT lin− cells and Flt3ITD/+/Setbp1IM−, Flt3ITD/+/Npm1cA/+, and Flt3ITD/+/Setbp1IM+ leukemias. (D) NKX2.3 and HOXA9 expression levels in AMLs in Leucegene cohort showing that NPM1-mutant leukemias uniformly express high HOXA9 and NKX2.3 (P = 2.08E-43; Fisher’s exact test), whereas the majority of SETBP1high (log10 FPKM >1) leukemias express only high HOXA9 and significantly associate with lower NKX2.3 expression (P = 1.72E-15; Fisher’s exact test). The pie chart shows that SETBP1 overexpression and mutant NPM1 are almost completely mutually exclusive and associated with relatively similar proportions of HOXA9high AMLs. (E) Impact of CRISPR gRNA gene knockouts in competitive coculture in Flt3ITD/+/Npm1cA and Flt3ITD/+/Setbp1IM+ AML cell lines (n = 3 per cell line). The results show that, although both types of AML are vulnerable to loss of Hoxa9 and Hoxa10, only Flt3ITD/+/Setbp1IM+ cells are vulnerable to loss of Setbp1, and only Flt3ITD/+/Npm1cA AMLs are vulnerable to loss of Nkx2.3.
To establish whether Setbp1 and/or Hoxa overexpression were required for proliferation of Flt3ITD/+/Setbp1IM+ AMLs, we targeted Setbp1, Hoxa9, Hoxa10, and Nkx2.3 with CRISPR gRNA in 2 independently derived, Cas9-expressing clones established from samples 6 and 12 (supplemental Figure 6)25 and quantified the relative growth of transduced (BFP+) vs nontransduced (BFP−) cells, as described before.25 In parallel, 2 Flt3ITD/+/Npm1cA/+/Rosa-Cas931 AMLs were tested in the same way. As expected, gRNAs against Hoxa9 and Hoxa10 inhibited the growth of both Flt3ITD/+/Setbp1IM+ and Flt3ITD/+/Npm1cA/+ AMLs (Figure 3E). By contrast, the Setbp1 gRNA only inhibited Flt3ITD/+/Setbp1IM+ and the Nkx2.3 gRNA only Flt3ITD/+/Npm1cA/+ AML cell growth (Figure 3E). These data strongly indicate that Setbp1 overexpression drives Flt3-ITD AMLs by activating a transcriptional network that overlaps, but is distinct from, that commandeered by mutant Npm1. Collectively, these findings support the notion that SETBP1-overexpressing AMLs lacking class-defining mutations, are a molecularly distinct group with a poor prognosis (supplemental Figure 4B) and represent a significant proportion of the HOXA9high AMLs in humans (~22%; Leucegene [Figure 3D] and ~11% TCGA [supplemental Figure 4C]).
SETBP1 overexpression is associated with undifferentiated AML morphology
Furthermore, we identified a strong association between SETBP1 overexpression and FAB (French-American-British Cooperative Group) M0 morphology in 3 large AML data sets (Figure 4 A-B; supplemental Figure 5; supplemental Tables 12, 13, 15, and 16). Notably, the FAB-M0 AML subtype is predictive of poor prognosis,40 as was SETBP1 overexpression in the TCGA cohort (supplemental Figure 4B), suggesting that SETBP1 overexpression in part underlies the poor prognosis of AML M0. In keeping with an undifferentiated morphology and a poor prognosis, the transcriptomes of SETBP1high/HOXA9high AMLs were highly enriched in an HSC gene signature41 (Figure 4C).

SETBP1 overexpression associates with FAB M0 AML subtype. (A) SETBP1 expression (Affymetrix, median-centered intensity) in FAB M0 AMLs compared with other FAB subtypes in the 3 independent data sets TCGA (i), Wouters (ii), and Valk (iii), from the Oncomine database (median ± interquartile range; Student t test). (B) SETBP1 expression (RNA-seq) in 151 leukemia samples (TCGA) by FAB subtype, confirming higher SETBP1 expression in M0. Mean ± standard deviation. ***P < .0005, ****P < .0005, 1-way ANOVA. (C) SETBP1 and HOXA9 expression (RNA-seq) in different FAB AML subtypes from the TCGA cohort. M0 samples predominantly clustered at the SETBP1high/HOXA9high quadrant with many, but not all, harboring RUNX1 mutations. Reflecting their enrichment (the high number of M0 leukemias), SETBP1high/HOXA9high AMLs gene expression patterns show enrichment in an HSC gene signature. NES, normalized enrichment score.
SETBP1 overexpression associates with FAB M0 AML subtype. (A) SETBP1 expression (Affymetrix, median-centered intensity) in FAB M0 AMLs compared with other FAB subtypes in the 3 independent data sets TCGA (i), Wouters (ii), and Valk (iii), from the Oncomine database (median ± interquartile range; Student t test). (B) SETBP1 expression (RNA-seq) in 151 leukemia samples (TCGA) by FAB subtype, confirming higher SETBP1 expression in M0. Mean ± standard deviation. ***P < .0005, ****P < .0005, 1-way ANOVA. (C) SETBP1 and HOXA9 expression (RNA-seq) in different FAB AML subtypes from the TCGA cohort. M0 samples predominantly clustered at the SETBP1high/HOXA9high quadrant with many, but not all, harboring RUNX1 mutations. Reflecting their enrichment (the high number of M0 leukemias), SETBP1high/HOXA9high AMLs gene expression patterns show enrichment in an HSC gene signature. NES, normalized enrichment score.
Genome-wide genetic vulnerabilities of Setbp1high/Flt3ITD/+ AML
Having established that SETBP1 overexpression drives myeloid leukemogenesis and is associated with poor prognosis, we reasoned that our murine Flt3ITD/+/Setbp1IM+ AMLs provide a unique opportunity to identify potential therapeutic vulnerabilities of this previously unexplored subtype of AML. For this, we performed genome-wide CRISPR-Cas9 recessive screening on 2 independent Cas9-expressing Flt3ITD/+/Setbp1IM+ AML clones established from leukemia samples 6 and 12 (Figure 5A; supplemental Figure 6 and supplemental Table 3).25,26,42 The 2 clones had a very similar number of dropout genes (∼2250, negative false discovery rate [FDR] < 0.2), ∼82% of which were shared (Figure 5B-C). Furthermore, in each of the cell lines, almost all dropout genes with negFDR < 0.2 were expressed (log10 FPKM > 0.5), the lack of dropouts among nonexpressed genes indicating negligible off-target/false-positive results (Figure 5D). A final list of dropout genes was generated using pooled data from all 4 Flt3ITD/+/Setbp1IM+ screenings (Model-based Analysis of Genome-wide CRISPR-Cas9 Knockout; negative FDR < 0.2; supplemental Figure 7A and supplemental Tables 17-19).

Genome-wide genetic vulnerabilities of Flt3ITD/+/Setbp1IM+AMLs revealed by CRISPR knockout screening. (A) Genome-wide CRISPR-CAs9 recessive screening of 2 independent Flt3ITD/+/Setbp1IM+ AMLs. Cells were harvested at days 8, 12, 16, 20, and 24. Day 20 was selected as the most representative dropout screening (supplemental Figure 6A). (B) Overlap of dropout genes between the 2 Flt3ITD/+/Setbp1IM+ AML samples. (C) The number of depleted genes in the 2 Flt3ITD/+/Setbp1IM+with respect to their negative FDR (negFDR; pooled data from 2 biological replicate screenings). (D) Gene expression (RNA-seq) vs dropout P value in individual Flt3ITD/+/Setbp1IM+ cell lines, showing that almost all significant dropout genes (negFDR ≤0.2) are expressed at FPKM ≥0.5. (E) Overlap of dropout genes for Flt3ITD/+/Setbp1IM+ and Flt3ITD/+/MLL-AF9 AMLs, and nonleukemic HPC7 hematopoietic progenitor cells, showing 420 shared pan-essential and 966 Flt3ITD/+/Setbp1IM+-specific dropout genes. (F) Difference in negative FDR values (ΔnegFDR) for the 966 Flt3ITD/+/Setbp1IM+-specific dropout genes in the HPC7 (blue) and MLL-AF9 (pink) screenings. A total of 677 genes were selected as being more specific to Flt3ITD/+/Setbp1IM+ AMLs, as they did not show any trend for dropping out (FDR >0.7) in either Flt3ITD/+/MLL-AF9 or HPC7 cells. (G) GO term analysis for the 677 Flt3ITD/+/Setbp1IM+-specific essential genes (thresholds used: fold enrichment, >1; number of genes per set, >3; P < .05). (H) The number of druggable genes and the genes for which US Food and Drug Administration (FDA)–approved drugs are available (n = 81) according to the Drug-Gene Interaction Database (DGIdb).45
Genome-wide genetic vulnerabilities of Flt3ITD/+/Setbp1IM+AMLs revealed by CRISPR knockout screening. (A) Genome-wide CRISPR-CAs9 recessive screening of 2 independent Flt3ITD/+/Setbp1IM+ AMLs. Cells were harvested at days 8, 12, 16, 20, and 24. Day 20 was selected as the most representative dropout screening (supplemental Figure 6A). (B) Overlap of dropout genes between the 2 Flt3ITD/+/Setbp1IM+ AML samples. (C) The number of depleted genes in the 2 Flt3ITD/+/Setbp1IM+with respect to their negative FDR (negFDR; pooled data from 2 biological replicate screenings). (D) Gene expression (RNA-seq) vs dropout P value in individual Flt3ITD/+/Setbp1IM+ cell lines, showing that almost all significant dropout genes (negFDR ≤0.2) are expressed at FPKM ≥0.5. (E) Overlap of dropout genes for Flt3ITD/+/Setbp1IM+ and Flt3ITD/+/MLL-AF9 AMLs, and nonleukemic HPC7 hematopoietic progenitor cells, showing 420 shared pan-essential and 966 Flt3ITD/+/Setbp1IM+-specific dropout genes. (F) Difference in negative FDR values (ΔnegFDR) for the 966 Flt3ITD/+/Setbp1IM+-specific dropout genes in the HPC7 (blue) and MLL-AF9 (pink) screenings. A total of 677 genes were selected as being more specific to Flt3ITD/+/Setbp1IM+ AMLs, as they did not show any trend for dropping out (FDR >0.7) in either Flt3ITD/+/MLL-AF9 or HPC7 cells. (G) GO term analysis for the 677 Flt3ITD/+/Setbp1IM+-specific essential genes (thresholds used: fold enrichment, >1; number of genes per set, >3; P < .05). (H) The number of druggable genes and the genes for which US Food and Drug Administration (FDA)–approved drugs are available (n = 81) according to the Drug-Gene Interaction Database (DGIdb).45
To identify cell-essential genes specific to Flt3ITD/+/Setbp1IM+ AMLs, we (1) performed a similar screening on HPC7 nonleukemic hematopoietic progenitor cells43 and (2) used data from our previously published screening using the same library/platform on murine Flt3ITD/+/MLL-AF9 cells44 (Figure 5E; supplemental Figure 7B). Gene Omnibus (GO) term analysis of 420 dropout genes shared between all 3 screenings, revealed highly significant enrichment for pan-essential biological processes (supplemental Figure 7C and supplemental Tables 20-21). Also, 966 genes were specific to Flt3ITD/+/Setbp1IM+ (supplemental Tables 17-19). To increase stringency for genes specific to the Flt3ITD/+/Setbp1IM+ genotype, we focused on 677 genes with an FDR difference ≥0.5 between the Flt3ITD/+/Setbp1IM+ and both HPC7 and MLL-AF9 screenings (Figure 5F; supplemental Tables 18-19). GO term analysis of these 677 genes showed significant enrichment in pathways involved in RNA, DNA, and histone modifications; hematopoietic transcription factors; phosphoinositide 3-kinase activity; and cholesterol biosynthesis, among others (Figure 5G; supplemental Figure 7D and supplemental Tables 22-23). Of the 677 genes, 115 were predicted to be druggable, and 81 were targets of US Food and Drug Administration–approved drugs45 (Figure 5H; supplemental Figure 7E and supplemental Table 19), including Brd3, Ezh2, and Hmgcr. We also identified 169 genes with gRNAs that were enriched in the Flt3ITD/+/Setbp1IM+ screenings (positive FDR <0.2), including Pten, Bcor, and Bcorl1, in keeping with the known roles of these genes as tumor suppressors in AML (supplemental Table 17).
Validation of dropout and enriched genes
To validate some of these candidates, we studied the effects of their disruption by each of 2 different gRNAs on cell survival/proliferation. First, we confirmed the editing efficiency of a set of 5 dropout gRNAs (supplemental Figure 8) and then tested the in vitro dependency of Flt3ITD/+/Setbp1IM+ cells on 26 dropout and 7 enriched genes including histone modifiers, transcription factors, kinases, spliceosomal genes, and miscellaneous druggable genes (Figure 6A). We observed that targeting 24 of 26 dropout genes led to loss of survival or proliferation, whereas targeting of 5 of 7 enriched genes imparted a significant growth advantage to Flt3ITD/+/Setbp1IM+ cells (Figure 6A). To investigate the requirement for some of these genes in vivo, we generated a luciferase-expressing Cas9+/Flt3ITD/+/Setbp1IM+ cell line from sample 12 and targeted genes individually with a lentiviral gRNA before IV injection into NSG mice (Figure 6B). We observed excellent concordance with screening results with dropout genes (Hoxa, Setbp1, Hmgcr, and Erg) prolonging mouse survival and an enriched gene (Bcor) reducing it (Figure 6C).

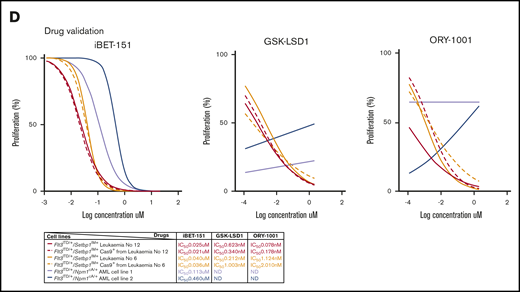
Validation of select dropout genes in vitro and in vivo. (A) CRISPR-gRNA validation of 26 dropout and 7 enriched genes belonging to different genetic categories, using competitive coculture, counting the percentage of BFP+ (transduced) vs percentage of BFP− (nontransduced) cells at each time point. (B) Outline of in vivo validation approach using CRISPR-gRNA in a stable luciferase-expressing Flt3ITD/+/Setbp1IM+ AML cell line and transplantation into NSG mice. (C) Bioluminescence images of representative transplant-recipient mice from each single gRNA cohort. Flt3ITD/+/Setbp1IM+AML cells transduced with gRNAs against the dropout genes Hoxa9, Setbp1, Erg, and Hmgrc were associated with a trend toward reduced luminescence at 6 weeks and with a significantly prolonged survival compared with cells transduced with an empty vector. By contrast, cells transduced with a gRNA targeting the enriched gene Bcor, had extensive engraftment by 6 weeks and exhibited a trend toward reduced survival. Median survivals were Hoxa9, 102 days; Setbp1, 79 days; Hmgcr, 69 days; Erg, 130 days; and empty control, 57 days, Bcor, 52 days. P values: Student t test for luminescence and Mantel-Cox for survival. (D) Dose-response curves for iBET-151 and KDM1A inhibitors ORY-1001 and GSK-LSD1. Parental Flt3ITD/+/Setbp1IM+ AMLs (solid lines) and their Cas9-expressing clones (dotted lines) show higher sensitivity to iBET-151 compared with 2 independent Flt3ITD/+/Npm1cA/+ AMLs (blue/purple). The differences in responses to ORY-1001 and GSK-LSD1 treatment were more marked, with Flt3ITD/+/Setbp1IM+ AMLs showing significant sensitivity, whereas Flt3ITD/+/Npm1cA/+ AMLs showed no notable response to these compounds over the concentration range tested. ND, not determined.
Validation of select dropout genes in vitro and in vivo. (A) CRISPR-gRNA validation of 26 dropout and 7 enriched genes belonging to different genetic categories, using competitive coculture, counting the percentage of BFP+ (transduced) vs percentage of BFP− (nontransduced) cells at each time point. (B) Outline of in vivo validation approach using CRISPR-gRNA in a stable luciferase-expressing Flt3ITD/+/Setbp1IM+ AML cell line and transplantation into NSG mice. (C) Bioluminescence images of representative transplant-recipient mice from each single gRNA cohort. Flt3ITD/+/Setbp1IM+AML cells transduced with gRNAs against the dropout genes Hoxa9, Setbp1, Erg, and Hmgrc were associated with a trend toward reduced luminescence at 6 weeks and with a significantly prolonged survival compared with cells transduced with an empty vector. By contrast, cells transduced with a gRNA targeting the enriched gene Bcor, had extensive engraftment by 6 weeks and exhibited a trend toward reduced survival. Median survivals were Hoxa9, 102 days; Setbp1, 79 days; Hmgcr, 69 days; Erg, 130 days; and empty control, 57 days, Bcor, 52 days. P values: Student t test for luminescence and Mantel-Cox for survival. (D) Dose-response curves for iBET-151 and KDM1A inhibitors ORY-1001 and GSK-LSD1. Parental Flt3ITD/+/Setbp1IM+ AMLs (solid lines) and their Cas9-expressing clones (dotted lines) show higher sensitivity to iBET-151 compared with 2 independent Flt3ITD/+/Npm1cA/+ AMLs (blue/purple). The differences in responses to ORY-1001 and GSK-LSD1 treatment were more marked, with Flt3ITD/+/Setbp1IM+ AMLs showing significant sensitivity, whereas Flt3ITD/+/Npm1cA/+ AMLs showed no notable response to these compounds over the concentration range tested. ND, not determined.
Furthermore, we validated actionable vulnerabilities Brd3 and Kdm1a in both primary AMLs and their respective Cas9+Flt3ITD/+/Setbp1IM+ AML cell lines by testing their sensitivity to the iBET-151 (BRD2/3/4 inhibitor) and KDM1A inhibitor GSK-LSD1 and to ORY-1001 treatment. We used Flt3ITD/+/Npm1cA/+AML cells as the control to look for specificity of these vulnerabilities. As anticipated, Flt3ITD/+/Npm1cA/+ AML cells were sensitive to iBET-151 (Figure 6D).46,47 Interestingly, Flt3ITD/+/Setbp1IM+ AML cells were even more sensitive to iBET-151 treatment than Flt3ITD/+/Npm1cA/+ AML cells (Figure 6D). As Kdm1a was of the Flt3ITD/+/Setbp1IM+ AML-specific upregulated genes when compared with Flt3ITD/+/Npm1cA/+ AMLs (Figure 3B), we tested its inhibitors GSK-LSD148 and ORY-100149 and observed robust and specific vulnerability to Kdm1a inhibition in Flt3ITD/+/Setbp1IM+AML cells, but no response in Flt3ITD/+/Npm1cA/+ AML to either drug over the same concentration range (Figure 6D).
Discussion
AML remains lethal in most cases, and there is an urgent need for new therapeutic approaches. More than one-third of cases have mutations in FLT3, making this the most commonly mutated gene in AML.4 FLT3 mutations are usually (∼80%) ITDs that impart a poor prognosis, reflecting their powerful leukemogenic effects. However, FLT3 mutations appear unable to engender AML in isolation4,50 and only do so in association with (1) oncogenic mutations in genes such as NPM1, MLL, RUNX1, and CEBPA, or (2) chimeric fusion genes, such as PML-RARA, CBFB-MYH11, DEK-NUP214, and MLL-X. In fact, FLT3 mutations are acquired late in disease evolution and act to transform preleukemic cell clones driven by 1 of these class-defining mutations into AML.51-53
Understanding the basis of the molecular synergy between FLT3 and class-defining mutations can help develop rational combination therapies, as was shown recently with mutant NPM1.54 However, a significant proportion (∼20%) of FLT3-ITD AMLs do not harbor class-defining mutations or, in many cases, any known oncogenic mutations.4 Although it is possible that as yet undiscovered somatic mutations are present in these cases, the large number of AML exomes and genomes studied so far make this unlikely. Instead, the epigenetic activation of leukemogenic programs or silencing of antileukemic genes is a plausible alternative.
We used Sleeping Beauty IM to scan the genome for genes that, when activated or inactivated, can synergize with Flt3-ITD to drive myeloid leukemogenesis. CIS analysis revealed recurrent activating insertions in known myeloid oncogenes including Ets1, Ash1l, Erg, and Myb; the microRNA genes miR29b-1/a-2 and miR29b-2; and Flt3 itself (Figure 2A-B). These genes were also identified in IM screenings using the same transposon in WT, Npm1c,12 or BCR-ABL32 mice. However, 2 CIS genes were unique to Flt3-ITD mice and uniformly associated with AML: Setbp1, the most commonly found gene by far (20 of 38 leukemias), and Runx1, a known collaborator with FLT3-ITD in human AML (Figure 2C-F). As the transposon has access to the entire mouse genome, the highly recurrent targeting of Setbp1 reveals a powerful synergy with Flt3-ITD. Interestingly, retroviral overexpression of Setbp1 has been shown to activate Myb55 and HoxA56 genes and drive leukemogenesis in mice,55,56 but the association with FLT3-ITD in mice and humans has not been reported. Also, as transposons can only activate, inactivate, or truncate genes and cannot cause substitutions, indels, or fusion genes, Runx1 was the only class-defining gene amenable to targeting by GrOnc, another striking finding.
Our results suggest that SETBP1 overexpression, through epigenetic mechanisms,57,58 may act in place of class-defining mutations to synergize with FLT3-ITD and drive a proportion of human cases of AML. In support of this premise, FLT3-ITD+ human AMLs that lack class-defining mutations displayed significantly higher SETBP1 mRNA expression as a group compared with other AMLs (Figure 2G-H). Also, in Flt3ITD/+ AML, Setbp1 overexpression drove a leukemogenic program that resembled those associated with the mutant NPM1 and MLL fusion genes and typified by Hoxa gene signatures (Figure 3A). Furthermore, Flt3ITD/+/Setbp1IM+ AMLs were dependent on Setbp1 for their survival and proliferation, whereas Flt3ITD/+/Npm1cA/+ AMLs were not (Figure 3E). Notably, a substantial proportion (22%) of HOXA9high AMLs were associated with SETBP1 overexpression (Leucegene), a fraction comparable to the 32% associated with mutant NPM1, with the 2 categories being almost completely mutually exclusive, in keeping with functional redundancy and in support of the driver status of SETBP1 overexpression (Figure 3D).
In addition, we identified recurrent inactivating insertions in the known AML tumor-suppressor genes Bcor, Kdm6a (Utx), and Runx1. Notably, insertions in Runx1 were specific to Flt3-ITD IM and clustered in intron 5, thus recapitulating the effect of truncating mutations at 1 of 2 human RUNX1 hotspots (Figure 2F).59 This is probably the only intron genome wide where a transposon could insert, to recapitulate the effect of any known FLT3-ITD–collaborating class-defining mutation, emphasizing the power of our approach. Interestingly, we observed that human RUNX1-mutant AMLs express significantly higher levels of SETBP1 compared with AMLs with other class-defining mutations (Figure 2G-H). This corroborates the synergy between FLT3-ITD and high SETBP1 and suggests that the latter may be an important mediator of the leukemogenic effects of RUNX1 mutations. Interestingly, the reciprocal relationship has also been reported, with Runx1 downregulation being an important leukemogenic event associated with Setbp1 overexpression,60 with findings by others suggesting that this effect may be indirect.61
Notably, whereas a significant proportion of AMLs display SETBP1 overexpression,62 somatic mutations in SETBP1, typical of leukemic myeloproliferative disorders,57,63,64 are very rare in primary AML.3,4,64 Interestingly, these SETBP1 mutations disrupt a degron sequence within its SKI domain that normally binds the E3 ubiquitin ligase subunit and targets the protein for proteasomal degradation.63 Mutations inhibit this process leading to increased SETBP1 protein levels,63 proposing that they are functionally equivalent to SETBP1 overexpression.65 In fact, both mutation57 and overexpression56 have been shown to drive a HOXA gene signature and to inhibit the tumor suppressor PP2A.62,65 However, HOXA overexpression is shared by many other leukemogenic mutations (including class-defining mutations such as NPM1c, MLL rearrangements, and NUP98-NSD1 fusions), and several lines of evidence suggest that the 2 types of SETBP1 alteration may also have important functional differences.61 Also, the PP2A activator 1,9-dideoxy-forskolin, did not affect the growth of cells immortalized by Setbp1 overexpression.56 Furthermore, many cases of SETBP1-mutant myeloid malignancies display marked SETBP1 overexpression, suggesting that the 2 alterations do not have redundant effects. These observations may explain why SETBP1 mutation vs overexpression drive different types of myeloid neoplasms.
Our results suggest that SETBP1 overexpression is not only associated with a poor prognosis,57,62 but is also an important driver of a subtype of AML. Given this, we considered that our mouse model offered a unique opportunity to identify genetic vulnerabilities of leukemias driven by high levels of SETBP1. To investigate, we established Cas9-expressing clones of Flt3ITD/+/Setbp1IM+ AML and performed a genome-wide CRISPR-Cas9 screening, that identified more than 2300 genes, including 677 that were specific to this genotype and 115 druggable genes. Also, our screening identified dropout genes such as Set62 and Kmt2a61 known to interact with Setbp1 and other genes, such as Hoxa9/1056 and Mecom,57,61 which have been reported to be directly controlled by Setbp1. In addition, we identified 169 enriched genes, indicating that their loss enhanced the proliferation of Flt3ITD/+/Setbp1IM+ AML cells. We individually verified the predicted impact of 24 of 26 dropout genes and 5 of 7 enriched genes from our screening, by using competitive coculture (Figure 6A). We also tested 5 of these genes in vivo and again observed the expected effect: targeting dropout genes Hoxa9, Setbp1, Hmgcr, or Erg prolonged and targeting the enriched gene Bcor reduced the survival of mouse recipients of Flt3ITD/+/Setbp1IM+ AML cell transplants.
In light of our collective findings, we propose that SETBP1 overexpression collaborates with FLT3-ITDto drive a subgroup of human AMLs lacking class-defining mutations. In keeping with this premise, SETBP1 overexpression activates a Hoxa transcriptional program, a characteristic shared by several class-defining mutations know to collaborate with Flt3-ITD(supplemental Figure 4D). Furthermore, we provide a catalog of genetic vulnerabilities of this AML subtype that can be used to develop targeted therapies against these leukemias and validate many of them genetically and some pharmacologically.
All raw sequencing data have been released to ENA (accession number ERP117389).
Original data may be obtained by e-mail request to the corresponding author, George S. Vassiliou (gsv20@cam.ac.uk).
Acknowledgments
The authors thank Gary Gilliland for the Flt3ITD/+ mouse model and staff at the Wellcome Sanger Institute’s research support facility (RSF) for their support with animal work. They also thank the TCGA Research Network and Leucegene for access to RNA-seq/gene-expression datasets, and all patients/volunteers whose samples were used to generate data used in this manuscript.
This work was funded by Cancer Research UK (C22324/A23015) and Wellcome (WT098051). G.S.V. is personally funded by a Cancer Research UK Senior Cancer Research Fellowship (C22324/A23015) and work in his laboratory is also funded by the European Research Council, Kay Kendall Leukaemia Fund, Blood Cancer UK, Leukemia Lymphoma Society, and Rising Tide Foundation for Clinical Cancer Research. S.P. is funded by a Wellcome Sanger Institute Postdoctoral Fellowship (WT098051).
Authorship
Contribution: G.S.V. designed and supervised the study; S.P., O.M.D., and R.R. assisted with the study design and supervision; S.P., O.M.D., and J.L.C. performed most of the experiments; K.T., M.J.F., M.G., S.S.R., E.D.B., and G.S.V. assisted with the experiments; M.G., M.B., G.C., H.P., R.B., M.S.V., and S.P. performed the bioinformatic and statistical analyses; P.W. performed the histopathological analyses; K.T. and M.M. provided data used for analysis in this study; S.P., O.M.D., and G.S.V. wrote and reviewed the manuscript.
Conflict-of-interest disclosure: G.S.V. is a consultant for and a minor stockholder in Kymab Ltd and has received educational grants from Celgene. The remaining authors declare no competing financial interests.
Correspondence: George S. Vassiliou, Department of Haematology, Wellcome MRC Cambridge Stem Cell Institute, Cambridge CB12 0AW, United Kingdom; e-mail: gsv20@cam.ac.uk.

