

Abstract
Prompt evaluation and therapeutic intervention of suspected pulmonary embolism (PE) are of paramount importance for improvement in outcomes. We systematically reviewed outcomes in patients with suspected PE, including mortality, incidence of recurrent PE, major bleeding, intracranial hemorrhage, and postthrombotic sequelae. We searched the Cochrane Central Register of Controlled Trials, MEDLINE, and Embase for eligible studies, reference lists of relevant reviews, registered trials, and relevant conference proceedings. We included 22 studies with 15 865 patients. Among patients who were diagnosed with PE and discharged with anticoagulation, 3-month follow-up revealed that all-cause mortality was 5.69% (91/1599; 95% confidence interval [CI], 4.56-6.83), mortality from PE was 1.19% (19/1597; 95% CI, 0.66-1.72), recurrent venous thromboembolism (VTE) occurred in 1.38% (22/1597; 95% CI: 0.81-1.95), and major bleeding occurred in 0.90% (2/221%; 95% CI, 0-2.15). In patients with a low pretest probability (PTP) and negative D-dimer, 3-month follow-up revealed mortality from PE was 0% (0/808) and incidence of VTE was 0.37% (4/1094; 95% CI: 0.007-0.72). In patients with intermediate PTP and negative D-dimer, 3-month follow-up revealed that mortality from PE was 0% (0/2747) and incidence of VTE was 0.46% (14/3015; 95% CI: 0.22-0.71). In patients with high PTP and negative computed tomography (CT) scan, 3-month follow-up revealed mortality from PE was 0% (0/651) and incidence of VTE was 0.84% (11/1302; 95% CI: 0.35-1.34). We further summarize outcomes evaluated by various diagnostic tests and diagnostic pathways (ie, D-dimer followed by CT scan).
Introduction
Pulmonary embolism (PE) is a manifestation of venous thromboembolism (VTE) that involves formation of a blood clot in the pulmonary vasculature. Symptoms may include shortness of breath, tachycardia, fever, and pleuritic chest pain. The annual incidence of PE is estimated at 60 to 70 cases per 100 000, and it can be associated with significant morbidity and mortality. In the United States and Europe, PE accounts for 100 000 and 300 000 annual deaths, respectively.1-3 Prompt diagnosis and expeditious therapeutic intervention are of paramount importance for optimal patient management. Various strategies are used for the evaluation of suspected PE. The first involves determining the pretest probability (PTP) of PE, either formally using a clinical decision rule or informally using clinical judgment, prior to diagnostic testing. Following this, options for diagnostic tests include D-dimer, ultrasonography (US), computed tomography pulmonary angiography (CTPA), and ventilation perfusion (VQ) scanning. These tests can be used alone or in sequence, depending on the PTP.
Although the diagnostic pathway is an important consideration in determining the optimal strategy for the evaluation of suspected PE, this review focuses on patient-important outcomes. These outcomes assess the consequences of missed or incorrect diagnoses when anticoagulant treatments are mistakenly withheld or administered unnecessarily. Anticoagulant treatment of PE is associated with risks of bleeding, with major bleeding (bleeding requiring red cell transfusion or intervention to stop bleeding or bleeding into a critical area, such as intracranial hemorrhage) being the most clinically relevant. Other important outcomes include mortality related to PE, recurrent PE, and chronic thromboembolic pulmonary hypertension (CTEPH). Although these are the most commonly reported outcomes, they are also patient-important outcomes given the detrimental effect that they may have on the patient’s life. We conducted a systematic review and meta-analysis to assess the outcomes of patients with suspected PE evaluated by various diagnostic pathways to determine the frequency of such outcomes. This systematic review was performed in conjunction with a PE test accuracy review that evaluated optimal diagnostic pathways based on PTP to inform an overall guideline on the management of VTE, which is discussed further in Methods.4,5
Methods
Determining outcomes of interest
This systematic review was undertaken for the purposes of informing the American Society of Hematology guidelines on the management of VTE, specifically the diagnosis of VTE. The review process began with a multi-disciplinary panel coordinated by the American Society of Hematology Venous Thromboembolism Guideline Coordination Committee consisting of physicians with clinical and research expertise on the guideline topic, methodologists with expertise in evidence appraisal and guideline development, and patient representatives. These panel members developed clinical questions of interest regarding the diagnosis of VTE. The process is briefly described below; for detailed information, refer to the original guideline publication.5
After the primary questions were developed, the panel chairs developed diagnostic pathways that were refined through an iterative process with input from the panel (supplemental Material 1). The diagnostic pathways are the various testing algorithms that include performing imaging and laboratory work sequentially or in parallel. The diagnostic strategies for PE are based on the PTP for individual patients, which provides an estimate of the expected prevalence of PE at a population level. PTP can be determined using validated clinical decision rules, such as the Wells criteria or the revised Geneva score.6,7 The original Wells criteria divided outpatients into 3 categories (low, intermediate, and high), and the dichotomized Wells criteria divided patients into 2 categories (unlikely and likely). In patients with suspected PE, the guideline assumed the prevalence in patients with low, intermediate, and high PTP to be ≤5%, 20% (±10%), and ≥50%, respectively. Therefore, when possible, outcomes were further classified by PTP.
The panel then selected outcomes of interest for each question a priori, following the approach described in detail elsewhere.8 The panel brainstormed all possible outcomes, then rated their relative importance for decision making following the Grading of Recommendation, Assessment, Development and Evaluation (GRADE) approach.9 During this rating process, the panel used definitions of the outcomes (“marker states”) that were developed for these guidelines by the McMaster GRADE Center. Rating outcomes by their relative importance can focus attention on those outcomes that are considered most important and help to resolve or clarify potential disagreements. In addition to the diagnostic accuracy outcomes (false positive [FP], false negative [FN], true positive [TP], and true negative [TN] test results), the panel rated the following outcomes as critical for decision making across the PE diagnosis questions: all-cause mortality, mortality from VTE, development of PE, development of deep vein thrombosis (DVT), development of recurrent PE, development of CTEPH, major bleeding, and intracranial hemorrhage.
Data sources and searches
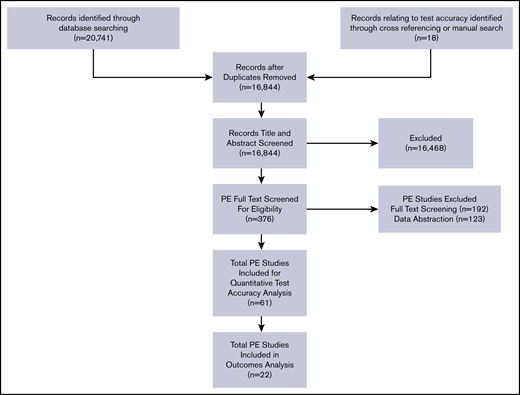
We conducted this systematic review in accordance with a prespecified registered protocol available on PROSPERO (registration number CRD42018084677). We reported the results according to Preferred Reporting Items for Systematic Reviews and Meta-Analyses (PRISMA) guidelines.10 The primary source of information was studies that were included for the analysis of test accuracy (Figure 1; discussed in a separate article4 ). The secondary source included studies identified as having potential information for outcomes when the initial search was completed, regardless of whether the study contained information about test accuracy. The final source was any additional studies suggested by experts in the field or other guidelines.
We performed an electronic search of the Cochrane Central Register of Controlled Trials (until May 2019), Ovid MEDLINE (from 1976 to May 2019), and Embase (from 1974 to May 2019). A methodological filter was applied to limit retrieval of studies with data for test accuracy (prospective studies, cross-sectional studies, cohort studies, abstracts, and conference posters after 2014, limited to humans); the detailed search strategy is provided in supplemental Material 2. We also reviewed the reference lists in relevant articles and reviews.
Study selection
We used the following eligibility criteria for the outcomes studies:
Studies: Prospective studies, cross-sectional studies, cohort studies from January 1974 to May 2019, and abstracts and conference posters after 2014
Participants: All adult patients (age ≥18 years) suspected of having a symptomatic first or recurrent PE in an outpatient or inpatient setting
Inclusion criteria: Studies assessing all-cause mortality, mortality from VTE, development of PE or DVT, development of recurrent PE, CTEPH, major bleeding, and intracranial hemorrhage in patients with suspected first or recurrent episode of PE
Language: We included studies published in any language.
Publication status: We reviewed all published and unpublished studies. Abstracts with relevant information were also reviewed.
Exclusion criteria: Studies that did not assess or provide information on the outcomes of interest, narratives, letters to editor without primary data, abstracts before 2014, duplicate populations, conference posters, and studies with missing or incomplete outcomes results
We used the following eligibility criteria for test accuracy studies4 :
Studies: Prospective studies, cross-sectional studies, cohort studies from January 1974 to May 2019, and abstracts and conference posters after 2014
Participants: All adult patients (age ≥18 years) suspected of having a symptomatic first or recurrent PE in an outpatient or inpatient setting
Inclusion criteria: Studies assessing test accuracy of VQ scan, multidetector CTPA, compression US (CUS), and D-dimer assays (VIDAS, STA Liatest, Tina-quant, INNOVANCE, HemosIL) to diagnose a first or recurrent episode of symptomatic PE
Language: We included studies published in any language
Publication status: We reviewed all published and unpublished studies. Abstracts with relevant information were also reviewed.
Exclusion criteria: Studies that did not assess test accuracy or had missing data, narrative reviews, letters to the editor with no primary data, abstracts, conference posters, duplicate populations, studies that included <100 patients, patients who were asymptomatic or pregnant, and pediatric patients (studies with age <18 years, or if >80% of the population is younger than 18 years, or if the mean age of the population was <25 years) were excluded. We also excluded studies that used unacceptable reference standards (CUS, impedance plethysmography) and those evaluating VQ single-photon emission computed tomography (SPECT), transthoracic ultrasound, single-detector computed tomography (CT), impedance plethysmography, D-dimer assays with unapproved cutoff points, or D-dimer assays that are no longer in use or are not highly sensitive (MDA, Asserachrom, Dimertest I, Enzygnost, Fibrinostika FbDP, ACCULOT, Wellcotest, Minutex, SimpliRED). Finally, we excluded studies evaluating VQ test accuracy prior to 2000, unless an earlier study included a screening process with chest x-ray or other testing prior to VQ testing, as well as studies that did not provide a breakdown of the VQ scan interpretation (normal, low/intermediate, and high probability).
Data extraction and quality assessment
Two investigators (Parth Patel/M. Bhatt and Payal Patel) independently extracted data using a pilot tested and standardized form. Results of data extraction were compared, and any discrepancy was resolved by discussion. A third reviewer (R.A.M.) reviewed all studies’ extractions and assessments. When the same results were presented in >1 publication, we included the publication with the most complete results. If results were incomplete or unclear, we contacted the study investigators for additional information. We collected the following information from each study: study characteristics (investigators name, year of publication, country, language, number of centers, number of countries, inclusion and exclusion criteria), patient characteristics (number, patients completing follow-up, age, and comorbidities), diagnostic tests used and comparison characteristics (how test was performed and interpreted), codiagnostic test(s) used, and outcomes. We collected information about funding sources, conflict-of-interest statements, consent, and ethics approval.
Data synthesis and analysis
The outcomes information from each study was combined quantitatively from different studies and reviews. Information was abstracted with respect to those diagnostic pathways determined to be of interest by the panel in the primary test accuracy systematic review (Table 1). The data were further stratified by PTP and by patients who were anticoagulated (TP/FP) compared with those who were not anticoagulated (TN/FN). This information was compared with the information abstracted from additional resources, such as systematic reviews, treatment guidelines that reviewed outcomes, a targeted search of general outcomes studies, and a survey of panel opinion (Table 2).
Outcomes in patients with suspected PE from test accuracy studies
| Pathway* | Test | Mortality: all-cause | Mortality: from PE at 3 mo | Incidence of PE at 3 mo | Incidence of DVT at 3 mo | Overall VTE at 3 mo | CTEPH | Major bleeding | Hemorrhagic stroke |
|---|---|---|---|---|---|---|---|---|---|
| Anticoagulated (TP/FP population) | |||||||||
| A | Positive CT | 2/107 (1.87%; 95% CI, 0-4.44) | 7/105 (6.67%; 95% CI, 1.89-11.44) | 0/105 (0%) | 0/105 (0%) | 0/105 (0%) | NR | NR | NR |
| L | Positive DD → positive CT | 21/598 (3.51%; 95% CI, 2.04-4.99) | 0/598 (0%) | 0/598 (0%) | 0/598 (0%) | 0/598 (0%) | NR | NR | NR |
| L/A | Low PTP: positive DD → positive CT High PTP: positive CT | 62/853 (7.27%) | 12/853 (1.40%) | 15/853 (1.76%) | 7/853 (0.82%) | 22/853 (2.58%) | NR | 2/180 (1.11%) | NR |
| J | High prob VQ or nondiagnostic VQ → positive CUS | 6/41 (14.6%; 95% CI, 3.82-25.45) | 0/41 (0%) | 0/41 (0%) | 0/41 (0%) | 0/41 (0%) | NR | 0/41 (0%) | NR |
| Not anticoagulated (TN/FN population) | |||||||||
| A | Negative CT (int PTP) | 38/381 (9.97%; 95% CI, 6.96-12.98) | 1/748 (0.13%; 95% CI, 0-0.40) | 1/748 (0.13%; 95% CI, 0-0.40) | 1/748 (0.13%; 95% CI, 0-0.40) | 2/748 (0.27%; 95% CI, 0-0.64) | NR | NR | NR |
| A | Negative CT (high PTP) | 3/325 (0.92%; 95% CI, 0-1.96) | 0/651 (0%) | 8/1302 (0.61%; 95% CI, 0.19-1.04) | 3/1302 (0.23%; 95% CI, 0-0.49) | 11/1302 (0.84%; 95% CI, 0.35-1.34) | NR | NR | NR |
| K | Negative DD (low PTP) | NR | 0/808 (0%) | 4/1094 (0.37%; 95% CI, 0.007-0.72) | 0/808 (0%) | 4/1094 (0.37%; 95% CI, 0.007-0.72) | NR | NR | NR |
| K | Negative DD (int PTP) | 12/2387 (0.50%; 95% CI, 0.22-0.79) | 0/2747 (0%) | 13/3015 (0.43%; 95% CI, 0.20-0.66) | 1/3015 (0.03%; 95% CI, 0-0.12) | 14/3015 (0.46%; 95% CI, 0.22-0.71) | NR | NR | NR |
| K | Negative age-adjusted DD (low/int PTP) | 7/331 (2.11%; 95% CI, 0.56-3.66) | 0/331 (0%) | 1/331 (0.30%; 95% CI, 0-0.89) | 0/331 (0%) | 1/331 (0.30%; 95% CI, 0-0.89) | NR | NR | NR |
| L | Positive DD → negative CT (int PTP) | NR | 2/294 (0.68%; 95% CI, 0-1.62) | 3/294 (1.02%; 95% CI, 0-2.17) | 2/294 (0.68%; 95% CI, 0-1.62) | 5/294 (1.70%; 95% CI, 0.22-3.18) | NR | NR | NR |
| L | Positive age-adjusted DD → negative CT (int PTP) | 17/1243 (1.37%; 95% CI, 0.72-2.01) | 0/1243 (0%) | 6/1243 (0.48%; 95% CI, 0.10-0.87) | 0/1243 (0%) | 6/1243 (0.48%; 95% CI, 0.10-0.87) | NR | NR | NR |
| L/A | Low PTP: positive DD → negative CT High PTP: negative CT | 162/2566 (6.31%; 95% CI, 5.37-7.25) | 8/2497 (0.32%; 95% CI, 0.10-54) | 13/2486 (0.52%; 95% CI, 0.24-0.81) | 14/2486 (0.56%; 95% CI, 0.27-0.86) | 27/2486 (1.09%; 95% CI, 0.68-1.49) | NR | 1/627 (0.16%; 95% CI, 0-0.47) | NR |
| J/N | Low PTP: negative DD High PTP or positive DD: normal VQ scan or nondiagnostic → negative US | NR | 0/95 (0%) | 0/95 (0%) | 0/95 (0%) | 0/95 (0%) | NR | NR | NR |
| J | Normal VQ scan or nondiagnostic → negative US (int PTP) | 5/73 (6.85%; 95% CI, 1.05-12.64) | 0/73 (0%) | 9/82 (10.98%; 95% CI, 4.21-17.74) | 0/82 (0%) | 9/82 (10.98%; 95% CI, 4.21-17.74) | NR | NR | NR |
| I/J | Normal VQ scan (int PTP) | NR | NR | 4/354 (1.13%; 95% CI, 0.03-2.23) | 0/354 (0%) | 4/354 (1.13%; 95% CI, 0.03-2.23) | NR | NR | NR |
| Positive DD → normal VQ | NR | 0/144 (0%) | 1/144 (0.69%; 95% CI, 0-2.05) | 1/144 (0.69%; 95% CI, 0-2.05) | 2/144 (1.39%; 95% CI, 0-3.30) | NR | NR | NR | |
| I/J | Nonhigh VQ scan (no follow-up test, int PTP) | NR | NR | 64/737 (8.68%; 95% CI, 6.65-10.72) | 0/737 (0%) | 64/737 (8.68%; 95% CI, 6.65-10.72) | NR | NR | NR |
Data are from 22 studies11-32 with 15 865 patients.
DD, D-dimer; int, intermediate; NR, not reported; prob, probability.
Pathways (denoted by letters) with diagrams are in supplemental Material 1.
Outcomes in patients with suspected PE (data from various sources)
| Test accuracy results | Consequences | Results from published SR36 | Results from treatment guideline, %37 | Targeted search of outcomes studies38 | Panel survey results (1 y), % |
|---|---|---|---|---|---|
| TP | Mortality: all cause | NR | 2.0 (6 mo) | 9.8% (3 mo) Recurrent PE population: 46.8% (3 mo) | 11.3 |
| Mortality: from PE at 3-6 mo | 1.5% (3 mo) | 0.1 (6 mo) | 2.8% (3 mo) Recurrent PE population: 51.9% (3 mo) | ||
| Recurrence of PE on anticoagulation | NR | 1.0 (6 mo) | 3.7% (3 mo) | 3.0 | |
| CTEPH | NR | NR | NR | 4.2 | |
| Major bleeding | NR | 2.1 (6 mo) | 5.2% (1 mo), 6.7% (3 mo) | 3.3 | |
| Fatal major bleeding | NR | 0.2 (6 mo) | NR | ||
| Hemorrhagic stroke | NR | NR | 0.6% (3 mo) | 1.7 | |
| FP | Mortality: all cause | NR | NR | ||
| Major bleeding | NR | 2.1 (6 mo) | 6.7% (3 mo) | 3.3 | |
| Fatal major bleeding | NR | 0.2 (6 mo) | NR | NR | |
| TN | Mortality: from PE at 3 mo | NR | NR | 0.2% (3 mo) | NR |
| FN | Mortality: all cause | NR | NR | 40.0% (3 mo) | 30.5 |
| Mortality: from PE at 3-12 mo | NR | NR | 5.0% (3 mo) | 27.8 | |
| Recurrence of PE at 3-12 mo | NR | NR | NR | 23 |
SR, systematic review.
Results
Search results
Among the 16 844 nonduplicate records identified from the electronic database search, 376 full-text articles were retrieved after title and abstract screening. After exclusion of articles that were not relevant, 22 studies were included in the outcomes analysis.11-32 A summary of the outcomes is presented below, with detailed abstraction available in supplemental Material 3.
PE
In patients diagnosed with PE and initiated on anticoagulation (TP or FP patients), 3-month follow-up revealed that all-cause mortality was 5.69% (91/1599; 95% confidence interval [CI]: 4.56-6.83), mortality from PE was 1.19% (19/1597%; 95% CI: 0.66-1.72), recurrent VTE occurred in 1.38% (22/1597; 95% CI: 0.81-1.95), and major bleeding occurred in 0.90% (2/221; 95% CI: 0-2.15). Further stratification by diagnostic pathway is presented in Table 1.
For patients with negative diagnostic testing who did not receive anticoagulant treatment (TN or FN patients), outcome information must be interpreted with respect to PTP and the diagnostic algorithm assessed. In patients with a low PTP and negative D-dimer, 3-month follow-up revealed that mortality from PE was 0% (0/808) and the incidence of VTE was 0.37% (4/1094; 95% CI: 0.007-0.72). In patients with intermediate PTP and negative D-dimer, 3-month follow-up revealed that mortality from PE was 0% (0/2747) and the incidence of VTE was 0.46% (14/3015; 95% CI: 0.22-0.71). In patients with negative age-adjusted D-dimer and low to intermediate PTP, 3-month follow-up revealed that mortality from PE was 0% (0/331) and the incidence of VTE was 0.30% (1/331; 95% CI: 0-0.89). In patients with intermediate PTP and negative CTPA, 3-month follow-up revealed that mortality from PE was 0.13% (1/748; 95% CI: 0-0.40) and incidence of VTE was 0.27% (2/748; 95% CI: 0-0.64). In patients with high PTP and negative CTPA, 3-month follow-up revealed that mortality from PE was 0% (0/651) and the incidence of VTE was 0.84% (11/1302; 95% CI: 0.35-1.34).
When evaluating diagnostic algorithms, 1 of the most used pathways involves patients with positive D-dimer results followed by a CTPA. For patients with a positive D-dimer followed by a negative CTPA, 3-month follow-up revealed that mortality from PE was 0.68% (2/294; 95% CI: 0-1.62) and the incidence of VTE was 1.470% (5/294; 95% CI: 0.22-3.18). When adding PTP into the diagnostic algorithm, another common pathway involves patients with a low PTP starting with a D-dimer followed by CTPA if D-dimer is positive and patients with a high PTP starting directly with CTPA. For patients with negative testing at the end of this pathway, 3-month follow-up revealed that mortality from PE was 0.32% (8/2497; 95% CI: 0.10-54) and incidence of VTE was 1.09% (27/2486; 95% CI: 0.68-1.49). Additional diagnostic pathways are presented in Table 1.
Additional sources of data
This information was compared with the information abstracted from additional resources, such as suggested systematic reviews, treatment guidelines that reviewed outcomes, a targeted search of general outcomes studies, and a survey of panel opinion (Table 2).
Patients discharged with anticoagulation had an all-cause mortality of 2.0% at 6 months from a VTE treatment guideline, 9.8% at 3 months from a targeted search of outcome studies, and 11.3% at 1 year from a survey of the panel members. Mortality from PE was reported to be 1.5% at 3 months from a published systematic review, 0.1% at 6 months from a VTE treatment guideline, and 2.8% at 3 months from a targeted search of outcomes studies. Recurrent PE patients had an increase in all-cause mortality to 46.8% and an increase in mortality from PE to 51.9% based on a targeted search of outcome studies. Major bleeding was reported in 2.1% at 6 months by the VTE treatment guideline, 6.7% at 3 months by a targeted search of outcomes studies, and 3.3% at 1 year from a survey of panel members.
For patients who were discharged appropriately without treatment because of negative diagnostic testing (true-negative patients), mortality from PE was reported to be 0.3% at 3 months by a targeted search of outcomes studies. For patients who were discharged inappropriately without treatment because of negative diagnostic testing (false-negative patients), all-cause mortality from PE was 5.0% at 3 months from a targeted search of outcomes studies and 27.8% at 1 year from a survey of panel members. Additional information is provided in Table 2.
Discussion
A variety of tests can be used in the diagnosis of suspected PE, and these tests can be used in isolation or in combination in a diagnostic pathway to rule in or exclude a diagnosis. This review is 1 of the first to provide a systematic overview of patient-important outcomes in patients with suspected PE, both overall and associated with different diagnostic strategies. The findings can assist decision makers with estimating impacts on patients and help researchers to identify gaps and plan for adequately powered studies with outcomes beyond diagnostic accuracy.
In patients diagnosed with PE and started on anticoagulation, a population composed of true-positive and false-positive patients, 3-month follow-up revealed that mortality from PE was 1.19% (19/1597), the rate of recurrent VTE was 1.38% (22/1597), and major bleeding occurred in 0.90% (2/221). The lack of major bleeding may relate to the fact that identified studies primarily focused on test accuracy of VTE and, thus, are typically shorter in duration. Therefore, these studies may not have adequately captured bleeding outcomes, and bleeding rates may be underreported. This contrasts with findings from a VTE treatment guideline and targeted search of outcomes studies listed in Table 2, which reported rates of 2.1% and 5.2%, respectively.
For many years, the gold standard for diagnosis of PE was pulmonary angiography. Outcomes studies performed in patients with a negative pulmonary angiography revealed a 1.7% incidence of VTE at 3-month follow-up.33 This figure is used to validate current PE diagnostic algorithms. For patients with a low or intermediate PTP and negative D-dimer, 3-month follow-up revealed no deaths from PE and <0.5% incidence of VTE, thus demonstrating that D-dimer can be a safe option for both populations. In addition, age-adjusted D-dimer appears to be a safe option in low or intermediate PTP based on a 3-month mortality of 0% (0/331) and a VTE incidence rate of 0.30% (1/331). In patients with high PTP and negative CTPA, there was no death from PE, and the incidence of VTE was 0.84% (11/1302) at 3 months. A diagnostic pathway that is commonly used involves patients with low PTP starting with D-dimer, followed by CTPA if D-dimer is positive, whereas patients with high PTP start directly with CTPA. This pathway appears to be safe: mortality from PE was 0.32% (8/2497), and the incidence of VTE was 1.09% (27/2486). Safety of VQ scan pathways is difficult to determine because nondiagnostic results were treated as negative results, which increased the mortality and the incidence of VTE findings.
This review has several strengths. The comprehensive search makes it unlikely that relevant studies were missed. All steps, including initial screening, study selection, and data abstraction, were performed independently in duplicate to minimize any potential biases. Additionally, we did not limit our review by language, and we translated non-English articles. We analyzed sources of bias and explored reasons for diversity in the published literature. Outcomes were stratified by PTP and the diagnostic pathway used to assist in decision-making capacity. When compared with other systematic reviews, which typically reviewed consecutive patients with DVT or PE in the Registry Informatizado de la Enfermedad TromboEmbólica, outcomes were reported without stratification.34,35
There are a few limitations of the present review. The sample size of the patients from the test accuracy studies were often too small to accurately assess outcomes. In addition, when outcomes are reported in accuracy studies, they generally focus on the safety among patients who were designated as negative, thus outcomes are primarily reported in patients with negative testing. The bleeding risks in patients with positive testing and treatment with anticoagulation may not have been scrutinized to the same degree. Furthermore, unlike therapeutic studies, diagnostic accuracy studies are not typically designed to capture outcomes. Therefore, definitions of outcomes, methods of measurements, and duration of follow-up may not have been clear or consistent across studies. This may lead to under- or overreporting of events. Finally, in most instances, there was no direct evidence that assessed the effect of using 1 diagnostic pathway vs another on patient outcomes or directly compared the accuracy of different diagnostic pathways. In some circumstances in which the diagnostic pathway of interest was evaluated, details regarding the specific number of patients for each pathway were not provided. Additionally, in many instances, the review was limited to the outcomes reported in the studies, which differed from the prioritized outcomes by the guideline panel. To combat this limitation, the original guideline publication compared the test accuracy of diagnostic tests in sequence to individual diagnostic tests alone (ie, D-dimer followed by CT in contrast to D-dimer alone), further characterized by PTP into low, intermediate, and high PTP. The final recommendations for a diagnostic pathway were based on information provided in this review on patient-centered outcomes and were based on information provided in the test accuracy review.4 In addition to these reviews, the panel considered information on the overall certainty in the evidence, including certainty in the accuracy of the diagnostic test results, patients’ values and preferences, balance of desirable and undesirable effects, resource implications, feasibility, acceptability, and equity considerations.
Acknowledgments
This systematic review was conducted to support the development of the “American Society of Hematology 2018 Guidelines for Management of Venous Thromboembolism: Diagnosis of Venous Thromboembolism.” The entire guideline-development process was funded by the American Society of Hematology. Some researchers received a salary (Parth Patel, C.B., M. Bhatt, W.W., Payal Patel, H.B., and J.V.) or grant support (R.A.M. and H.S.) through the McMaster GRADE Center, whereas others participated to fulfill requirements of an academic degree or program or volunteered time.
Authorship
Contribution: Parth Patel designed the study and the search strategy, selected studies, extracted data, performed statistical analyses, and wrote the manuscript; Parth Patel, M. Bhatt, C.B., H.B., R.N., and Payal Patel designed the study, selected studies, extracted data, performed statistical analyses, and revised the manuscript; R. Kathib, C.C.M., Y.Z., I.E.-I., J.V., H.A., W.B., M. Baig, R. Kehar, A.M., R.P., A.S., M.T., and D.W. selected studies, extracted data, and performed statistical analyses; and W.W., W.L., S.M.B., E.L., G.L.G., M.R., H.S., L.B.H., J. K., and R.A.M. designed the study design, interpreted the results, and revised the manuscript.
Conflict-of-interest disclosures: The authors declare no competing financial interests.
Correspondence: Reem A. Mustafa, Division of Nephrology and Hypertension, Department of Medicine, University of Kansas Medical Center, 3901 Rainbow Blvd, MS3002, Kansas City, KS 66160; e-mail: ramustafa@gmail.com.

