

Key Points
Low levels of fatty acid elongase ELOVL6 are associated with resistance to BTZ in patient and cultured MM cells.
Changes in the ELOVL6-dependent lipidome modulate response and resistance of MM cells to BTZ.

Abstract
Resistance to the proteasome inhibitor bortezomib (BTZ) represents a major obstacle in the treatment of multiple myeloma (MM). The contribution of lipid metabolism in the resistance of MM cells to BTZ is mostly unknown. Here we report that levels of fatty acid elongase 6 (ELOVL6) were lower in MM cells from BTZ-nonresponsive vs BTZ-responsive patients and in cultured MM cells selected for BTZ resistance compared with parental counterparts. Accordingly, depletion of ELOVL6 in parental MM cells suppressed BTZ-induced endoplasmic reticulum (ER) stress and cytotoxicity, whereas restoration of ELOVL6 levels in BTZ-resistant MM cells sensitized them to BTZ in tissue culture settings and, as xenografts, in a plasmacytoma mouse model. Furthermore, for the first time, we identified changes in the BTZ-induced lipidome between parental and BTZ-resistant MM cell lines underlying a functional difference in their response to BTZ. We demonstrated that restoration of ELOVL6 levels in BTZ-resistant MM cells resensitized them to BTZ largely via upregulation of ELOVL6-dependent ceramide species, which was a prerequisite for BTZ-induced ER stress and cell death in these cells. Our data characterize ELOVL6 as a major clinically relevant regulator of MM cell resistance to BTZ, which can emerge from the impaired ability of these cells to alter ceramide composition in response to BTZ.
Introduction
Multiple myeloma (MM) is a malignancy of bone marrow plasma cells (PCs) that accounts for ∼13% to 15% of all hematological malignancies.1 In the past decades, significant progress has been achieved in treating MM patients with proteasome inhibitors in combination with immunomodulatory drugs.2 However, MM remains largely incurable because of emerging resistance to proteasome inhibitors, the mechanisms of which are not well understood.3
Bortezomib (BTZ),4 the first-in-class proteasome inhibitor, has been thought to act primarily through the inhibition of protein degradation, leading to the accumulation of misfolded and unfolded proteins, which subsequently induce endoplasmic reticulum (ER) stress.5 ER stress triggers a multifaceted program termed the unfolded protein response (UPR) to restore ER homeostasis.6 However, unmitigated ER stress results in cell death, which is activated by the same UPR components.7
Importantly, the ER is also a primary site for lipid biosynthesis, and certain lipids have been known to cause lipotoxic ER stress, resulting in the activation of UPR and cell death.8 Therefore, it is conceivable that BTZ-induced changes in lipid composition may lead to perturbations in ER homeostasis that contribute to overall BTZ cytotoxicity. Conversely, suppression of such perturbations may represent a mechanism of BTZ resistance.
Among the ER-synthesized lipids, ceramides have been frequently implicated in the induction of apoptosis,9 although several reports have demonstrated a prosurvival function of ceramides,10 making their role in in cell survival unclear. Ceramides consist of a sphingosine long-chain base and a fatty acyl chain.11 In mammals, ceramide levels and composition are regulated by ceramide synthases (CERS1-6), which catalyze the coupling of sphinganine to fatty acids (FAs) with variable chain lengths.12 It has been suggested that the prosurvival vs proapoptotic function of ceramides depends on their FA composition.13
ELOVL6 catalyzes the elongation of long-chain saturated and monounsaturated FAs from a chain length of 16 to 18 carbon atoms.14 The involvement of ELOVL6 in regulation of cell death seems to be controversial, with different articles reporting that both depletion/deficiency and overexpression of ELOVL6 may cause lipotoxicity as a result of the perturbed balance of saturated and monosaturated C16 or C18 FAs.15-18 The role of lipid metabolism in resistance of MM cells to BTZ is virtually unknown,19,20 as is the function of ELOVL6 in the regulation of ceramide composition as a mediator of BTZ-induced ER stress and cell death. Here, we combined patient- and cell line–based gene expression profiling with lipidomic and functional genetic analyses and identified ELOVL6 as a clinically relevant regulator of BTZ resistance in MM.
Methods
Cell lines
Parental and resistant human MM cells RPMI8226, ANBL-6, and KAS6/1 were a gift from Robert Z. Orlowski (MD Anderson Cancer Center).21 Human MM cell lines MM.1S, RPMI-8226, KMS11, and ARH77 were purchased from American Type Culture Collection. HEK293FT cells were purchased from Clonetech (Mountain View, CA) and cultured in Dulbecco’s modified Eagle medium (Invitrogen, Carlsbad, CA) supplemented with 10% fetal bovine serum (FBS), 2 mM glutamine, and penicillin-streptomycin antibiotics. MM cells were cultured in RPMI (Invitrogen), supplemented with 10% FBS or 10% delipidated FBS, 2 mM glutamine, 10 mM N-2-hydroxyethylpiperazine-N′-2-ethanesulfonic acid (pH, 7.4), nonessential amino acids, 1 mM sodium pyruvate, and penicillin-streptomycin antibiotics. To generate BTZ-resistant cell lines (MM.1S-R, RPMI-8226-R, KMS11-R, and ARH77-R), naïve MM cells were cultured in the presence of increasing concentrations of BTZ (from 1 to 8 nM) for over 6 months. During this period, media and BTZ were replenished every 2 to 3 days. Naïve cells were passaged for the same period of time in BTZ-free media. Resistant cells were maintained in BTZ-free media for at least 3 weeks before being used in the experiments. All cell lines were authenticated and verified as mycoplasma free using the MycoAlert mycoplasma detection kit (catalog #LT07-318; Lonza, Allendale, NJ).
Cell viability assays
MM cells were seeded at 2 × 10⁵ cells per mL in 12-well plates and treated with the indicated BTZ doses. At the indicated time points, cell viability was assessed by live cell counts with trypan blue exclusion or either a SYTOX (SYTOX Dead Cell Stains Protocol; Thermo Fisher Scientific, Waltham, MA) or WST-1 assay (Millipore Sigma). Experiments were performed in triplicates and repeated at least two times.
For SYTOX, cells were harvested into 5-mL flow cytometric tubes and washed in phosphate-buffered saline (PBS), spinning down at 1400 rpm for 4 minutes. Supernatant was decanted, and cells were resuspended in 200 μL of PBS with a 1:1000 dilution of the SYTOX stain. Cells were incubated for 20 minutes at room temperature in the dark and taken immediately for flow cytometric analysis using a BD FACSCanto II as per manufacturer instructions; 10 000 events were recorded per sample.
For the WST-1 assay, cells were harvested into 1.5-mL centrifuge tubes and spun at 2000 rpm for 5 minutes. Media was aspirated off, and cells were resuspended in warm RPMI 1640 containing 10% serum at a concentration of 1 × 10⁶ cells per mL; 90 μL of cell suspension was added to individual wells in a 96-well plate in triplicate, and 10 μL of WST-1 reagent was added to each well individually. Cells were then incubated at 37°C for 4 hours before spectrophotometric evaluation of absorbance as per manufacturer instructions.
Reagents
BTZ was purchased from Selleckchem (Houston, TX) and dissolved in dimethyl sulfoxide. Ceramides were purchased from Avanti Polar Lipids (Alabaster, AL). Ceramides were added to the media as a 50% ethanol solution in water.
Immunoblotting
Whole-cell extracts were prepared and analyzed as previously described.22 The following antibodies were used: ELOVL6 (ABS458; EMD Millipore; 1:300 dilution), sterol regulatory element binding transcription factor 1 (SREBP1; SC-367; Santa Cruz Biotechnology; 1:500), glyceraldehyde-3-phosphate dehydrogenase (HRP-60004; Proteintech; 1:2500), BiP (3177; Сell Signaling; 1:500), ATF4 (10835-1-AP; Proteintech; 1:1000), and XBP1s (SC-8015; Santa Cruz Biotechnology; 1:500).
Plasmids and infection
The pCMVdeltaR8.2 and pCMV-VSV-G vectors were purchased from Addgene (Cambridge, MA). The pLV-SV4-puro lentiviral vector was obtained from Peter Chumakov (Cleveland Clinic, Cleveland, OH). SREBP1 short hairpin RNAs (shRNAs; TRCN0000422088 and TRCN0000434619) and ELOVL6 shRNAs (TRCN0000278466 and TRCN0000278463) were purchased from Millipore Sigma (Burlington, MA). SREBP1 ORF lentiviral vector was purchased from Addgene (32017). ELOVL6 ORF lentiviral vector (EX-T0392-Lv105) was purchased from GeneCopoeia (Rockville, MD). Infections were performed as previously described.22
Quantitative real-time PCR
Total cellular RNA was isolated using the RNeasy Mini Kit (Qiagen, Valencia, CA). Complementary DNA (cDNA) was prepared using a cDNA reverse transcription kit (Invitrogen). Quantitative reverse transcription polymerase chain reaction (PCR) was performed on the QS6 Fast Real-Time PCR System (Thermo Fisher Scientific) using either SYBR Green Master Mix or TaqMan Master Mix (Invitrogen) and the following probes and primers: Hs-CERS5-Fwd 5′-tattgccaaaccctgtgcac, Hs-CERS5-Rev 5′-aatccagctgctttgacagg, Hs-CERS6-Fwd 5′-acaaattgctccgcccaat, and Hs-CERS6-Rev 5′-aaaccagcgctgaatgcttc. PCR data were analyzed using QuantStudio Real-Time PCR software (Thermo Fisher Scientific).
Untargeted lipidomic analysis
Measurements were performed in independent biological triplicates. Genetically modified untreated cells were growing exponentially before collection. BTZ-treated cells were collected at least 8 hours before the onset of cell death. Cell death was assessed by trypan blue before collection and never exceeded cell death in control populations. Approximately 106 cells were suspended in 200 μL of methanol and transferred to a tube containing 0.8-mm glass beads; 400 μL of chloroform was added to the tube, which was mixed using a bead mill homogenizer for lipid extraction. The supernatant isolated by centrifugation at 16 000× g for 5 minutes was dried under nitrogen at room temperature. The residue was reconstituted in 100 μL of isopropyl alcohol/methanol (1:1) for lipidomic analysis. Liquid chromatography–tandem mass spectrometry (MS) analysis was performed on a high-resolution Q Exactive HF Hybrid Quadrupole-Orbitrap mass spectrometer (Thermo Fisher Scientific) equipped with the Heated Electrospray Ionization II source (Thermo Fisher Scientific, Rockford, IL) and coupled with the Vanquish UHPLC System (Thermo Fisher Scientific). Ion source parameters were as follows: sheath gas flow rate, 40 L per minute; auxiliary gas flow rate, 5 L per minute; spray voltage, 3.5 and 3.0 kV for the positive and negative modes, respectively; capillary temperature, 350°C; and S-lens radiofrequency voltage, 75 V. The chromatographic separation of lipids was performed on the Accucore C30 column (3 × 150 mm; 2.6 μm) using a linear gradient with 60:40 acetonitrile/water (mobile phase A) and 90:10 isopropyl alcohol/acetonitrile (mobile phase B), both of which contain 0.1% formic acid and 10 mM ammonium formate. MS spectra were acquired by data-dependent scans in positive and negative modes. A survey scan was performed at the MS1 level to identify the top-10 most abundant precursor ions, followed by MS2 scans where product ions were generated from selected ions. High-energy collisional dissociation was used for ion fragmentation, with stepped collision energy of 25/30 and 30/50/100 eV in each positive and negative polarity. The dynamic exclusion option was enabled during data-dependent scans to enhance compound identification in complex mixture. Acquired spectra were processed using LipidSearch software (version 4.2; Thermo Fisher Scientific, Rockford, IL), with selection of the following classes of lipids: lysophosphatidylcholine, phosphatidylcholine, lysophosphatidylethanolamine, phosphatidylethanolamine, lysophosphatidylserine, phosphatidylserine, lysophosphatidylglycerol, phosphatidylglycerol, lysophosphatidylinositol, phosphatidylinositol, lysophosphatidic acid, phosphatidic acid, sphingomyelin, phytosphingosine, monoglyceride, diglyceride, triglyceride, (O-acyl)-1-hydroxy FA, cardiolipin, sphingoshine, sphingoshine phosphate, glucosylsphingosine, monoglycosylceramide, diglycosylceramide, triglycosylceramide, ceramides, monosialotetrahexosylganglioside, cholesteryl ester, zymosteryl, stigmasteryl ester, sitosteryl ester, coenzymes, monogalactosylmonoacylglycerol, monogalactosyldiacylglycerol, digalactosylmonoacylglycerol, digalactosyldiacylglycerol, sulfoquinovosylmonoacylglycerol, and sulfoquinovosyldiacylglycerol. Parameters for the product search workflow were as follows: precursor mass tolerance, 5 ppm; product mass tolerance, 5 ppm; product ion intensity threshold, 1.0% relative to precursor; and matching score threshold, 2.0. For FA identification, data were searched with a single selection of only FA class in the database with following parameters: product ion intensity threshold, 0.1% relative to precursor; and matching score threshold, 0.
Experiments with mice
All experiments involving animals were approved by the Institutional Animal Care and Use Committee. Genetically modified MM.1S and RPMI 8226 cells (5.0 × 10⁶ cells per flank) were inoculated subcutaneously in both flanks of 4- to 6-week-old female NOD/Shi-scid interleukin-2 receptor γ null (NOG) mice (n = 5 per group). When tumors reached a volume of approximately 100 mm3, the animals were randomized to 1 of 2 groups (n = 5 per group) and treated with daily intraperitoneal injections of vehicle in PBS or BTZ in PBS (0.5 mg/kg). Tumor volumes were recorded every 2 days, and mice were euthanized when the tumor volume reached 2 cm3 or when a tumor became ulcerated.
Statistical analysis and databases
Each experiment was performed at least 2 independent times, and the results are expressed as average ± standard errors of the mean unless otherwise noted. Statistical analysis was performed using Student t test. A 2-tailed P value < .05 was considered statistically significant for all analyses. Gene expression data along with annotations were downloaded from the National Center for Biotechnology Information Gene Expression Omnibus database (GSE9782) and analyzed as we previously reported.23 The responder and nonresponder populations within each therapy group were compared using the 2-tailed Wilcoxon/Mann-Whitney test to determine statistical significance. Microsoft R Open (version 3.5.1) software was used for hierarchical clustering and heatmap generation.
Results
Decreased levels of ELOVL6 in MM cells correlate with resistance to BTZ in MM patients and cell lines
To identify genes involved in the regulation of BTZ resistance, we used a twofold approach. First, we performed a global RNA sequencing–based gene expression analysis in 3 cell line pairs of previously reported parental and BTZ-resistant MM cell lines (RPMI8226, ANBL-6, and KAS61).21 Next, we overlapped the list of genes whose expression significantly changed in at least 2 of 3 cell line pairs (supplemental Table 1) with the list of genes associated with response to BTZ in MM patients24 (supplemental Table 2). The latter list was generated using a data set that contained information on global gene expression in MM cells collected before patient treatment with BTZ or dexamethasone that was correlated with patient response to the drugs.24
As a result, 70 genes were identified whose expression levels were different with high statistical significance in BTZ-resistant vs parental MM cell lines and in MM cells from BTZ-nonresponsive vs BTZ-responsive patients (supplemental Table 3). Of note, among genes downregulated in patient- and cell line–based databases was transcription factor KLF9, which has been shown to mediate BTZ cytotoxicity in MM cells23 (supplemental Table 3). Furthermore, the transcription factor IRF4, which has been associated with resistance to BTZ,25 was among the genes upregulated in both databases (supplemental Table 3). In addition, 2 of the identified genes control de novo biosynthesis of FAs (ELOVL626 and FA desaturase 127 ). Both genes were downregulated in BTZ-resistant MM cells and in MM cells from BTZ-nonresponsive patients (supplemental Tables 1 and 3). ELOVL6 expression was also undetectable in a majority of primary samples taken from MM patients in contrast to normal PCs and cells isolated from patients with smoldering myeloma or monoclonal gammopathy of unknown significance (supplemental Figure 1).
We were intrigued by the possibility that alterations in FA metabolism regulate MM resistance to BTZ, because this biological pathway or lipid metabolism in general has not been functionally implicated in MM resistance to proteasome inhibitors. For further analysis, we focused on ELOVL6 because of its central role in metabolism of the 2 most abundant saturated and monounsaturated FAs (C16 and C18)14 and the fact that ELOVL6 levels differed with the highest statistical significance between MM cells from BTZ-responsive and BTX-nonresponsive MM patients according to a Wilcoxon/Mann-Whitney test (Figure 1A; supplemental Table 3). At the same time, no difference in ELOVL6 levels were detected between MM patients responsive or nonresponsive to dexamethasone treatment (Figure 1A).

Expression of ELOVL6 correlates with response to BTZ in MM patients and resistance to BTZ in cultured MM cells. (A) Expression of ELOVL6 in patient MM cells was determined using the GSE9782 data set between patients responsive (R) or nonresponsive (NR) to BTZ (R, n = 85; NR, n = 78) or dexamethasone (DEX) (R, n = 28; NR, n = 39). Probes for ELOVL6 were extracted based on the annotation from Affymetrix (shown above the plots). The 2-tailed Wilcoxon/Mann-Whitney test was used to determine statistical significance. P values between R and NR are shown above each therapy group. (B) Parental and BTZ-resistant MM cell lines with the following BTZ 50% inhibitory concentrations were used: MM.1S-P, 6 nM; MM.1S-R, 10 nM; RPMI8226-P, 3 nM; RPMI8226-R, 15 nM; KMS11-P, 6 nM; KMS11-R, 20 nM; ARH77-P, 8 nM; and ARH77-R, 25 nM. BTZ-resistant cells were collected 3 weeks after selection. Total cell extracts of logarithmically growing parental (P) and BTZ-resistant (R) cells were probed in immunoblotting with designated antibodies. ELOVL6-specific signals were normalized by glyceraldehyde-3-phosphate dehydrogenase (GAPDH)–specific signals and by ratio of these signals in corresponding parental cells. Shown immunoblots are representative images of at least 2 independent experiments. NS, nonsignificant.
Expression of ELOVL6 correlates with response to BTZ in MM patients and resistance to BTZ in cultured MM cells. (A) Expression of ELOVL6 in patient MM cells was determined using the GSE9782 data set between patients responsive (R) or nonresponsive (NR) to BTZ (R, n = 85; NR, n = 78) or dexamethasone (DEX) (R, n = 28; NR, n = 39). Probes for ELOVL6 were extracted based on the annotation from Affymetrix (shown above the plots). The 2-tailed Wilcoxon/Mann-Whitney test was used to determine statistical significance. P values between R and NR are shown above each therapy group. (B) Parental and BTZ-resistant MM cell lines with the following BTZ 50% inhibitory concentrations were used: MM.1S-P, 6 nM; MM.1S-R, 10 nM; RPMI8226-P, 3 nM; RPMI8226-R, 15 nM; KMS11-P, 6 nM; KMS11-R, 20 nM; ARH77-P, 8 nM; and ARH77-R, 25 nM. BTZ-resistant cells were collected 3 weeks after selection. Total cell extracts of logarithmically growing parental (P) and BTZ-resistant (R) cells were probed in immunoblotting with designated antibodies. ELOVL6-specific signals were normalized by glyceraldehyde-3-phosphate dehydrogenase (GAPDH)–specific signals and by ratio of these signals in corresponding parental cells. Shown immunoblots are representative images of at least 2 independent experiments. NS, nonsignificant.
Furthermore, transcriptomic analysis demonstrated that ELOVL6 expression was undetectable in a majority of primary samples taken from MM patients in contrast to normal PCs and cells isolated from patients with smoldering myeloma or monoclonal gammopathy of unknown significance (supplemental Figure 1), suggesting ELOVL6 plays a role in MM progression.
To independently validate the gene expression data, we selected 4 MM cell lines (MM.1S, RPMI8226, KMS11, and ARH77) for resistance to the respective 50% inhibitory concentrations of BTZ. After completion of the selection, BTZ-resistant cells were propagated without BTZ for at least 3 weeks without loss of resistance to the drug or increase in the levels of ELOVL6 (data not shown). ELOVL6 expression levels were downregulated in all 4 BTZ-resistant cell lines (Figure 1B), suggesting that similar mechanisms of cell-intrinsic resistance to BTZ occur in both patient-derived and cultured MM cells.
ELOVL6 regulates BTZ-induced cell death
ELOVL6 is a bona fide transcriptional target of SREBP1,28-30 which is embedded in the ER membrane in its inactive form.31 In response to ER stress, SREBP1 undergoes proteolytic cleavage, which generates transcriptionally active nuclear SREBP1 (nSREBP1).32-34 We confirmed that in MM cells, overexpression or depletion of SREBP1 upregulated or downregulated ELOVL6, respectively (supplemental Figure 2). Consistently, we demonstrated that levels of ELOVL6 and nSREBP1 were induced by BTZ treatment of MM.1S and RPMI8226 cells (Figure 2A). Furthermore, resistant MM cells demonstrated lower basal levels of nSREBP1 and the impaired ability to upregulate nSREBP1 and ELOVL6 in response to BTZ (Figure 2B), suggesting a possible mechanism of ELOVL6 downregulation in these cells.

ELOVL6 regulates resistance to BTZ in MM cells. (A-B) MM cells were treated or not with BTZ for the indicated time periods followed by immunoblotting with the indicated antibodies. (C) MM cells were transduced with control (CL) or ELOVL6 shRNAs (E1 or E2) followed by immunoblotting with the indicated antibodies 48 hours postinfection. (D) Cells described in panel C were treated for 16 hours with the indicated amounts of BTZ and probed in immunoblotting with the indicated antibodies (before the onset of cell death). (E) Cells described in panel C were treated with the indicated amounts of BTZ for 24 hours and probed in trypan blue cell viability assay. (F) MM cells were transduced with empty lentiviral vector (V) or lentiviral vector expressing ELOVL6 cDNA (ELOVL6) followed by immunoblotting with indicated antibodies 48 hours postinfection. (G) Cells described in panel F were treated for 16 hours with the indicated amounts of BTZ and probed in immunoblotting with the indicated antibodies (before the onset of cell death). (H) Cells described in panel F were treated for 24 hours with indicated amounts of BTZ and probed in trypan blue cell viability assay. Shown immunoblots are representative images of at least 2 independent experiments with no tangible experimental variability. The viability data are presented as the mean values of triplicates ± standard errors of the mean. P values were determined by Student t test. *P < .05, **P < .01.
ELOVL6 regulates resistance to BTZ in MM cells. (A-B) MM cells were treated or not with BTZ for the indicated time periods followed by immunoblotting with the indicated antibodies. (C) MM cells were transduced with control (CL) or ELOVL6 shRNAs (E1 or E2) followed by immunoblotting with the indicated antibodies 48 hours postinfection. (D) Cells described in panel C were treated for 16 hours with the indicated amounts of BTZ and probed in immunoblotting with the indicated antibodies (before the onset of cell death). (E) Cells described in panel C were treated with the indicated amounts of BTZ for 24 hours and probed in trypan blue cell viability assay. (F) MM cells were transduced with empty lentiviral vector (V) or lentiviral vector expressing ELOVL6 cDNA (ELOVL6) followed by immunoblotting with indicated antibodies 48 hours postinfection. (G) Cells described in panel F were treated for 16 hours with the indicated amounts of BTZ and probed in immunoblotting with the indicated antibodies (before the onset of cell death). (H) Cells described in panel F were treated for 24 hours with indicated amounts of BTZ and probed in trypan blue cell viability assay. Shown immunoblots are representative images of at least 2 independent experiments with no tangible experimental variability. The viability data are presented as the mean values of triplicates ± standard errors of the mean. P values were determined by Student t test. *P < .05, **P < .01.
We hypothesized that depletion of ELOVL6 renders MM cells resistant to BTZ. To test this hypothesis, we transduced MM.1S and RPMI8226 cells independently with lentiviral vectors bearing control or 2 different ELOVL6-specific shRNAs (Figure 2C). In both cell lines, ELOVL6 depletion decreased BTZ-induced ER stress (Figure 2D) and cell death (Figure 2E) without suppressing the activity of BTZ (as evidenced by the degree of ubiquitination in BTZ-treated control cells and ELOVL6-depleted cells; Figure 2D). Conversely, ELOVL6 overexpression (Figure 2F) increased BTZ-induced ER stress and cell death in both cell lines as compared with an empty vector control (Figure 2G-H; supplemental Figure 3A), without causing any statistically significant increase in cell death by itself (Figure 2H). Moreover, similar effects with respect to cell death were observed in studied MM cells treated with the BTZ next-generation analog carfilzomib (supplemental Figure 3B-C).
ELOVL6 controls FA composition of multiple lipid classes in MM cells
To understand the mechanisms of ELOVL6-dependent regulation of BTZ resistance, MM.1S and RPMI8826 cells, transduced with ELOVL6 cDNA or ELOVL6 shRNAs in parallel with the corresponding controls, were subjected to Liquid chromatography–tandem MS–based lipidomic analysis. More than 1100 individual lipid species were analyzed from multiple lipid classes, including phospholipids, sphingolipids, and glycerolipids (supplemental Table 4). Comparison of lipid profiles in studied cells demonstrated that FA composition across multiple lipid classes depended on ELOVL6 (Figure 3). In addition, the proportion of lipids with fatty acyl chain length ≤16 was decreased in ELOVL6-overexpressing cells compared with ELOVL6-depleted cells (supplemental Figure 4), in agreement with the function of ELOVL6 in elongation of C12 to C16 FAs.35
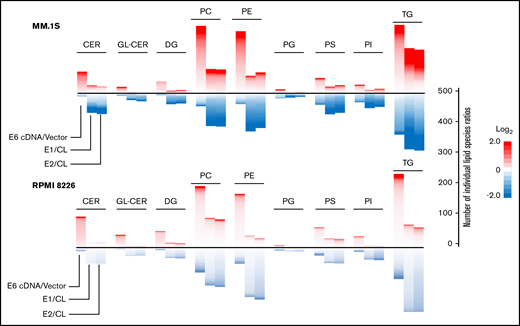
ELOVL6 regulates resistance to BTZ in MM cells. MM.1S and RPMI8226 cells were transduced with empty vector (vector), ELOVL6 cDNA-expressing vector (E6 cDNA), control shRNA (CL), or ELOVL6 shRNAs (E1 or E2). The resulting cell populations were subjected to lipidomic analysis in independent triplicates 48 hours postinfection. Shown are means of the individual lipid ratios between MM cell populations that were calculated and plotted as heatmaps for the following lipid classes using Microsoft R Open (version 3.5.1) software: –ceramides (CER), glycosylceramides (GL-CER), diacylglycerides (DG), –phosphatidylcholine (PC), –phosphatidylethanolamine (PE), –phosphatidylglycerol (PG), –phosphatidylserine (PS), –phosphatidylinositol (PI), and –triglycerides (TG). Only lipid classes with >20 species per lipid class are shown. The heatmaps consist of individual lipid species ratios. A scale for the number of individual lipid species ratios is shown on the right.
ELOVL6 regulates resistance to BTZ in MM cells. MM.1S and RPMI8226 cells were transduced with empty vector (vector), ELOVL6 cDNA-expressing vector (E6 cDNA), control shRNA (CL), or ELOVL6 shRNAs (E1 or E2). The resulting cell populations were subjected to lipidomic analysis in independent triplicates 48 hours postinfection. Shown are means of the individual lipid ratios between MM cell populations that were calculated and plotted as heatmaps for the following lipid classes using Microsoft R Open (version 3.5.1) software: –ceramides (CER), glycosylceramides (GL-CER), diacylglycerides (DG), –phosphatidylcholine (PC), –phosphatidylethanolamine (PE), –phosphatidylglycerol (PG), –phosphatidylserine (PS), –phosphatidylinositol (PI), and –triglycerides (TG). Only lipid classes with >20 species per lipid class are shown. The heatmaps consist of individual lipid species ratios. A scale for the number of individual lipid species ratios is shown on the right.
BTZ treatment substantially changes composition of ceramides and triglycerides in parental but not BTZ-resistant cells
Changes in the global lipidome of MM cells in response to proteasome inhibitors have not been studied. To identify such changes, we treated parental and BTZ-resistant MM cell lines with various amounts of BTZ that corresponded to the BTZ 50% inhibitory concentrations of individual parental cell lines and performed untargeted lipidomics before cell death (16 hours posttreatment). The analysis demonstrated that BTZ affected levels of multiple lipid species across all lipid classes in parental cells (Figure 4A). Among those, levels of a majority of ceramide and triglyceride species were substantially upregulated by BTZ in all 4 parental cell lines (Figure 4A). In contrast, no substantial increase in ceramide or triglyceride species was observed in BTZ-resistant cells in response to BTZ treatment (Figure 4B). Interestingly, ceramides and triglycerides were not different among the 4 pairs of BTZ-resistant and parental MM cell lines under untreated (uninduced) conditions (Figure 4C). These findings suggest that the difference in the steady state (ie, uninduced) lipidomes of parental and BTZ-resistant cells may not underlie the resistance to BTZ, which instead may emerge from the impaired ability of BTZ-resistant MM cells to alter lipid composition in response to BTZ.
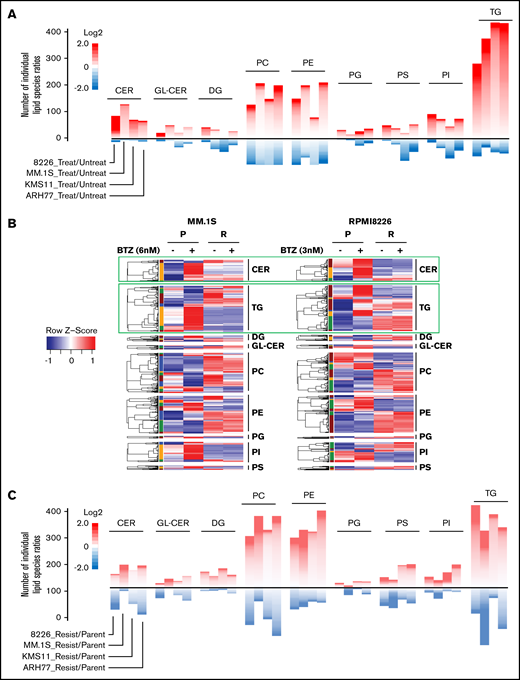
BTZ treatment affects lipid composition in parental and BTZ-resistant MM cells differently. (A) Cells from indicated parental MM cell lines were treated or not with the 50% inhibitory concentration amounts of BTZ for 16 hours (MM.1S, 6 nM; RPMI8226, 3 nM; KMS11, 6 nM; and ARH-77, 8 nM) followed by the assessment of cell viability via trypan blue exclusion assay. No increase in cell death was detected in BTZ-treated cells (data not shown). Treated and untreated cells were subjected to lipidomic analysis in independent triplicates. Mean ratios of the levels of individual lipids between BTZ-treated and untreated MM cells were calculated and plotted as heatmaps for lipid classes designated as in Figure 3. The heatmaps consist of individual lipid species ratios. A scale for the number of individual lipid species ratios is shown on the right. Only lipid classes with >20 species are shown. (B) Cells from indicated parental and BTZ-resistant MM cell lines were subjected to untargeted lipidomic analysis in independent triplicates. Raw values of each lipid molecule (each row) were transformed as z scores and plotted as heatmaps, with red representing the highest value and blue representing the lowest value. (C) Cells from indicated parental and BTZ-resistant MM cell lines were subjected to lipidomic analysis in independent triplicates. Mean ratios of the levels of individual lipids between BTZ-resistant and parental MM cells were calculated and plotted as heatmaps for lipid classes designated as in Figure 3. Only lipid classes with >20 species per lipid class are shown. The heatmaps consist of individual lipid species ratios. A scale for the number of individual lipid species ratios is shown on the right.
BTZ treatment affects lipid composition in parental and BTZ-resistant MM cells differently. (A) Cells from indicated parental MM cell lines were treated or not with the 50% inhibitory concentration amounts of BTZ for 16 hours (MM.1S, 6 nM; RPMI8226, 3 nM; KMS11, 6 nM; and ARH-77, 8 nM) followed by the assessment of cell viability via trypan blue exclusion assay. No increase in cell death was detected in BTZ-treated cells (data not shown). Treated and untreated cells were subjected to lipidomic analysis in independent triplicates. Mean ratios of the levels of individual lipids between BTZ-treated and untreated MM cells were calculated and plotted as heatmaps for lipid classes designated as in Figure 3. The heatmaps consist of individual lipid species ratios. A scale for the number of individual lipid species ratios is shown on the right. Only lipid classes with >20 species are shown. (B) Cells from indicated parental and BTZ-resistant MM cell lines were subjected to untargeted lipidomic analysis in independent triplicates. Raw values of each lipid molecule (each row) were transformed as z scores and plotted as heatmaps, with red representing the highest value and blue representing the lowest value. (C) Cells from indicated parental and BTZ-resistant MM cell lines were subjected to lipidomic analysis in independent triplicates. Mean ratios of the levels of individual lipids between BTZ-resistant and parental MM cells were calculated and plotted as heatmaps for lipid classes designated as in Figure 3. Only lipid classes with >20 species per lipid class are shown. The heatmaps consist of individual lipid species ratios. A scale for the number of individual lipid species ratios is shown on the right.
Restoration of ELOVL6 in BTZ-resistant MM cells resensitized them to BTZ in vitro and in vivo
To test whether ELOVL6 is functionally involved in resistance to BTZ in MM cells, we restored ELOVL6 levels in BTZ-resistant MM.1S and RPMI8226 cells approximately to the levels observed in the corresponding parental cells (Figure 5A). The obtained cell populations, in parallel with cells transduced with an empty vector, were treated or not with BTZ and analyzed for the expression of ER stress markers and the rates of cell death. Neither BTZ treatment nor ELOVL6 overexpression alone caused ER stress or cell death (Figure 5B-C), which were induced only by ELOVL6 overexpression in combination with BTZ treatment (Figure 5B-C). In agreement with these data, ELOVL6 overexpression sensitized tumor xenografts of BTZ-resistant MM.1S and RPMI 8826 cells to BTZ treatment in the plasmacytoma model in NOG mice (Figure 5D-E).
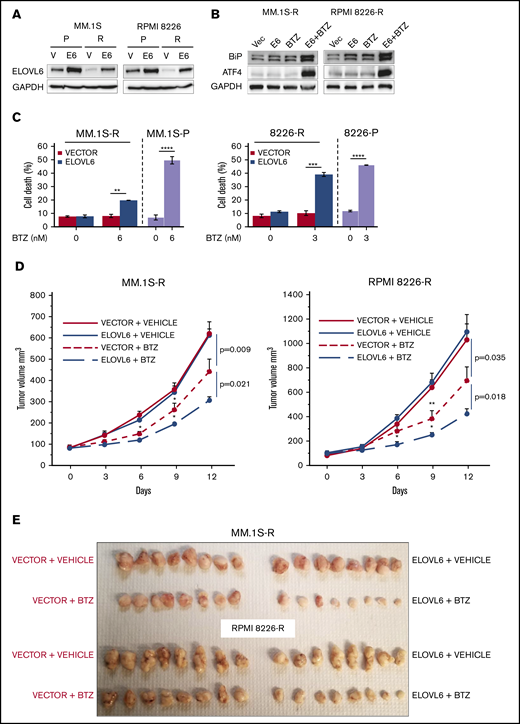
Restoration of ELOVL6 levels in BTZ-resistant cells sensitizes them to bortezomib. (A) Parental (P) and BTZ-resistant (R) MM cells were transduced with empty vector (V) or ELOVL6 cDNA-expressing vector (E6) followed by immunoblotting with indicated antibodies 48 hours postinfection. (B) BTZ-resistant MM.1S and RPMI8226 cells described in panel A were treated or not with 6 nM BTZ or 3 nM BTZ, respectively, for 16 hours followed by immunoblotting with the indicated antibodies. (C) MM cells described in panel A were treated or not with the indicated amounts of BTZ for 24 hours and probed in trypan blue cell viability assay. Shown immunoblots are representative images of at least 2 independent experiments with no tangible experimental variability. Viability data of parental MM.1S and RPMI8226 cells treated under the same conditions as BTZ-resistant cells are shown for comparison. The viability data are presented as the mean values of triplicates ± standard errors of the mean. (D) BTZ-resistant MM.1S or RPMI8226 cells transduced with empty vector or ELOVL6 cDNA-expressing vector (as in panel A) and inoculated subcutaneously into both flanks of 4- to 6-week-old female NOG mice. Mice with similar tumor burden were randomized into 2 groups (n = 5 animals per group) and treated on days 0, 3, 6, and 9 via intraperitoneal injections with vehicle (PBS) or BTZ in vehicle (0.5 mg/kg). Tumor volumes were recorded on the indicated dates. (E) At the end of the experiments, mice were euthanized, and tumors were excised, fixed in formaldehyde solution, and photographed. Data are presented as the mean values ± standard errors of the mean. P values were determined by Student t test. *P < .05, **P < .01, ***P < .001, ****P < .0001.
Restoration of ELOVL6 levels in BTZ-resistant cells sensitizes them to bortezomib. (A) Parental (P) and BTZ-resistant (R) MM cells were transduced with empty vector (V) or ELOVL6 cDNA-expressing vector (E6) followed by immunoblotting with indicated antibodies 48 hours postinfection. (B) BTZ-resistant MM.1S and RPMI8226 cells described in panel A were treated or not with 6 nM BTZ or 3 nM BTZ, respectively, for 16 hours followed by immunoblotting with the indicated antibodies. (C) MM cells described in panel A were treated or not with the indicated amounts of BTZ for 24 hours and probed in trypan blue cell viability assay. Shown immunoblots are representative images of at least 2 independent experiments with no tangible experimental variability. Viability data of parental MM.1S and RPMI8226 cells treated under the same conditions as BTZ-resistant cells are shown for comparison. The viability data are presented as the mean values of triplicates ± standard errors of the mean. (D) BTZ-resistant MM.1S or RPMI8226 cells transduced with empty vector or ELOVL6 cDNA-expressing vector (as in panel A) and inoculated subcutaneously into both flanks of 4- to 6-week-old female NOG mice. Mice with similar tumor burden were randomized into 2 groups (n = 5 animals per group) and treated on days 0, 3, 6, and 9 via intraperitoneal injections with vehicle (PBS) or BTZ in vehicle (0.5 mg/kg). Tumor volumes were recorded on the indicated dates. (E) At the end of the experiments, mice were euthanized, and tumors were excised, fixed in formaldehyde solution, and photographed. Data are presented as the mean values ± standard errors of the mean. P values were determined by Student t test. *P < .05, **P < .01, ***P < .001, ****P < .0001.
To gain mechanistic insights into the role of ELOVL6 in cell death, we analyzed the composition of BTZ-induced ceramides and triglycerides in BTZ-resistant vector cells and ELOVL6 cells. We demonstrated that BTZ slightly increased levels of a majority of ceramide species in vector cells (Figure 6A-B). ELOVL6 overexpression also caused intermediate upregulation of a majority of ceramide species (Figure 6A-B), whereas ELOVL6 overexpression in combination with BTZ treatment substantially increased ceramide levels (Figure 6A-B). Additionally, BTZ induced expression of ceramide synthases CERS5 and CERS6 in both studied cell lines (supplemental Figure 5), which could synergize with ELOVL6 in total ceramide production.

Addition of ceramides (CER) mimics ELOVL6-dependent effects in BTZ-resistant MM cells. (A) Parental (P) and BTZ-resistant (R) MM cells expressing or not empty vector or ELOVL6 were treated or not with the indicated amounts of BTZ for 16 hours followed by lipidomic analysis in independent triplicates. Raw values of each CER species (each row) were transformed as z scores and plotted in the heatmap, with red representing the highest value and blue representing the lowest value. (B) Mean ratios of the levels of individual CER species between designated BTZ-R MM cells were calculated and plotted as heatmaps. Each row represents an individual CER ratio. (C) BTZ-resistant MM.1S-R and RPMI8226-R cells were incubated with d18:1_16:0 CER (20 μM) and/or indicated amounts of BTZ for 16 hours, followed by immunoblotting with indicated antibodies. Shown immunoblots are representative images of at least 2 independent experiments with no tangible experimental variability. (D) BTZ-R MM.1S-R and RPMI8226-R cells were treated or not with the indicated amounts of d18:1_16:0 CER and/or BTZ for 24 hours and probed in trypan blue cell viability assay. (E) BTZ-R MM.1S-R and RPMI8226-R cells were treated for 24 hours with indicated amounts of VLDL and/or BTZ and probed in trypan blue cell viability assay. All viability data are presented as the mean values of triplicates ± standard errors of the mean. P values were determined by Student t test. *P < .05, **P < .01, ***P < .001. VLDL, very low density lipoprotein.
Addition of ceramides (CER) mimics ELOVL6-dependent effects in BTZ-resistant MM cells. (A) Parental (P) and BTZ-resistant (R) MM cells expressing or not empty vector or ELOVL6 were treated or not with the indicated amounts of BTZ for 16 hours followed by lipidomic analysis in independent triplicates. Raw values of each CER species (each row) were transformed as z scores and plotted in the heatmap, with red representing the highest value and blue representing the lowest value. (B) Mean ratios of the levels of individual CER species between designated BTZ-R MM cells were calculated and plotted as heatmaps. Each row represents an individual CER ratio. (C) BTZ-resistant MM.1S-R and RPMI8226-R cells were incubated with d18:1_16:0 CER (20 μM) and/or indicated amounts of BTZ for 16 hours, followed by immunoblotting with indicated antibodies. Shown immunoblots are representative images of at least 2 independent experiments with no tangible experimental variability. (D) BTZ-R MM.1S-R and RPMI8226-R cells were treated or not with the indicated amounts of d18:1_16:0 CER and/or BTZ for 24 hours and probed in trypan blue cell viability assay. (E) BTZ-R MM.1S-R and RPMI8226-R cells were treated for 24 hours with indicated amounts of VLDL and/or BTZ and probed in trypan blue cell viability assay. All viability data are presented as the mean values of triplicates ± standard errors of the mean. P values were determined by Student t test. *P < .05, **P < .01, ***P < .001. VLDL, very low density lipoprotein.
However, ELOVL6 overexpression did not consistently affect triglyceride levels in studied BTZ-resistant cells; a majority of triglycerides were upregulated in MM.1S cells but not in RPMI8226 cells (supplemental Figure 6A-B). Taken together, these data suggest that ELOVL6 abrogates BTZ resistance in MM cells via upregulation of ceramide species.
ELOVL6-dependent ceramides restore sensitivity of BTZ-resistant MM cells to BTZ
Several recent publications have demonstrated that ceramides may induce or suppress apoptosis caused by various stimuli.13,36 Therefore, we were interested in testing whether ceramides upregulated by ELOVL6 mediate BTZ-induced cell death in MM cells. To this end, we arbitrarily chose 2 ceramides (C16 and C18) from the top 10% of ceramide species upregulated by restoration of ELOVL6 in BTZ-resistant MM.1S and RPMI8226 cells (data not shown). Incubation of BTZ-resistant cells with either ceramide (20 μM for 24 hours [the established conditions used to increase intracellular ceramide levels])37,38 did not cause cell death in BTZ-resistant cells (Figure 6C-D). However, treatment of BTZ-resistant cells with C16 or C18 in combination with BTZ significantly increased the levels of ER stress markers and resensitized these cells to BTZ (Figure 6C-D; supplemental Figure 7B-C). In contrast, 24-hour treatment of BTZ-resistant MM cells with 20 μg/mL of very low density lipoprotein (an established dose for increasing intracellular triglycerides39,40 ) alone or in combination with BTZ did not induce cell death (Figure 6E).
Taken together, our data identified ELOVL6 as a major regulator of ceramide composition and clinically relevant modulator of BTZ resistance in MM cells.
Discussion
The ER is the primary site for the location of multiple enzymes involved in lipid metabolism and a central organelle for lipid biosynthesis.41 Because of this, the ER controls the lipid composition and physical properties of all biological membranes, including its own.42 The cross-talk between lipid metabolism and ER stress has been described in several studies.43 For example, an adaptive response to proteotoxic ER stress activates the transcription factors XBP1S and ATF6,44 which in turn upregulate transcription of multiple lipid biosynthesis genes.45,46 This provides lipids for the ER membrane expansion, leading to alleviation of ER stress.47 Conversely, changes in the lipid composition of the ER membrane may affect protein folding in the ER, thus causing proteotoxic ER stress.48,49
The role of perturbations in lipid metabolism as mediators of BTZ cytotoxicity has not been well investigated. We propose a model whereby BTZ treatment increases ELOVL6 levels via activation of nSREBP1, leading to enhanced production of a vast majority of ceramide species and exacerbation of BTZ-induced ER stress. SREBP1 is downregulated during the ontological progression of B cells to bone marrow PCs (probe 202308_at; Amazonia database), suggesting that PC survival (and by extension, MM cell survival) is dependent on lower levels of SREBP1 expression. SREBP1-mediated ELOVL6 activation seems to be quantitatively driven to induce MM cell death upon BTZ treatment. Consequently, resistance of MM cells to BTZ is mediated by the diminished ability of MM cells to increase ELOVL6-dependent ceramide production in response to BTZ. This model is supported by several findings, including partial suppression of BTZ-induced ER stress and cell death by depletion of ELOVL6 and the ability of ELOVL6-dependent ceramides to cooperate with BTZ in BTZ-resistant myeloma cells. Of note, although we demonstrated that ELOVL6 regulated the composition of multiple lipid species, including ceramides and triglycerides, BTZ (which also upregulated ELOVL6 levels) most consistently increased levels of ceramides and triglycerides, but not other ELOVL6-dependent lipid species. This could be due to the pleiotropic nature of BTZ activity, which may affect the cell lipidome via modulation of the levels or activity of other lipid metabolism enzymes in addition to ELOVL6.
ELOVL6 mainly elongates C16 to C18 FAs, and endogenous ceramides in MM cells are overwhelmingly composed of FA chains longer than C16 (supplemental Table 4). This observation can explain the increase in a majority of ceramide species by ELOVL6 in MM cells. It is worth noting, however, that BTZ treatment also affected fatty acyl composition of other lipid species, and their contribution to BTZ cytotoxicity or resistance should be the subject of future studies.
Ceramide levels and composition are controlled by ceramide synthases (CERS1-6).13,50 In MM cells, BTZ induced expression of only CERS5 and CERS6. The role of these proteins in cancer progression and induction of cell death is controversial. Several publications have suggested that CERS5 may increase proliferation of cancer cells and facilitate progression in colorectal and breast cancers13,51,52 but also facilitate cell death in cancer cells in response to various cytotoxic agents.13,53,54 Moreover, elevated levels of CERS5 have been linked to ER stress and autophagy in adenocarcinoma cells.55 Similarly, elevated levels of CERS6 have been associated with tumor invasion, metastasis, and poor survival in patients with non–small-cell lung cancer.56 On the other hand, CERS6 has been reported to increase sensitivity of cells from multiple cancer cell lines to chemotherapeutic agents.13,57,58 Depending on cell type, CERS6 has also been shown either to suppress ER stress or to facilitate it via promotion of ceramide-dependent Ca2+ release into the cytosol.13,59,60
Changes in the levels of FAs, which are the substrates for CERS, have not been considered a limiting factor for ceramide biosynthesis. Interestingly, ELOVL1 has been reported to specifically interact with CERS2,61 whereas ELOVL6 has been shown to bind CERS4.62 It has also been suggested that ELOVL6 may modulate CERS4 activity.62 It is unclear whether in addition to supplying FAs for incorporation into ceramides, ELOVL6 also modulates activity of ceramide synthases in MM cells.
Ceramides have been implicated in the induction of apoptosis.9,12 In addition, abnormal accumulation of ceramides can induce ER stress.63 Conversely, several studies have also demonstrated antiapoptotic functions for ceramides.10,54,64 Our data suggest that in MM cells, at least some ELOVL6-dependent ceramides bear pro–ER stress and proapoptotic functions.
The role of lipid metabolism in MM progression and drug resistance is understudied.19,20 Therefore, the function of SREBP1 in MM initiation, progression, and drug resistance remains unknown. In contrast, aberrant lipid metabolism has been well documented to cause disruption of ER homeostasis.8 Several reports have revealed that ER stress and activation of unfolded protein response can be directly caused by toxic lipids independently of the accumulation of misfolded proteins.49 Proteotoxic and lipotoxic types of ER stress seem interconnected, likely because of the dual role of the ER in protein folding and maturation44 and lipid biosynthesis and trafficking.49 Furthermore, upregulation of lipid biosynthesis in response to proteotoxic ER stress65 strongly suggests the existence of lipid-based mechanisms capable of alleviation of proteotoxic ER stress, although the exact nature of these mechanisms is virtually unknown (other than general ER membrane expansion41 ). More studies will be required for the elucidation of such mechanisms for the therapeutic exploitation of these processes in MM resistant to ER stress–inducing drugs.
Additionally, little is known about changes in the lipid composition of patient MM cells and MM cell lines.66-68 Comprehensive untargeted and targeted lipidomic analyses in MM patients was performed in only 1 pilot study conducted among a rather limited set of MM patients.68 This study identified that some ceramide species were increased in high-risk MM patient samples, whereas several others were downregulated in relapsed/refractory MM specimens. Another study identified higher levels of sphingomyelins in 1 BTZ-resistant and 1 carfilzomib-resistant cell line.69 In parallel, genomic analysis of MM patient samples suggested the involvement of sphingolipid metabolism enzymes in regulation of MM cell viability.70 In particular, sphingosine kinase 2, which phosphorylates proapoptotic sphingosine into antiapoptotic sphingosine 1 phosphate71 has been identified as an enzyme required for MM cell survival.70,72 Genetic or pharmacological inhibition of sphingosine kinase 2 via the specific small-molecule inhibitor ABC29464073 led to the increased proteasomal degradation of MYC and MCL1 proteins in MM cells and activation of the proapoptotic gene NOXA.70 In addition, upregulation of ceramide pools was demonstrated to be an underlying mechanism.72
In summary, our data identify ELOVL6 as a major clinically relevant regulator of ceramide levels and BTZ resistance in MM cells.
For data sharing, please contact the corresponding author at mnikifor@wakehealth.edu.
Acknowledgments
This work was supported by National Institutes of Health, National Cancer Institute grants CA193981, CA224434, and CA190533; an International Myeloma Foundation Brian D. Novis Senior Research Grant Award (M.A.N.); and the Wake Forest Baptist Comprehensive Cancer Center Proteomics and Metabolomics Shared Resource, supported by National Cancer Institute Cancer Center Support grant P30CA012197.
Authorship
Contribution: B.C.L., A.U., and M.A.N. designed the experiments; B.C.L., A.U., and M.A.N. wrote the manuscript; B.C.L. and A.U. performed most of the experiments and analyzed the data; S.M., D.H.Y., Z.H., A.B.-S., D.W.W., and E.F. performed some of the experiments; J.L. performed lipidomic analysis; L.L. performed the bioinformatic analysis; C.M.F. and K.P.L. supervised part of the study; M.A.N. conceived the initial hypothesis and supervised the study; and all authors discussed the results and commented on the manuscript.
Conflict-of-interest disclosure: The authors declare no competing financial interests.
Correspondence: Mikhail A. Nikiforov, Wake Forest School of Medicine, 1 Medical Center Blvd, Winston-Salem, NC 27157; e-mail: mnikifor@wakehealth.edu.

