

Key Points
Integrating caloric restriction into B-ALL induction is feasible, reduces fat gain in the overweight, and improves disease response.
Insulin and adiponectin are identified as potential biomarkers of B-ALL chemosensitivity warranting further investigation.

Abstract
Being overweight or obese (OW/OB) during B-cell acute lymphoblastic leukemia (B-ALL) induction is associated with chemoresistance as quantified by minimal residual disease (MRD). We hypothesized that caloric and nutrient restriction from diet/exercise could lessen gains in fat mass (FM) and reduce postinduction MRD. The Improving Diet and Exercise in ALL (IDEAL) trial enrolled patients 10 to 21 years old, newly diagnosed with B-ALL (n = 40), in comparison with a recent historical control (n = 80). Designed to achieve caloric deficits ≥20% during induction, reduce fat intake/glycemic load, and increase activity, IDEAL’s end points were FM gain (primary), MRD ≥0.01%, and adherence/feasibility. Integrated biology explored biomarkers of OW/OB physiology. IDEAL intervention did not significantly reduce median FM change from baseline overall (+5.1% [interquartile range [IQR], 15.8] vs +10.7% [IQR, 16.0]; P = .13), but stratified analysis showed benefit in those OW/OB (+1.5% [IQR, 6.6] vs +9.7% [IQR, 11.1]; P = .02). After accounting for prognostic factors, IDEAL intervention significantly reduced MRD risk (odds ratio, 0.30; 95% confidence interval, 0.09-0.92; P = .02). The trial exceeded its adherence (≥75% of overall diet) and feasibility (≥80% completed visits) thresholds. Integrated biology found the IDEAL intervention increased circulating adiponectin and reduced insulin resistance. The IDEAL intervention was feasible, decreased fat gain in those OW/OB, and reduced MRD. This is the first study in any hematologic malignancy to demonstrate potential benefit from caloric restriction via diet/exercise to augment chemotherapy efficacy and improve disease response. A prospective, randomized trial is warranted for validation. These trials were registered at www.clinicaltrials.gov as #NCT02708108 (IDEAL trial) and #NCT01317940 (historical control).
Introduction
Overweight and obesity are increasingly recognized as significant contributors to cancer incidence, relapse, and patient survival.1-3 The adverse impact of obesity on cancer outcome has been well described for B-cell acute lymphoblastic leukemia (ALL; B-ALL),4-8 the most common pediatric malignancy. Moreover, preexisting obesity is associated with increased risk of developing B-ALL during childhood9 wherein up to 40% of children and adolescents begin ALL therapy overweight or obese (OW/OB).9,10 Prolonged glucocorticoid chemotherapy and sedentary behavior during the first month of therapy (induction) further compound this problem by causing rapid gains in fat.10,11 Being obese during therapy for National Cancer Institute (NCI)/Rome high-risk B-ALL (HR-ALL) confers a 50% greater risk for relapse and poorer survival in children and adults.5,7 Preclinical studies demonstrating adipocyte-mediated chemoresistance in B-ALL have added biological evidence to support these associations.12-16 The adverse influence of obesity begins from the time of diagnosis; patients OW/OB at diagnosis experience a more than twofold greater risk for persistent minimal residual disease (MRD) at the end of induction (EOI).17 Because early eradication of B-ALL cells quantified by MRD is a hallmark of chemosensitivity in B-ALL, and the strongest predictor of relapse and survival,18,19 this finding is particularly concerning.
However, recent data suggest that the negative impact of OW/OB on ALL outcome may be reversible. A secondary analysis of clinical trial data from the Children’s Oncology Group (COG) showed that obese patients who became nonobese during therapy had a reduced risk of relapse.20 Our group tested this effect in a preclinical model and found that switching obese mice to a lower calorie and fat diet concomitantly with chemotherapy similarly improved survival.21 These observations imply that an intervention targeting obesity could potentially reverse its negative effects. Caloric restriction and deprivation of key fuels (eg, glucose, fatty acids) have been identified as pathways through which obesity-induced chemoresistance and/or tumor progression may be reversed.22 Nonetheless, efficacy from this approach to improve disease response has yet to be demonstrated in any pediatric or hematologic cancer.23 Improving chemosensitivity of malignant cells without dose intensification is crucial to augment chemotherapy efficacy without increasing the burden of cure from treatment-related toxicity.
From these data, we hypothesized that inducing a caloric deficit concurrent with macronutrient restriction plus exercise would decrease fat gain during induction, reverse overweight physiology, and thereby improve B-ALL chemosensitivity as evidenced by reduction in MRD. As we previously found that patients beginning therapy lean also gained significant adiposity and overweight physiology,11 we further hypothesized that both OW/OB and lean patients might benefit from such an intervention. To test this, we conducted a proof-of-principle nonrandomized controlled trial targeting overweight physiology and nutritional intake in older children and adolescents newly diagnosed with HR-ALL (the Improving Diet and Exercise in ALL [IDEAL] Trial).
Methods
Patient population
Patients 10 to 21 years of age, newly diagnosed with de novo NCI/Rome HR-ALL, and beginning therapy with a COG-style 4-drug induction regimen at 2 regional academic centers were eligible for enrollment into the IDEAL trial. Patients with HR-ALL <10 years old (ie, presenting white blood cell [WBC] count of 50 × 103/μL) were excluded in order to maximize the role of self-efficacy and engagement of patients to the diet and exercise intervention.24,25 The details of the COG risk stratification and induction chemotherapy for HR-ALL have been previously described.26,27 Patients with Down syndrome, body mass index (BMI) < 10th percentile (or BMI <18.5 in patients ≥20 years),28 preexisting intestinal dysfunction, or those unable to perform the intervention (eg, critically ill at presentation) were excluded. The IDEAL trial was open to accrual from May 2016 through March 2019. The historical control was established from consecutive, unselected B-ALL patients treated between January 2008 and March 2014 with the same COG-style induction regimen and meeting applicable eligibility criteria. The most recent subset of the historical control (2011-2014) was enrolled in a prospective study of body composition during ALL therapy. This predecessor trial included postinduction vitamin D therapy29 ; however, body composition data of fat mass (FM) and lean mass (LM) included in the historical control were obtained solely from the pre–vitamin D, observation-only induction phase of the study.11 Informed consent was obtained and documented from all subjects prior to enrollment. Both the current and predecessor trial were approved by the hospitals’ institutional review boards.
Study design and end points
The IDEAL trial was a prospective, nonrandomized, controlled trial with the primary end point of percentage change in FM during induction. Secondary end points were EOI MRD and feasibility of, and adherence to, the intervention. The intervention was conducted only during the 4-week induction phase (supplemental Figure 1). As we previously showed that change in BMI percentage during induction does not correlate with change in FM and LM,11 body composition was measured at diagnosis and at EOI in the IDEAL trial and historical control using the gold standard of whole-body, dual-energy x-ray absorptiometry (DXA) as described previously (fan-beam densitometer in array mode [Delphi W; Hologic Inc, Waltham, MA]).11 MRD in the marrow was measured by flow cytometry in a COG-certified laboratory using a standardized antibody panel and hierarchical gating strategies to establish a “different from normal” immunophenotypic population.18 MRD+ was defined using a threshold of ≥0.010% per contemporary B-ALL risk stratification18 and detectable MRD as ≥0.000%. Feasibility was defined as completing ≥80% of weekly study visits for patients receiving induction chemotherapy. Adherence was defined as ≥75% to the prescribed intervention as assessed by the dietitian and self-reported for exercise. Integrated biology assessed biomarkers of 4 theorized mechanisms for obesity-induced B-ALL chemoresistance: growth factors, adipokines (adipocyte-associated cytokines), inflammation, and insulin sensitivity. For both the IDEAL trial and historical control, imaging and laboratory biomarkers were to be obtained prior to starting chemotherapy where possible. All biomarkers had to be collected prior to start of the intervention and both biomarkers and imaging were mandated to occur within 96 hours from start of chemotherapy (supplemental Trial protocol).
IDEAL intervention
The IDEAL intervention was designed to induce a caloric deficit of ≥20%, divided equally between reduced calorie intake and increased expenditure. The patient’s estimated energy requirement was calculated using the Schofield equation for basal metabolic rate adjusted for an activity factor of 1.3.30,31 The intervention began as early as possible following the initiation of chemotherapy and prior to induction day 4. Study visits were integrated into routine weekly visits for chemotherapy in the ambulatory clinic or inpatient setting (supplemental Figure 1). Overarching aspects of the intervention included (1) assessment of patient preferences to individualize diet and exercise choices, (2) inclusion of family in education, and (3) weekly reinforcement using motivational interviewing techniques.
The education, diet, and exercise prescriptions are summarized in Table 1 and provided in detail in the supplemental Trial protocol. The study dietitian performed individualized menu planning with food exchanges as described by Schenk et al.32 The diet was reinforced at weekly visits and with optional interval phone calls. Dietary intake was recorded using 3-day food records and 24-hour recalls. Nutrients were calculated using the US Department of Agriculture (USDA) Food and Nutrient Database for Dietary Studies.33 Glucose levels were monitored by providers during induction as standard of care, with insulin routinely prescribed for steroid-induced hyperglycemia (fasting glucose, ≥126; postprandial, ≥200); data for insulin use were extracted from treatment records as a clinically relevant measure of insulin resistance and β-cell failure. An exercise physiologist and physiotherapist (PT) designed the aerobic and resistance exercise intervention using metabolic equivalent of tasks (METs) to quantify moderate to vigorous exercise for a personalized “menu” of activities. The PT assessed motor function and strength at baseline and weekly using the Bruininks-Oseretsky Test of Motor Proficiency, Second Edition (BOT-2).34 Based on weekly performance assessments, the exercise prescription was adjusted using METs per activity to maintain goal exertion. A Fitbit Flex 2 pedometer was provided to measure home activity. Fitbit data were extracted centrally using Fitabase (SmallSteps Labs, LLC).
Summary of IDEAL intervention
| IDEAL intervention | |
|---|---|
| Education topic | Approach |
| Benefits from diet and exercise during induction | Integrated into physician conference, and assessment of diet (by RD) and activity (by PT) |
| Food selection and portion control | My Plate (USDA), Traffic Light, individualized menus with portion recommendations |
| Safe exercise during chemotherapy | Instruction, demonstration, and technique by PT during visits |
| Diet intervention | Daily intake goal |
| Caloric deficit* | ≥10% |
| Protein | ≥20% of total calories |
| Fat | <25% of total calories |
| Carbohydrate | <55% of total calories |
| Low glycemic load† | <100/2000 kcal |
| Progression | Caloric goal ± 5% weekly |
| Exercise intervention | Goals |
| Caloric expenditure* | ≥10% |
| Frequency | Daily |
| Intensity‡ | Moderate exertion |
| Time | 15- to 30-min sessions (200 min/wk) |
| Type | Aerobic exercise + resistance training |
| Location | Home-based§ |
| Progression | As tolerated |
RD, registered dietitian.
Estimated from calculated estimated energy requirement; see “Methods.”
Calculated using glycemic index for consumed foods, threshold adjusted for actual calorie intake.
Calculated for each of a menu of common activities using METs.
Continued inpatient for those hospitalized during induction.
Integrated biomarkers of OW/OB physiology
Plasma was collected from each patient at diagnosis and at EOI to measure growth factors, cytokines, and adipokines. Luminex assays were used to measure interleukin 1β (IL-1β), IL-6, IL-10, and tumor necrosis factor α (EMD Millipore), and leptin, insulin, insulin-like growth factor [IGF]-binding protein 3 (IFGBP-3), B-cell–activating factor (BAFF), and fatty acid–binding protein 4 (R&D Systems). Total adiponectin/Acrp30, total IGF-1, and free IGF-1 were measured using individual enzyme-linked immunosorbent assays (R&D Systems). Levels resulting outside of the assay limit of detection in either direction were conservatively included in the analysis at the limit of detection. All cytokine analyses were performed by the Immune Assessment Core at UCLA following the manufacturer’s instructions.
Statistical methods
Age-/sex-adjusted population norms were used to define weight status: OW/OB (BMI ≥85%)28 vs lean (BMI, 10% to 84.9%). For patients ≥20 years of age, categories were defined using adult criteria (BMI ≥25 and BMI 18.5-24.9, respectively). Sample size was determined according to the primary end point of change in FM from baseline compared between the IDEAL cohort and the historical control, based on a 2-sample, 2-sided Student t test with 5% type I error, and at least 90% power to detect a 2.5 percentage-point difference in FM change between the 2 cohorts. Percentage change in FM was calculated for each patient adjusted for their baseline FM. In addition to the primary analysis for overall differences, due to likely differences in behavior and response to the IDEAL intervention, post hoc exploratory subgroup analyses examined change in FM stratified by patients who were OW/OB vs those lean. To analyze the secondary end point of MRD, generalized linear models using binary logistic regression were constructed including demographic and traditional prognostic indicators (age, initial WBC count, cytogenetic risk category, sex, ethnicity). To evaluate for a potential influence of treatment period on the MRD end point between the historical control and the IDEAL cohort, MRD was analyzed with the interaction of cohort and diagnosis year. All statistical tests were conducted as 2-sided tests, except for a priori determined 1-sided testing for the MRD end point, with significance set at P < .05. Feasibility and adherence were calculated as the mean for the cohort overall and by intervention component. Cytokine analyses were analyzed with parametric or nonparametric approaches as deemed appropriate. All analyses were performed using R (www.r-project.org).
Results
Study population
The IDEAL trial enrolled 40 patients with newly diagnosed HR-ALL. Of these, 36 of 40 were evaluable by DXA for the primary end point, 38 of 40 for MRD, and 39 of 40 for adherence and feasibility (see CONSORT; supplemental Figure 2). The historical control included 80 consecutively treated patients for comparison, of whom 36 were enrolled in the body-composition trial with paired DXA results pre/postinduction. As shown in Table 2, there was no difference in age, sex, or presenting WBCs as compared with controls; the IDEAL trial included fewer Hispanic patients, although 15% of IDEAL patients did not report ethnicity. Comparison of body composition between cohorts demonstrated the IDEAL cohort had higher BMI percentage and FM at baseline, although differences in FM were primarily restricted to those OW/OB at diagnosis (supplemental Table 1). The IDEAL cohort was also skewed toward unfavorable biologic features (Table 2). Specifically, fewer patients in IDEAL demonstrated double trisomy (4 and 10) and more patients were identified with known adverse cytogenetic prognostic features (48% vs 10%). The increase in adverse biology was primarily due to implementation of screening for Philadelphia chromosome–like (Ph-like) ALL as a higher-risk disease in 2016 (supplemental Table 2).35,36 Despite screening for Ph-like genetics, induction chemotherapy remained constant between cohorts including no specific therapy added during the trial intervention for those with Ph-like ALL. Examination of time effect showed no influence of diagnosis year on rates of positive or detectable MRD (P = .60 and P = .47, respectively). Comparison of presenting features in the DXA subset and biomarker subsets showed similar patterns to the parent cohort (supplemental Tables 3 and 4).
Description of cohort
| Characteristic | IDEAL trial, no. (%) or mean ± SD | Historical control, no. (%) or mean ± SD | P |
|---|---|---|---|
| Total | 40 (100) | 80 (100) | n/a |
| Age, y | |||
| Mean ± SD | 15.0 ± 3.0 | 14.7 ± 2.5 | .72 |
| 10-14.9 | 19 (48) | 46 (58) | .34 |
| ≥15 | 21 (52) | 34 (42) | |
| Sex | |||
| Female | 16 (40) | 37 (46) | .56 |
| Male | 24 (60) | 43 (54) | |
| Ethnicity | |||
| Not Hispanic | 8 (20) | 14 (18) | .002 |
| Hispanic | 26 (65) | 66 (83) | |
| Not reported | 6 (15) | 0 (0) | |
| WBC, ×103/μL | |||
| Mean ± SD | 56 ± 117 | 50 ± 93 | .54 |
| <50 | 31 (77) | 57 (71) | .52 |
| ≥50 | 9 (23) | 23 (29) | |
| Cytogenetics* | |||
| Neutral | 18 (45) | 61 (76) | <.001 |
| Favorable | 3 (7) | 10 (13) | |
| Adverse | 19 (48) | 8 (10) | |
| Unknown | 0 (0) | 1 (1) | |
| CNS disease† | |||
| CNS1 | 26 (65) | 62 (78) | .32 |
| CNS2 | 12 (30) | 16 (20) | |
| CNS3 | 2 (5) | 2 (2) | |
| BMI category | |||
| Lean | 14 (35) | 45 (56) | .09 |
| Overweight | 6 (15) | 9 (11) | |
| Obese | 20 (50) | 26 (33) | |
| BMI percentile | 79.5 ± 27.3 | 67.2 ± 32.8 | .03 |
| Body composition‡ | |||
| Fat mass, kg | 25.2 ± 14.1 | 18.4 ± 11.3 | .04 |
| % Fat | 32.7 ± 9.6 | 27.8 ± 9.0 | .02 |
| Lean mass, kg | 45.3 ± 14.7 | 39.5 ± 12.5 | .11 |
| % Lean | 64.4 ± 9.2 | 68.9 ± 8.5 | .02 |
CNS, central nervous system; CNS1, no blast cells in cerebrospinal fluid (CSF); CNS2, <5 WBC/μL CSF with blast cells; CNS3, ≥5 WBC/μL CSF with blast cells or signs of CNS involvement; n/a, not applicable; SD, standard deviation.
Cytogenetics classified using COG risk stratification; see “Methods.”
Involvement of CNS per COG criteria.
Body composition assessed by DXA in subset of historical control.
Efficacy to prevent fat gain
In aggregate, there was no significant difference in change in FM from preinduction baseline in those receiving the IDEAL intervention vs the historical DXA control (median change, +5.1% [interquartile range [IQR], 15.8] vs +10.7% [IQR, 16.0]; P = .13). Patients who were adherent to the diet intervention, as defined by protocol, gained the least FM (median change, +2.4% [IQR, 13.7]). However, in exploratory subgroup analysis stratified by BMI at diagnosis (Figure 1A), OW/OB IDEAL patients gained significantly less FM than OW/OB controls (median change, +1.5% [IQR, 6.6] vs +9.7% [IQR, 11.1]; P = .02), although no difference was present for those lean at diagnosis vs historical controls (median change, +20.5% [IQR, 23.6] vs +11.0% [IQR, 18.6]; P = .19). Of those beginning therapy OW/OB on the IDEAL trial, 36% (8 of 22) lost FM during induction as compared with 25% (4 of 16) of OW/OB in the historical controls (P = .42). The IDEAL intervention did not prevent loss of LM compared with the historical control in either BMI group (median changes, lean −11.6% [IQR, 9.1] vs −13.8% [IQR, 16.9], P = .83; OW/OB −13.1% [IQR, 11.0] vs −15.9 [IQR, 10.1], P = .95) (Figure 1B).
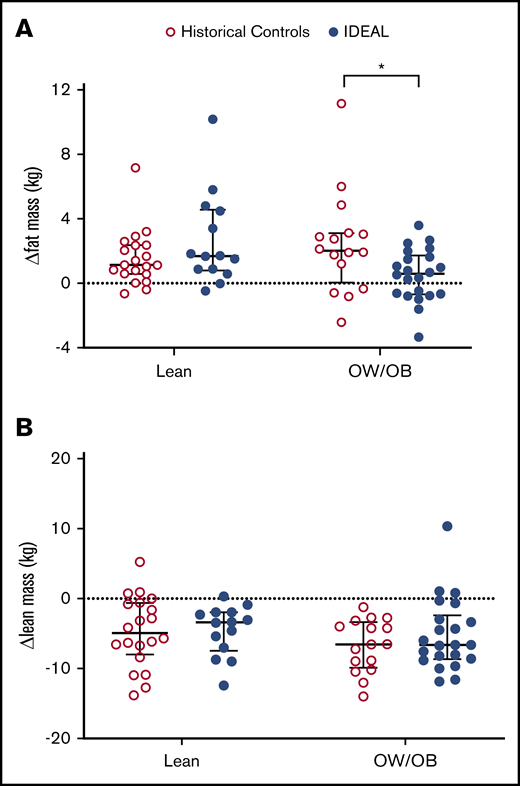
Change in FM and LM during induction. Compared with historical controls, change in FM from baseline (A) was decreased in those OW/OB (BMI ≥85%) at diagnosis in the IDEAL cohort but not in those lean (BMI <85%). Change in LM from baseline (B) was not significantly different for either group. *Significant at 2-sided P < .05.
Change in FM and LM during induction. Compared with historical controls, change in FM from baseline (A) was decreased in those OW/OB (BMI ≥85%) at diagnosis in the IDEAL cohort but not in those lean (BMI <85%). Change in LM from baseline (B) was not significantly different for either group. *Significant at 2-sided P < .05.
Efficacy to reduce EOI MRD
Prevalence of EOI MRD stratified by BMI category is shown in Figure 2. Multivariable analysis demonstrated that the IDEAL intervention was associated with a significantly reduced risk of EOI MRD positivity after accounting for confounding covariables (odds ratio [OR], 0.30; 95% confidence interval [95% CI], 0.09-0.92; 1-sided P = .02) (Table 3). The IDEAL intervention also reduced risk of detectable MRD (>0.000%) compared with historical controls (OR, 0.16; 95% CI, 0.04-0.52; 1-sided P = .002) (supplemental Table 5). Patients with OW/OB or higher baseline WBC remained at higher risk for EOI MRD. There was no significant interaction between BMI and the intervention in the model (P = .60). Due to differences in risk classification of Ph-like ALL between cohorts (supplemental Table 2), sensitivity analysis was performed applying the common risk classification from the historical control (AALL08B126 ) to both studies (ie, without Ph-like testing). This model demonstrated similar protective benefit of the IDEAL intervention on EOI MRD positivity (OR, 0.30; 95% CI, 0.09-0.84; 1-sided P = .01). Reduction in MRD risk by the IDEAL intervention was also significant in all models at the more conservative 2-sided threshold of P < .05.
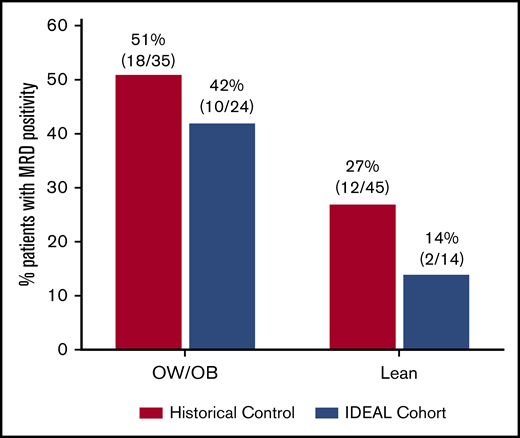
MRD at EOI. Prevalence of MRD ≥0.01% at EOI in the IDEAL cohort as compared with historical controls and stratified by starting BMI. In the IDEAL trial, 24 of 38 (63%) evaluable for MRD at EOI were OW/OB as compared with 35 of 80 (44%) in the historical control.
MRD at EOI. Prevalence of MRD ≥0.01% at EOI in the IDEAL cohort as compared with historical controls and stratified by starting BMI. In the IDEAL trial, 24 of 38 (63%) evaluable for MRD at EOI were OW/OB as compared with 35 of 80 (44%) in the historical control.
Multivariable analysis of IDEAL intervention and EOI MRD ≥ 0.01%
| Covariable | OR | 95% CI | P |
|---|---|---|---|
| Age ≥15 y | 1.10 | 0.44-2.79 | .42 |
| BMI at diagnosis, OW/OB | 3.40 | 1.23-10.13 | .01* |
| WBC at diagnosis, ×103/μL | 1.01 | 1.00-1.02 | .01* |
| Cytogenetics | |||
| Favorable | † | ||
| Adverse | 0.94 | 0.27-3.17 | .46 |
| Ethnicity | |||
| Hispanic | 0.70 | 0.19-2.65 | .29 |
| Not reported | † | ||
| Sex, male | 1.53 | 0.57-4.17 | .20 |
| IDEALintervention | 0.30 | 0.09-0.92 | .02* |
All P values are 1-sided; see “Methods.”
MRD, minimal residual disease in bone marrow.
Also significant at 2-sided test P < .05.
Variable informs model but perfectly predicts outcome (all favorable patients were MRD <0.01%).
Adherence and feasibility
The IDEAL intervention was successfully integrated into induction chemotherapy, with 86.5% (339 of 392) of all expected study visits completed. Of the 39 patients with follow-up assessments, average adherence to diet was 82.1% (95% CI, 77.7-86.5). Notably, 92% of patients (36 of 39) achieved a negative calorie balance throughout induction. Adherence to each component of the diet exceeded thresholds, except for fat intake (supplemental Figure 3). In contrast, average adherence to prescribed exercise was 31.2% (95% CI, 19.5-43.0). Fitbit data demonstrated that 59% (23 of 39) complied with Fitbit activity monitoring for ≥50% of induction (tracked days defined as any activity). Median steps per day on tracked days were 1530 steps per day (IQR, 1306 steps per day).
Integrated biology
Cytokine concentrations were analyzed at diagnosis (n = 39) and at EOI (n = 36) in IDEAL patients, and in banked specimens from the historical control (n = 28). At diagnosis, leptin was positively (Rho 0.70; P < .001) and adiponectin inversely (Rho = −0.28; P = .03) correlated with FM. The adiponectin-to-leptin ratio (A/L), a marker of insulin sensitivity, was inversely associated with FM at diagnosis (Rho = −0.66; P < .001). Following induction, leptin did not change significantly, but adiponectin and the corresponding A/L ratio were higher in the IDEAL cohort than the controls (Figure 3), indicating greater insulin sensitivity with less adipocyte dysfunction in the IDEAL cohort. Correspondingly, 32% of lean patients (7 of 22) in the historical DXA control required insulin for management of hyperglycemia as compared with 0% of lean patients (0 of 14) in the IDEAL trial (P = .02). There was no difference in insulin requirements in the OW/OB group receiving IDEAL (43%; 10 of 23) vs OW/OB controls (29%, 6 of 21; P = .24). In those not receiving exogenous insulin, circulating insulin levels were lower at EOI in the IDEAL cohort vs controls (n = 25 vs 17, 413 pg/mL [IQR, 395] vs 678 pg/mL [IQR, 303]; P = .02). Interestingly, in MRD− patients, A/L ratios were higher at EOI in IDEAL vs controls (2.68 [IQR, 4.49] vs 1.32 [IQR, 2.37]; P = .09) but not in MRD+ patients (1.52 [IQR, 1.02] vs 1.2 [IQR, 1.65]; P = .45). Paired pre/postcomparisons of cytokines found an overall anti-inflammatory state in both cohorts, with additional evidence for improved insulin sensitivity in IDEAL vs controls (supplemental Figure 4).
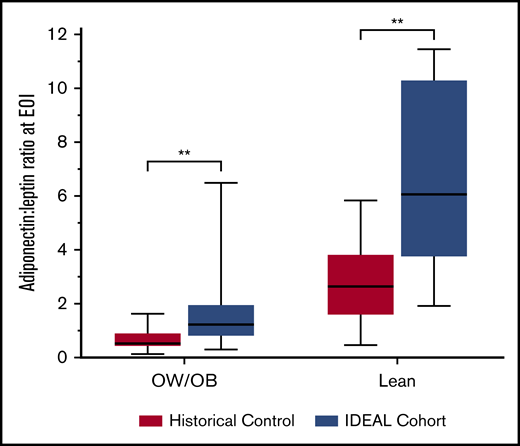
A/L ratio at EOI. A/L ratio is a sensitive measure for insulin sensitivity and healthy adipocytes. A/L ratio at EOI was higher for both lean and OW/OB patients treated in the IDEAL trial as compared with the historical control. **Significant at 2-sided P < .01.
A/L ratio at EOI. A/L ratio is a sensitive measure for insulin sensitivity and healthy adipocytes. A/L ratio at EOI was higher for both lean and OW/OB patients treated in the IDEAL trial as compared with the historical control. **Significant at 2-sided P < .01.
Discussion
The IDEAL trial is the first prospective trial to test caloric and nutrient restriction plus exercise as a therapeutic modality to improve chemotherapy efficacy and disease response in a hematologic malignancy. The IDEAL trial proved it is feasible to integrate this type of multifaceted intervention into induction chemotherapy. Although the intervention did not demonstrate significantly reduced fat gain in the overall cohort vs the historical control, post hoc analyses stratified by BMI demonstrated differences in the effect from the intervention in OW/OB vs lean patients. The IDEAL intervention successfully reduced fat gain in patients OW/OB but not in those lean at diagnosis. Most importantly, the IDEAL intervention reduced risk of EOI MRD in all patients, irrespective of starting BMI and after accounting for prognostic features. Notably, this effect was present despite fewer patients in the IDEAL cohort having ALL with lower-risk biologic features. Reduction in MRD was confirmed as well in a sensitivity analysis using the same biologic risk criteria to both cohorts. Although all patients thus benefited from the intervention, risk for MRD remained elevated in those who were OW/OB relative to their lean counterparts, consistent with our past experience. Although the trial was not designed to evaluate long-term survival, successfully reducing MRD has significant clinical ramifications. MRD remains the strongest patient-level predictor of poor outcome37 and is therefore routinely used to guide therapy intensification, immunotherapy, and/or hematopoietic cell transplantation, all of which add cost and comorbidity.38-40 Thus, reducing chemoresistance and MRD in the HR-ALL population both decreases morbidity and potentially improves survival.
It is notable that gain in FM was decreased only in OW/OB patients. Adherence to the diet was excellent, with caloric deficits and macronutrient goals achieved in nearly all patients, including in the lean group. It is possible that adipocytes and corresponding FM respond differently to caloric restriction in OW/OB vs lean patients.41,42 As sedentary behavior was also pervasive with average recorded steps per day less than the fifth percentile for children and adolescents,43 improved exercise may be necessary to restore metabolic flexibility in patients with IDEAL-refractory FM.42 Beyond its effects on FM, physical inactivity during the first month likely also contributed to the significant loss of muscle mass found in both cohorts. LM loss in the IDEAL trial was similar to that found in historical controls, indicating that caloric restriction from IDEAL did not worsen the loss of LM, and that even low levels of exercise countered any catabolic effects of caloric restriction. Nonetheless, loss of LM is particularly problematic during ALL therapy. LM is associated with bone mineral density and diminished LM might therefore exacerbate the dramatic bone loss observed during induction from ALL chemotherapy.44 The planned successor trial to IDEAL will explore these questions in a randomized manner by directly addressing sedentary behavior and refining the exercise intervention to promote FM loss and maintenance of LM.
We had hypothesized that IDEAL would reduce FM and thereby decrease adipocyte protection of ALL cells.12 Alternatively, reduced FM might improve chemotherapy pharmacokinetic profiles.12,16,45 The observed improvement in MRD, however, was not related to these changes in FM, suggesting that the pathophysiology is not strictly mediated by adipose tissue per se. Obesity also moderates a variety of cancer-associated intracellular signaling pathways involved in chemoresistance.46,47 Of the potential pathways tested in the trial, we identified the insulin-glucose pathway and the adipokine adiponectin as potentially key mediators of chemoresistance and IDEAL efficacy. Insulin stimulates phosphatidylinositol-3-kinase (PI3K)/AKT intracellular signaling, a known and targetable pathway implicated in ALL chemoresistance.48,49 Despite the IDEAL cohort beginning therapy with greater FM than the historical control cohort, the IDEAL intervention improved insulin sensitivity as evidenced by increased plasma A/L ratio, the elimination of an exogenous insulin requirement in lean patients, lower circulating insulin, and decreased BAFF compared with controls. In a trial testing a severe form of intermittent fasting in women with breast cancer, lower insulin levels were similarly observed in those who were fasting-compliant with improved disease response.50 Albeit with a different dietary approach and cancer population, this adds support to the putative role of insulin in chemoresistance and the potential of dietary modifications to influence disease response across tumors. Interestingly, in the IDEAL trial, decreased insulin was accompanied by marked elevations in adiponectin. Adiponectin may separately contribute to improved chemotherapy efficacy as it directly and indirectly inhibits PI3K/AKT phosphorylation and downstream mechanistic target of rapamycin signaling via 5′ adenosine monophosphate–activated protein kinase.51 These findings support continued study of insulin in defining the mechanism for efficacy from the IDEAL intervention and newly identifies adiponectin as a potential biomarker of ALL chemosensitivity.
There are several limitations inherent to an early phase trial. First, as a single-arm study, IDEAL incorporated a nonrandomized historical control for comparison. However, static induction regimens and MRD rates during this treatment era minimized possible bias. The subsequent identification of Ph-like ALL as an adverse prognostic group complicated analysis of the underlying risk for the MRD end point. To address this, biologic differences were adjusted for in all multivariable analyses for MRD and the positive findings were replicated in the sensitivity analysis using the older risk classification. We also note that poor adherence to the exercise component was prevalent, and was further compounded by physical inactivity. As exercise is challenging for patients, this may support potential benefit from dietary caloric restriction alone. The relative contribution to efficacy from each component will require further exploration in a larger, randomized trial. Finally, we acknowledge that our cohort included patients with high rates of obesity, Hispanic ethnicity, and included only COG-style HR-ALL therapy. Chemotherapy agents for HR-ALL induction are also relatively preserved among international consortia, and have even been adopted by many adult consortia.7 Nonetheless, testing of the IDEAL intervention in a broader setting is now warranted. A prospective randomized trial stratified by ALL biology and obesity will be conducted within the Therapeutic Advances in Childhood Leukemia and Lymphoma Consortium to validate these findings in a national, consortium setting. The IDEAL trial provides proof of principle for the feasibility and biologic plausibility of breaking the link between overweight physiology and tumor biology to improve chemotherapy efficacy, disease response, and survival in ALL: all without added morbidity or mortality.
The clinical trial protocol detailing the intervention is available in full in supplemental Data accompanying the online version of the publication. Aggregate or deidentified individual participant data supporting the primary and secondary end points will be made available upon reasonable request to the corresponding author, and following establishment of an approved data access agreement, for a period of 3 years following the publication date.
Acknowledgments
The authors acknowledge Richard Sposto for biostatistical input into study planning and design, Katie Villabroza for clinical research coordination and trial operation, and the patients and families who volunteered to participate in the research trials.
This work was supported by the Gabrielle’s Angel Foundation for Cancer Research and in part by the National Institutes of Health, National Cancer Institute (grants R01 CA201444 [S.D.M.], P30 CA-16042 [G.L.], UL1TR000124-02 [G.L.], and P50 CA211015 [G.L.]), and National Center for Advancing Translational Sciences (grants UL1TR001855 and UL1TR000130) via the Southern California Clinical and Translational Science Institute (SC CTSI).
The content is solely the responsibility of the authors and does not necessarily represent the official views of the National Institutes of Health.
Authorship
Contribution: All authors participated in study design, interpretation of results, and revision of the manuscript, have given final approval of the manuscript, and agree to be accountable for all aspects of the work related to its accuracy or integrity; J.K. and G.L. performed the statistical analyses; and E.O. and S.D.M. conceived of the trial concept and wrote first draft of the manuscript.
Conflict-of-interest disclosure: E.O. served on an advisory board for Servier Pharmaceuticals outside of the scope of this work. The remaining authors declare no competing interests.
Correspondence: Etan Orgel, Children’s Hospital Los Angeles, Cancer and Blood Disease Institute, 4650 Sunset Blvd, MS#54, Los Angeles, CA 90027; e-mail: eorgel@chla.usc.edu.

