

Key Points
EV-TF activity is dramatically increased in patients with severe COVID-19 and is associated with an increased thrombotic risk.
Compared with patients with septic shock, those with severe COVID-19 display a distinct EV profile with higher procoagulant activity.
Abstract
Coronavirus disease 2019 (COVID-19) has become one of the biggest public health challenges of this century. Severe forms of the disease are associated with a thrombo-inflammatory state that can turn into thrombosis. Because tissue factor (TF) conveyed by extracellular vesicles (EVs) has been implicated in thrombosis, we quantified the EV-TF activity in a cohort of hospitalized patients with COVID-19 (n = 111) and evaluated its link with inflammation, disease severity, and thrombotic events. Patients with severe disease were compared with those who had moderate disease and with patients who had septic shock not related to COVID-19 (n = 218). The EV-TF activity was notably increased in patients with severe COVID-19 compared with that observed in patients with moderate COVID-19 (median, 231 [25th to 75th percentile, 39-761] vs median, 25 [25th to 75th percentile, 12-59] fM; P < .0001); EV-TF was correlated with leukocytes, D-dimer, and inflammation parameters. High EV-TF values were associated with an increased thrombotic risk in multivariable models. Compared with patients who had septic shock, those with COVID-19 were characterized by a distinct coagulopathy profile with significantly higher EV-TF and EV-fibrinolytic activities that were not counterbalanced by an increase in plasminogen activator inhibitor-1 (PAI-1). Thus, this article is the first to describe the dissemination of extreme levels of EV-TF in patients with severe COVID-19, which supports the international recommendations of systematic preventive anticoagulation in hospitalized patients and potential intensification of anticoagulation in patients with severe disease.
Introduction
The coronavirus disease 2019 (COVID-19) global pandemic caused by the novel severe acute respiratory syndrome coronavirus 2 (SARS-CoV-2) has become one of the biggest public health challenges of this century. Patients with COVID-19 are usually mildly symptomatic; however, a severe form of the disease will develop in 5% of patients, causing acute respiratory distress syndrome, which has a high mortality rate.1 Severe COVID-19 is associated with a prothrombotic state2,3 with unique characteristics compared with a more classical sepsis-induced coagulopathy. This is reflected by a sharp increase in D-dimer and fibrinogen but initial minimal abnormalities in the prothrombin time (PT) and platelet counts.4 Despite preventive anticoagulation, high levels of D-dimer are associated with a higher incidence of venous and arterial thrombosis in patients with COVID-19 compared with those who do not have COVID-19 but do have a similar degree of illness.5 Mechanistically, coagulation activation probably occurs because of the combination of hypoxemia, endothelial activation, and a profound inflammatory response in critically ill patients.6 These pathways converge to the increased expression of endothelial and leukocyte tissue factor (TF), the main initiator of the coagulation cascade. Interestingly, after cellular activation, an active form of TF can be released and is associated with large extracellular vesicles (EVs) that disseminate throughout the entire body and participate in sepsis-induced coagulopathy7 and thrombus formation.8 The contribution of EV-TF in the pathophysiology of COVID-19 has been recently suggested by several authors as a potential key link between strong inflammatory cellular activation and dissemination of the prothrombotic state,6,9 but no data are available thus far. Therefore, we quantified the EV-TF activity in a cohort of hospitalized patients with COVID-19 and evaluated its link with inflammation, disease severity, and thrombotic events. The procoagulant profile of EVs was further compared between patients with severe COVID-19 and patients with septic shock not related to COVID-19.
Methods
Patients
In all, 111 adult patients with COVID-19 were enrolled in a pilot study approved by the Medical Ethics Committee of Aix-Marseille University between March 20 and April 14, 2020. Written informed consent was obtained from the patients or their relatives. COVID-19 was diagnosed when patients presented with viral pneumonia associated with objective findings on lung computed tomography scan or chest X-ray, and infection was confirmed by positive reverse transcription polymerase chain reaction. Patients with severe disease were defined as those hospitalized in the intensive care unit or requiring more than 6 L per minute of oxygen to achieve peripheral oxygen saturation (SpO2) ≥95%. Patients with moderate disease were defined as hospitalized patients who did not meet the criteria used to define patients with severe disease. Among the patients with moderate disease, some required oxygen supplementation or were observed for diabetes, chronic renal disease, or biological severity (evidenced by D-dimer >1 mg/mL, C-reactive protein [CRP] >50 mg/L) (Table 1). Blood samples were collected within 48 hours of patient admission. The patient characteristics, including demographics, comorbidities, treatments, and main outcomes, were recorded. An angiography computed tomography scan was systematically performed only in patients supported by venous extracorporeal membrane oxygenationafter a canula was removed. In other cases, thromboembolic disease was diagnosed by venous Doppler in case of clinical symptoms or an increase in D-dimer levels. The data for patients with severe COVID-19 were retrospectively compared with those for patients with septic shock not related to COVID-19 (n = 218) from a local cohort (NCT02062970). Clinical and biological data for these patients are provided in supplemental Table 1.
Characteristics of patients with severe or moderate forms of COVID-19 and patients with and without TEEs
| Characteristic | Moderate COVID-19 | Severe COVID-19 | P | TEE-negative | TEE-positive | P |
|---|---|---|---|---|---|---|
| Total no. of patients | 73 | 38 | 100 | 11 | ||
| Age, y | 69 [57-80] | 56 [52-70] | .003 | 68 [55-80] | 50 [37-58] | .003 |
| Sex | .318 | .213 | ||||
| Male | 36 | 23 | 51 | 8 | ||
| Female | 37 | 15 | 49 | 3 | ||
| Cardiovascular risk factors | ||||||
| Obesity | 14 (19) | 11 (29) | .215 | 20 (20) | 5 (45) | .116 |
| Chronic kidney disease | 21 (29) | 8 (21) | .495 | 28 (28) | 1 (9) | .282 |
| Hypertension | 40 (55) | 14 (37) | .109 | 51 (51) | 3 (27) | .204 |
| Diabetes | 21 (29) | 6 (16) | .165 | 24 (24) | 3 (27) | .727 |
| Cardiovascular disease | 24 (33) | 9 (24) | .384 | 32 (32) | 1 (9) | .169 |
| Clinical data at admission and treatments received during hospital stay | ||||||
| Oxygen saturation, % | 97 [94-98] | 94 [79-96] | <.0001 | 96 [94-98] | 85 [70-94] | .001 |
| Received supplemental oxygen | 38 (52) | 38 (100) | <.0001 | 65 (65) | 11 (100) | .016 |
| Invasive mechanical ventilation | NA | 18 (47) | 2 (2) | 9 (82) | <.0001 | |
| Extra corporeal membrane oxygenation | NA | 8 (21) | 1 (1) | 7 (64) | <.0001 | |
| Anticoagulation therapy | ||||||
| Heparin (preventive dose) | 50 (69) | 13 (34) | .001 | 62 (62) | 1 (9) | .001 |
| Heparin (treatment dose) | 0 (0) | 18 (47) | <.0001 | 8 (8) | 10 (91) | <.0001 |
| Direct oral anticoagulants | 9 (12) | 1 (3) | .084 | 10 (10) | 0 (0) | .336 |
| Anti-vitamin K | 5 (7) | 1 (3) | .327 | 6 (6) | 0 (0) | .526 |
| None | 9 (12) | 5 (13) | .560 | 14 (14) | 0 (0) | .210 |
| Antiviral treatment | ||||||
| Hydroxychloroquine + azithromycin | 61 (84) | 23 (61) | .010 | 80 (80) | 4 (36) | .004 |
| Lopinavir + ritonavir | 0 (0) | 4 (11) | .012 | 2 (2) | 2 (18) | .048 |
| None | 17 (23) | 6 (16) | .143 | 18 (18) | 5 (45) | .048 |
| TEEs | 0 (0) | 11 (29) | <.0001 | |||
| Venous thrombosis | 0 (0) | 8 (73) | ||||
| Pulmonary embolism | 0 (0) | 2 (18) | ||||
| Ischemic stroke | 0 (0) | 1 (9) | ||||
| Outcomes | ||||||
| 28-day mortality | 0 (0) | 4 (11) | .012 | 4 (4) | 0 (0) | |
| Hospitalized in ICU | 0 (0) | 18 (47) | <.0001 | 2 (2) | 9 (82) | <.0001 |
| Transferred to ICU | NA | 6 (30) | 13 (14) | 1 (9) | .280 | |
| Hospital discharged at 28 days | 63 (86) | 18 (47) | <.0001 | 76 (100) | 5 (45) | .066 |
| White blood cell count | ||||||
| White blood cell count × 109/L | 5.62 [4.53-7.41] | 6.30 [4.71-9.40] | .232 | 5.62 [4.43-7.70] | 6.7 [5.4-15] | .056 |
| Neutrophils × 109/L | 3.47 [2.65-5.21] | 4.80 [3.17-7.64] | .016 | 3.55 [2.64-5.70] | 5.4 [4.1-11.0] | .019 |
| Lymphocytes × 109/L | 1.27 [0.95-1.69] | 0.82 [0.59-1.20] | .001 | 1.20 [0.76-1.59] | 0.93 [0.82-1.40] | .357 |
| Monocytes × 109/L | 0.50 [0.37-0.68] | 0.46 [0.24-0.62] | .111 | 0.48 [0.32-0.67] | 0.46 [0.27-0.57] | .684 |
| Platelets × 109/L | 248 [194-318] | 272 [187-334] | .947 | 250 [187-318] | 273 [231-364] | .365 |
| Chemistry parameters | ||||||
| AST, U/L | 32 [23-55] | 44 [33-61] | .039 | 35 [24-54] | 49 [34-86] | .036 |
| LDH, U/L | 287 [224-340] | 367 [296-477] | <.0001 | 296 [230-364] | 401 [324-505] | .004 |
| Glomerular filtration rate, mL/min | 91 [66-105] | 98.5 [45-109] | .542 | 92 [62-105] | 103 [63-112] | .550 |
| Inflammatory parameters | ||||||
| CRP, mg/L | 38.6 [18.6-80.1] | 125.0 [27.3-179.7] | .003 | 51.1 [18.9-101.9] | 95.8 [34.4-227.9] | .257 |
| IP-10, pg/mL | 100.5 [23.8-85.3] | 201.1 [98.4-336.1] | .004 | 121.3 [56.4-257.1] | 189.8 [111-339.5] | .211 |
| IL-6, pg/mL | 24.8 [14.3-46.2] | 45.5 [21.0-89.6] | .026 | 27.9 [16.3-56.5] | 73.3 [13.5-137.6] | .094 |
| Haemostasis parameters | ||||||
| PT, % | 91 [80-101] | 85 [79-95] | .155 | 90 [80-100] | 83 [69-96] | .405 |
| aPTT ratio | 1.10 [0.98-1.19] | 1.30 [1.16-1.51] | <.0001 | 1.14 [1.01-1.30] | 1.55 [1.38-2.05] | <.0001 |
| Fibrinogen, g/L | 5.90 [5.02-6.88] | 6.56 [5.65-7.77] | .037 | 6.01 [5.15-7.04] | 7.31 [5.46-8.00] | .228 |
| D-dimer, ng/mL | 0.86 [0.65-1.42] | 1.74 [0.97-3.84] | <.0001 | 0.96 [0.68-1.65] | 3.29 [2.17-4.72] | <.0001 |
| Plasminogen, % | 108 [89-119] | 102 [93-114] | .580 | 104 [89-116] | 110 [101-129] | .193 |
| PAI-1, UA/mL | 1.4 [0.0-24.4] | 7.6 [0.0-28.6] | .333 | 9.7 [0.0-27.4] | 3.7 [0.0-10.9] | .652 |
| EV subsets, EV/µL | ||||||
| Platelet | 13376 [7995-18887] | 8523 [4229-15819] | .011 | 12441 [7098-18284] | 8358 [4182-13688] | .163 |
| Erythrocyte | 526 [300-1005] | 538 [263-1216] | .727 | 508 [286-999] | 760 [304-4469] | .272 |
| Granulocyte | 155 [75-345] | 214 [36-696] | .644 | 155 [74-394] | 285 [35-940] | .731 |
| Monocyte | 186 [97-340] | 201 [110-373] | .929 | 182 [98-293] | 334 [114-634] | .074 |
| Endothelial | 143 [88-247] | 181 [82-294] | .304 | 146 [87-245] | 272 [181-384] | .043 |
| Functional activities of EVs | ||||||
| Tissue factor activity (EV-TF), fM | 25 [12-59] | 231 [39-761] | <.0001 | 34 [14-105] | 629 [79-1104] | <.0001 |
| Fibrinolytic activity (EV-fib), mDO/min | 19.2 [9.7-47.8] | 28.0 [9.6-92.5] | .301 | 22.2 [9.5-63.0] | 31.1 [10.3-159.2] | .329 |
| Coagulolytic balance (EV-TF/EV-fib) | 0.6 [0.3-1.1] | 2.0 [0.6-14.6] | <.0001 | 0.6 [0.3-2.0] | 4.2 [1.1-29.5] | .002 |
Data are n (%) or median (25th to 75th percentile).
aPTT, activated partial thromboplastin time; ICU, intensive care unit; IP-10, interferon γ-induced protein 10; NA, not applicable; TEE, thromboembolic event.
Laboratory parameters
Routine blood chemistry and hematologic parameters, including the blood count, aminotransferases, lactate dehydrogenase (LDH), glomerular filtration rate, and CRP were recorded. Hemostasis exploration was performed by measuring the PT, activated partial thromboplastin time, fibrinogen, D-dimer (STA-Liatest D-Di Plus), plasminogen, and plasminogen activator inhibitor-1 (PAI-1) activity (STA R Max, Diagnostica Stago, Asnières, France). The serum levels of interferon-γ–inducible protein 10 (IP-10) and interleukin-6 (IL-6) were quantified using the magnetic luminex assay (Bio-Techne, Minneapolis, MN).
EV assays
Citrate plasma samples were prepared according to the current international guidelines for EVs.10,11 Circulating EVs were enumerated by flow cytometry according to their cell of origin, as detailed in the supplemental Materials and methods. The profibrinolytic (EV-fib) and TF-dependent procoagulant (EV-TF) activities of EVs were measured by using sensitive assays as recently described.12,13
Statistical analysis
Statistical analysis was performed using SPSS version 15.0 software. Categorical variables were presented as frequencies, and continuous variables were presented as the median and 25th to 75th percentiles. Comparisons between groups were performed using nonparametric tests (Mann-Whitney U test and Kruskal-Wallis test) for quantitative variables and Fisher’s exact tests for frequencies. Associations between continuous variables were analyzed using Spearman’s correlation tests. Multivariable analyses using Cox regression were performed to determine the impact of cardiovascular risk factors and comorbidities on EV-TF levels. All tests were 2-sided. Statistical significance was defined as P < .05.
Results and discussion
The patients’ characteristics were compared between patients with either severe or moderate forms of COVID-19 (Table 1). Patients with severe COVID-19 were younger and had lower oxygen saturation at admission than patients with moderate COVID-19. Despite venous thromboembolic prophylaxis with heparin, 29% of patients with severe forms of COVID-19 had thromboembolic events, including 8 deep venous thromboses, 2 pulmonary embolisms, and 1 ischemic stroke. Among patients with severe forms of COVID-19, 4 (11%) died within 28 days. At inclusion, the patients with severe forms of COVID-19 had profound lymphopenia and higher neutrophils, aminotransferases, and LDH than those with moderate forms. They also displayed higher inflammatory markers and a marked increase in D-dimer.
Circulating EV subsets were quantified by sensitive flow cytometry (Table 1). No striking differences between EV subsets were found between the moderate and severe forms of COVID-19. By contrast, the EV-TF activity was dramatically increased in patients with severe disease compared with that in patients with moderate disease (median, 231 [25th to 75th percentile, 39-761] vs median, 25 [25th to 75th percentile, 12-59] fM, respectively; P < .0001) (Figure 1A). This EV-TF activity was positively correlated with leukocytes (r = 0.41; P < .0001), neutrophils (r = 0.46; P < .0001), monocytes (r = 0.34; P < .0001), and inflammation parameters, including fibrinogen (r = 0.46; P < .0001), CRP (r = 0.40; P < .0001), and IL-6 (r = 0.29; P = .002), suggesting an immuno-inflammatory origin of the circulating EV-TF activity in patients with COVID-19.
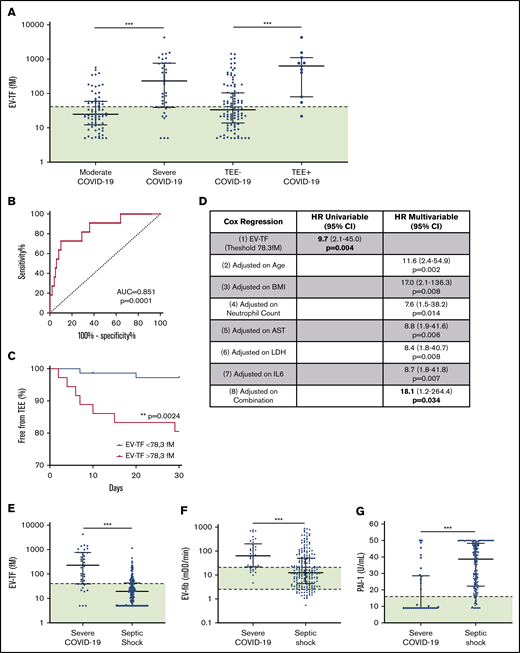
EV-TF activitywith COVID-19 severity and TEEs. (A) Plasma levels of EV-TF activity in patients with moderate (n = 73) or severe (n = 38) COVID-19 and in the presence (TEE-positive, n = 11) or absence (TEE-negative, n = 100) of TEEs. (B) Receiver operating characteristic curve for TEE prediction using EV-TF (red) area under the curve (AUC), 0.851. The Youden index was determined for EV-TF of 78.3 fM with a sensitivity of 0.818 and a specificity of 0.710. (C) Timing of TEE with an EV-TF threshold of 78.3fM, which is higher than 78.3 fM in red and lower than 78.3 fM in blue. (D) Logistic models (Cox regression): (1) unadjusted (EV-TF level only); (2-7) EV-TF adjusted for age, body mass index (BMI), neutrophil level, aspartate aminotranferase (AST) level, LDH level, and IL-6 level; and (8) adjusted with the combination of all parameters. (E-G) Plasma levels of EV-TF, EV-fib (fibrinolytic activity of EVs), and PAI-1 activity in patients with severe COVID-19 compared with patients with septic shock. The horizontal line and the error bars represent median and interquatile range, respectively. The green areas represent the range of values found in healthy donors. ** P < .01; ***P < .001. CI, confidence interval; HR, hazard ratio; mDO, milliOpticalDensity; TEE, thromboembolic event.
EV-TF activitywith COVID-19 severity and TEEs. (A) Plasma levels of EV-TF activity in patients with moderate (n = 73) or severe (n = 38) COVID-19 and in the presence (TEE-positive, n = 11) or absence (TEE-negative, n = 100) of TEEs. (B) Receiver operating characteristic curve for TEE prediction using EV-TF (red) area under the curve (AUC), 0.851. The Youden index was determined for EV-TF of 78.3 fM with a sensitivity of 0.818 and a specificity of 0.710. (C) Timing of TEE with an EV-TF threshold of 78.3fM, which is higher than 78.3 fM in red and lower than 78.3 fM in blue. (D) Logistic models (Cox regression): (1) unadjusted (EV-TF level only); (2-7) EV-TF adjusted for age, body mass index (BMI), neutrophil level, aspartate aminotranferase (AST) level, LDH level, and IL-6 level; and (8) adjusted with the combination of all parameters. (E-G) Plasma levels of EV-TF, EV-fib (fibrinolytic activity of EVs), and PAI-1 activity in patients with severe COVID-19 compared with patients with septic shock. The horizontal line and the error bars represent median and interquatile range, respectively. The green areas represent the range of values found in healthy donors. ** P < .01; ***P < .001. CI, confidence interval; HR, hazard ratio; mDO, milliOpticalDensity; TEE, thromboembolic event.
EV-TF activity was correlated positively with D-dimer (r = 0.55; P < .0001) and negatively with PT (r = –0.27; P = .005), showing a link with markers of COVID-19–induced coagulopathy. Moreover, EV-TF activity was significantly increased in patients with symptomatic clinical thromboembolic events within 28 days after sampling (median, 629 [25th to 75th percentile, 79-1104] vs median, 34 [25th to 75th percentile, 14-105] fM; P < .0001; Figure 1A). A cutoff value of 78 fM, about twice the upper limit of the value found in healthy donors,13 was determined on the receiver operating characteristic curve (area under the curve, 0.851; P < .0001; Figure 1B). This cutoff stratifies the hospitalized patients with COVID-19 into 2 groups with a significant difference in thrombotic risk (6.5% vs 1.9%; P = .002; Figure 1C). This increased risk of thrombosis in patients with EV-TF levels >78 fM was confirmed after the adjustment for age, body mass index, neutrophil count, aspartate aminotransferase, LDH, and IL-6 in multivariable Cox regression models (Figure 1D).
To better understand the degree of EV-associated hemostatic imbalance in patients with severe COVD-19, we compared the data with a parallel cohort of patients with septic shock not related to COVID-19, as a clinical situation associated with sepsis-induced coagulopathy (supplemental Table 1). Sex ratio and comorbidities were comparable between the 2 groups. Patients with severe COVID-19 were younger than those with septic shock. The samples were measured in the same laboratory with the same preanalytical conditions and methodology as that used for samples from patients with COVID-19. Interestingly, we observed striking differences between patients with COVID-19 and those with septic shock; there were significantly higher EV-TF (Figure 1E) and fibrinolytic activities (Figure 1F) in COVID-19 that were not associated with PAI-1 increase (Figure 1G).
These data demonstrate a distinct profile of COVID-associated coagulopathy with a strong procoagulant imbalance characterized by an extremely high level of EV-TF without peripheral fibrinolytic shutdown, which likely explains the high level of reported D-dimer.14 From a therapeutic perspective, these data support the international recommendation of systematic preventive anticoagulation in hospitalized patients15 and a potential intensification in patients with severe disease. As previously discussed,16-19 the benefit of a profibrinolytic therapeutic approach remains questionable because of the maintenance of fibrinolytic activity in patients and increased bleeding risk20 in COVID-19. However, the fibrinolytic system seems finally overwhelmed, suggesting that a PAI-1 increase can occur in patients with severe COVID-19 in the final stages of the disease.21
In summary, this study is the first to report the dissemination of extreme levels of EV-TF in severe COVID-19. The intercellular transfer of TF via EVs or the direct contribution of EV-TF to thrombus growth may contribute to the link between inflammation and thrombosis. EV-TF may be an appropriate tool for stratifying patients with the highest risk of thrombosis and for personalization of anticoagulant therapy.
To request data, please contact the corresponding author Françoise Dignat-George by e-mail at francoise.dignat-george@univ-amu.fr.
Acknowledgments
The authors thank Patricia Berenger, Cécile Daou, Clara Degioanni, and Léa Plantureux for their technical help during this study, and they are grateful to the many front-line medical and technical staff for their dedication in the face of this outbreak, despite the potential threat to their lives and the lives of their families.
This study was supported by Aix-Marseille University, INSERM, and Assistance Publique–Hôpitaux de Marseille.
Authorship
Contribution: C.G. initiated and performed the research, analyzed and interpreted the data, and helped write the manuscript; A.B., S.B., and G.K. performed the study and analyzed and interpreted the data; F.S., R.C., E.A., L.A., G.L., L. Pietri, T.R., M.V., L. Papazian, and J.A. performed the research; F.D.-G. and R.L. supervised the work and wrote the manuscript; and all authors critically revised the manuscript for important intellectual content and gave final approval for the version to be published.
Conflict-of-interest disclosure: F.D.-G. and R.L. received grants from Stago and a patent on microvesicle fibrinolytic activity licensed to Stago. C.G. received personal fees from Xenios (a Fresenius Medical Care company). S.B. received personal fees from Otsuka, Bayer, and Sanofi. These disclosures are outside the submitted work. The remaining authors declare no competing financial interests.
Correspondence: Françoise Dignat-George, Unité de Formation et de Recherche Pharmacie-Aix Marseille Université, 27 Bd Jean Moulin, 13005 Marseille, France; e-mail: francoise.dignat-george@univ-amu.fr.

