

Key Points
The expression of ALCAM was positively correlated with patients’ survival.
ALCAM-EGFR interaction regulates myelomagenesis via the crosstalk among Mek/Erk signaling, PI3K/Akt signaling, and hedgehog pathway.

Abstract
Multiple myeloma, a plasma cell malignancy in the bone marrow, remains largely incurable with currently available therapeutics. In this study, we discovered that the activated leukocyte cell adhesion molecule (ALCAM) interacted with epidermal growth factor receptor (EGFR), and regulated myelomagenesis. ALCAM was a negative regulator of myeloma clonogenicity. ALCAM expression was positively correlated with patients’ survival. ALCAM-knockdown myeloma cells displayed enhanced colony formation in the presence of bone marrow stromal cells (BMSCs). BMSCs supported myeloma colony formation by secreted epidermal growth factor (EGF), which bound with its receptor (EGFR) on myeloma cells and activated Mek/Erk cell signaling, PI3K/Akt cell signaling, and hedgehog pathway. ALCAM could also bind with EGFR, block EGF from binding to EGFR, and abolish EGFR-initiated cell signaling. Hence, our study identifies ALCAM as a novel negative regulator of myeloma pathogenesis.
Introduction
Multiple myeloma (MM) is a hematological cancer with malignant plasma cell growth primarily in the bone marrow (BM) and remains largely incurable despite recent advances in the treatment.1,2 Most patients undergo multiple cycles of chemotherapy, during which drug-resistant MM clones develop and dominate the neoplastic population, ultimately causing treatment failure.3 Therefore, a better understanding of the molecular mechanisms regulating myeloma pathogenesis will help develop more effective treatment of the disease.
Activated leukocyte cell adhesion molecule (ALCAM), a type I transmembrane glycoprotein, is a member of the immunoglobulin superfamily highly expressed by neuronal, endothelial, hematopoietic, and epithelial cells.4,5 ALCAM regulates various fundamental biological functions, such as cell adhesion, cell migration, autophagy and apoptosis, angiopoiesis, and hematopoiesis.5-7 As a cell adhesion molecule, ALCAM is known to interact with its ligand CD6 and mediate intercellular adhesion and migration.8 Furthermore, the expression of ALCAM correlates with the disease progression in prostate cancer, breast cancer, colorectal carcinoma and melanoma.7,9-11 In our previous work, we showed that macrophage migration inhibitory factor (MIF) regulated MM homing to the BM and that ALCAM was downstream of MIF-initiated cell signaling in MM.12 MIF knockdown repressed the expressions of a panel of adhesion molecules on MM cells, including ALCAM, therefore reducing MM cell adhesion to the BM. However, the function of ALCAM in MM is largely unknown. In this study, we showed that ALCAM suppressed MM clonogenic within the BM microenvironment.
Materials and methods
Patient samples
BM aspirations from newly diagnosed patients with MM were provided by the tissue bank of the Department of Hematology, West China Hospital, Sichuan University, and processed as previously described.12 Informed consent was obtained and the study protocol was approved by the Ethical Committee of West China Hospital of Sichuan University and conformed to the Declaration of Helsinki.
Cell culture
Cell culture was performed as described in supplemental Methods.
Antibodies and reagent
For detailed information on antibodies and reagents, see supplemental Methods.
Lentivirus packaging and infection
The control virus and short hairpin RNA (shRNA) virus were obtained from Transmoic (#TLHVU2300). The following oligonucleotides were used as shRNA sequences against ALCAM (sh1, 5'-CAGAGGAATCTCCTTATATA-3'; sh2, 5'-CCGAAGGAATAAGAAGCTCAA-3'). To generate MM cells with consistent low ALCAM expression, human MM cell lines RPMI8226 and MM.1S were infected with 2 different ALCAM shRNA lentivirus. After infection, transduced cells were selected and maintained in a puromycin+ (Sigma Aldrich) culture medium.
ALCAM complementary DNA (cDNA) was synthesized with flag tag sequence added at the downstream of the cDNA (Genewiz Inc, China). The cDNA was subcloned into the pLEX-MCS vector for lentivirus package. RPMI8226 cells with consistent ALCAM overexpression were generated as mentioned previously.
For viral infection, cells were plated onto 6-well plates at 1 × 10⁵ cells/well and then infected with lentiviral stocks in presence of polybrene.
Bioinformatics
MM gene expression profile (GEP) datasets GSE4452,13 GSE2658,14 GSE19784,15 GSE13591,16 GSE70399,17 and GSE978218 were downloaded from the NCBI Gene Expression Omnibus database. The clinical information of those patients was downloaded from Oncomine (www.oncomine.org). We also downloaded an MM GEP dataset from the University of Arkansas for Medical Science19 for this study. Gene mutations in primary MM cells and cancer cell lines were analyzed and plotted by cBioPortal software (http://www.cbioportal.org/). EGFR and ALCAM expression in the GSE8546 dataset were analyzed and plotted by Oncomine (www.oncomine.org).
Protein structure simulation
The structure simulation was performed by Mol Designer Inc using ZDOCK3.0.2 software (https://zdock.umassmed.edu/). All calculations and analyses were performed using MolDesigner Molecular Simulation Platform. The structures of ALCAM extracellular region and epidermal growth factor receptor (EGFR) extracellular region were retrieved from the RCSB protein data bank (www.rcsb.org) with PDB ID 5A2F and 1NQL, respectively.
Animal models
All mouse studies complied with protocols approved by the Sichuan University, West China Hospital Institutional Animal Care and Use Committee.
These assays were performed as described in supplemental Methods.
Western blot analysis, immunohistochemistry staining, immunofluorescence staining, coimmunoprecipitation, and flow cytometry analysis
These assays were performed as described in supplemental Methods.
Quantitative reverse transcription PCR
The quantitative reverse transcription polymerase chain reaction (qRT-PCR) was performed as described earlier.12 Total RNA was extracted from MM cell lines using TRIzol reagent (Invitrogen). Reverse transcription was performed using the Evo M-MLV RT kit (Accurate Biotechnology, China). qRT-PCR (CFX; Bio-Rad) was performed using SYBR Green qPCR Master Mix (Bimake, China). The primers’ sequences are listed in supplemental Table 1.
Three-dimensional, printing-based cell culture
A DLP photopolymerization 3-dimensional (3D) printer was used to construct a cubic chamber for cell culture using PEGDA 700, lithium phenyl-2,4,6-trimethylbenzoylphosphinate, complete cell culture medium, and cells. MM cells were prelabeled with CellTrace CSFE (Invitrogen), and BM stromal cells (BMSCs) were labeled with CellTrace Far Red (Invitrogen). Labeled MM cells were cocultured with BMSCs with 1:2 ratio for 3D printing. After 3D printing, the cubic chambers containing the cells were placed in culture medium in a 6-well plate.
Colony formation assay
Colony formation assay on soft agar was performed as previously described.20 In some experiments, MM cells were cocultured with BMSCs with 1:2 ratio for colony formation assay.
Proximity ligation assay
A Duo link-based Proximity ligation assay was performed using a kit from Sigma Aldrich following the manufacturer’s instructions. Primary antibodies used were anti-ALCAM and anti-EGFR. Stained cells were captured using confocal laser-scanning microscope (Nikon, Japan).
Mass spectrometry
Mass spectrometry was used to identify ALCAM interacting molecules. RPMI8226 cell lysate was used for immunoprecipitation. The 2 groups included immunoglobulin G pull-down and ALCAM pull-down, with triplicate samples in each group. Precipitated proteins were fractionated by sodium dodecyl sulfate polyacrylamide gel electrophoresis. After electrophoresis, the entire sample lane was excised, and digested with tryptic, followed by desalting with C18 stagetip column. All samples were analyzed by SCE higher energy collisional dissociation tandem mass spectometry (MS) using an Orbitrap Fusion Lumos Tribrid (Thermo Fisher Scientific). In brief, samples separated on a C18 capillary column over a 120-minute gradient. MS1 was analyzed with a scan range (m/z) of 350 to 1700 at an orbitrap resolution of 60 000. The radio frequency lens, auto gain control target, maximum injection time, and exclusion duration were 30%, 4.0 e5, 50 ms, and 30 seconds, respectively. MS2 was analyzed with an isolation window (m/z) of 1.6 at an orbitrap resolution of 60 000. The auto gain control target, maximum injection time, and collision energy were 10 000 ms, 30 ms, and 30%, respectively. Activity type was higher energy collisional dissociation. The peptides were searched by MaxQuant (Version 1.6.2.6) using Uniprot database to identify target proteins. Subsequent data analysis was performed using R statistical software version 3.6.0. The median normalization strategy was used in data analysis. Analysis of Student t test with a false discovery rate < 0.05 after Benjamini-Hochberg correction was used for the screening of significantly changed proteins.
Cell growth
Cell growth was assessed by Cell Counting Kit-8 (CCK8; Dojindo Laboratories, Japan) following the manufacturer’s instructions.
Statistical analysis
All data are shown as mean ± standard deviation. Survival rate was evaluated using Kaplan-Meier estimates and log-rank tests. Patients were ranked by gene expression, and the median expression value was identified. Patients with higher gene expression than the median value were considered as high expression, whereas the rest were categorized as the low-expression group. The relation of the patient characteristics and ALCAM expression was determined by the 1-way analysis of variance (ANOVA) and the χ2 test. Student t test was used to compare 2 experimental groups. The ANOVA was used when comparing more than 2 groups. A P value < .05 was considered statistically significant.
Results
Clinical significance of ALCAM expression in myeloma
To examine the clinical significance of ALCAM expression in MM, we performed microarray-based analyses as previously described.12 Published GEPs of patients with MM were downloaded. GEPs from the MMRF CoMMpass dataset21 (https://research.themmrf.org) and Zhan’s dataset,14 2 independent datasets, both showed that lower ALCAM expression had shorter overall survival (OS) than those with higher expression (Figure 1A).14 Using Zhan’s dataset, we found that patients with early death (patients lost within 5 years after diagnosis) had significant lower ALCAM expression than patients that survived more than 5 years (supplemental Figure 1A). ALCAM expression also correlated with relapsed patient survival (Figure 1B).18 Zhan et al and Broyl et al classified MM with gene mutations and signature molecule expression patterns.14,15,22 In those 2 independent datasets with cluster subgroups, we found that patients with MM in the proliferation (PR) cluster, which was originally defined as patients with high expression of proliferation genes, such as CCNB2, CCNB1, TYMS,14 and progressive disease, had lower ALCAM expression than other groups (Figure 1C). Because patients with ALCAMlow MM were mainly in PR subgroup, we further analyzed OS of patients with MM without PR subgroup in Zhan’s dataset.14 Our results showed that in patients with non-PR MM, ALCAM expression also correlated with OS (supplemental Figure 1B). Moreover, the high-risk MM cluster that expressed high cancer testis antigens, which are important for MM clonogenic growth,15,22 had the lowest ALCAM expression (Figure 1C, left). Next, recurrent MM cells had significantly lower ALCAM expression than primary tumors (Figure 1D). Furthermore, analysis of paired samples in MMRF CoMMpass dataset showed that for patients with MM who died because of the tumor progression, most had downregulation of ALCAM in recurrent MM, compared with primary MM (supplemental Figure 1C).13 These results indicate a decreasing trend of ALCAM expression during MM progression. Analyzing both Zhan’s and Agnelli’s datasets,14,16 we found that MM with 1q21 gain, which might be categorized as high-risk MM, had lower ALCAM expression than those without the mutation (supplemental Figure 1D). Thus, these data indicate that reduced expression of ALCAM by MM cells is adversely correlated to MM progression and suggest that ALCAM may be a suppressor or negative regulator of MM pathogenesis.
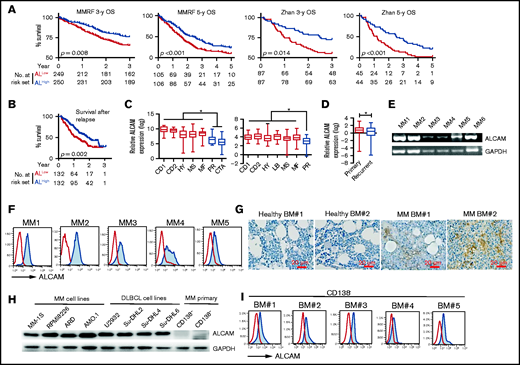
ALCAM expression in myeloma cells. Microarray-based analyses of ALCAM expression correlated MM clinical factors. From left to right (A), OS of MMRF CoMMpass patients for 3 years, 5 years, and Zhan’s patients for 3 years and 5 years; OS of postrelapse survival (B) in ALCAMhigh vs ALCAMlow groups of patients with MM, analyzed using microarray datasets GSE9782 (ALCAMhigh vs ALCAMlow groups of patients with MM are defined by the median value of ALCAM expression). (C) ALCAM expression in molecular clusters of MM. The molecular classification of MM includes 7 subgroups: PR (proliferation), LB (low bone disease), MS (MMSET), HY (hyperdiploid), CD-1 (CCND1 gene amplification), CD-2 (CCND3 gene amplification), and MF (MAF/MAFB gene amplification). The left panel is from the analysis of Broyl’s dataset (GSE19784); the right panel is from the analysis of Zhan’s dataset (GSE2658). (D) ALCAM expression in primary MM vs recurrent disease (GSE4452). (E) RT-PCR amplification of ALCAM transcript from 6 different primary MM cells. (F) Flow cytometry analysis of ALCAM expression in primary MM cells. (G) Immunohistochemistry staining of ALCAM in healthy BM and MM BM biopsies (2 of 5). (H) western blotting of ALCAM expression in different human MM cell lines, Diffuse large B-cell lymphoma (DLBCL) cell lines and primary MM CD138− cells. (I) Flow cytometry analysis of ALCAM expression in MM CD138− cells. The data were obtained from 3 independent experiments. Kaplan-Meier curves showing OS rates associated with ALCAM expression in MM, and tested by log-rank test (A,B). Two-tailed Student’s t test (D) or 1-way ANOVA (C) with multiple comparisons. *P < .05.
ALCAM expression in myeloma cells. Microarray-based analyses of ALCAM expression correlated MM clinical factors. From left to right (A), OS of MMRF CoMMpass patients for 3 years, 5 years, and Zhan’s patients for 3 years and 5 years; OS of postrelapse survival (B) in ALCAMhigh vs ALCAMlow groups of patients with MM, analyzed using microarray datasets GSE9782 (ALCAMhigh vs ALCAMlow groups of patients with MM are defined by the median value of ALCAM expression). (C) ALCAM expression in molecular clusters of MM. The molecular classification of MM includes 7 subgroups: PR (proliferation), LB (low bone disease), MS (MMSET), HY (hyperdiploid), CD-1 (CCND1 gene amplification), CD-2 (CCND3 gene amplification), and MF (MAF/MAFB gene amplification). The left panel is from the analysis of Broyl’s dataset (GSE19784); the right panel is from the analysis of Zhan’s dataset (GSE2658). (D) ALCAM expression in primary MM vs recurrent disease (GSE4452). (E) RT-PCR amplification of ALCAM transcript from 6 different primary MM cells. (F) Flow cytometry analysis of ALCAM expression in primary MM cells. (G) Immunohistochemistry staining of ALCAM in healthy BM and MM BM biopsies (2 of 5). (H) western blotting of ALCAM expression in different human MM cell lines, Diffuse large B-cell lymphoma (DLBCL) cell lines and primary MM CD138− cells. (I) Flow cytometry analysis of ALCAM expression in MM CD138− cells. The data were obtained from 3 independent experiments. Kaplan-Meier curves showing OS rates associated with ALCAM expression in MM, and tested by log-rank test (A,B). Two-tailed Student’s t test (D) or 1-way ANOVA (C) with multiple comparisons. *P < .05.
We examined ALCAM expression in MM BM to confirm the gene array results. ALCAM expression in CD138+ MM cells was validated at both the messenger RNA and protein levels by qPCR and flow cytometry, respectively (Figure 1E-F). Immunohistochemistry analysis of MM and healthy BM biopsies showed that MM BM had increased ALCAM expression (Figure 1G). The expression of ALCAM in human MM cell lines, diffuse large B-cell lymphoma cell lines and MM primary cells was also examined (Figure 1H-I). Thus, our results confirm that myeloma cells express ALCAM and expression levels correlate to myeloma disease status and survival.
ALCAM regulates myeloma clonogenicity in vitro
To study the function of ALCAM in MM, we established control-knockdown (CTR-KD) and ALCAM-knockdown (AL-KD1 and AL-KD2) MM cell lines with consistently reduced ALCAM expression (Figure 2A-C). We mainly used the AL-KD2 cells (labeled as AL-KD) throughout our study.
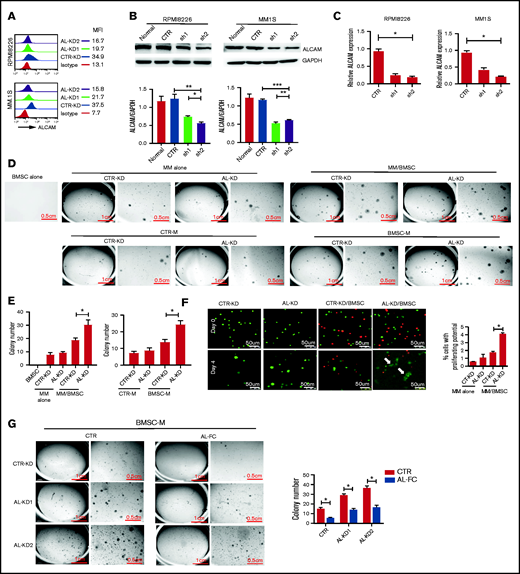
BM stroma-derived soluble factors promoted ALCAM-knocked down myeloma cell clonogenicity. (A) Flow cytometry of surface ALCAM expression in CTR-KD, AL-KD1 (shRNA sequence 1), and AL-KD2 (shRNA sequence 2) MM cells. The number indicates mean fluorescence intensity (MFI). (B) Top: western blotting of ALCAM expression in CTR-KD vs AL-KD MM cells in RPMI8226 and MM.1S; bottom: result quantification. (C) Expression of ALCAM messenger RNA in CTR-KD vs AL-KD MM cells (RPMI8226 and MM.1S) analyzed by qRT-PCR. (D) Imaging of colony formation assays in RPMI8226/BMSC cocultured condition (top) and BMSC conditioning medium (BMSC-M) (bottom). BMSCs from healthy individuals. The results are quantified in (E) left panel and right panel, respectively. The data were obtained from 3 independent experiments and shown as the mean ± SD. (F) Immunofluorescence microscopy of cells (RPMI8226-CTR vs RPMI8226-ALCAM-KD) under 3D printing. The data were obtained from 10 randomly chosen fields and shown as the mean ± SD. The results are summarized in the right panel. (G) Soft agar assay showing that soluble ALCAM-Fc (0.5 mg/mL) attenuated BMSC-M conferred RPMI8226-CTR cells and RPMI8266-ALCAM-KD clonogenicity. The data are shown as the mean ± SD. (B,E-G) Two-tailed Student t test or (C) 1-way ANOVA with multiple comparisons. *P < .05; **P < .01; ***P < .001.
BM stroma-derived soluble factors promoted ALCAM-knocked down myeloma cell clonogenicity. (A) Flow cytometry of surface ALCAM expression in CTR-KD, AL-KD1 (shRNA sequence 1), and AL-KD2 (shRNA sequence 2) MM cells. The number indicates mean fluorescence intensity (MFI). (B) Top: western blotting of ALCAM expression in CTR-KD vs AL-KD MM cells in RPMI8226 and MM.1S; bottom: result quantification. (C) Expression of ALCAM messenger RNA in CTR-KD vs AL-KD MM cells (RPMI8226 and MM.1S) analyzed by qRT-PCR. (D) Imaging of colony formation assays in RPMI8226/BMSC cocultured condition (top) and BMSC conditioning medium (BMSC-M) (bottom). BMSCs from healthy individuals. The results are quantified in (E) left panel and right panel, respectively. The data were obtained from 3 independent experiments and shown as the mean ± SD. (F) Immunofluorescence microscopy of cells (RPMI8226-CTR vs RPMI8226-ALCAM-KD) under 3D printing. The data were obtained from 10 randomly chosen fields and shown as the mean ± SD. The results are summarized in the right panel. (G) Soft agar assay showing that soluble ALCAM-Fc (0.5 mg/mL) attenuated BMSC-M conferred RPMI8226-CTR cells and RPMI8266-ALCAM-KD clonogenicity. The data are shown as the mean ± SD. (B,E-G) Two-tailed Student t test or (C) 1-way ANOVA with multiple comparisons. *P < .05; **P < .01; ***P < .001.
Functionally, CTR-KD and AL-KD MM cells showed no difference in cell survival, proliferation, or drug response under in vitro cell culture conditions (supplemental Figure 1E-F). CTR-KD and AL-KD RPMI8226 cells cultured alone exhibited equally low numbers of colonies when a colony formation assay in soft agar was performed, as previously described.20 However, AL-KD MM cells cocultured with BMSCs from healthy individuals formed significantly more colonies than BMSC-cocultured CTR-KD cells (Figure 2D, top; Figure 2E, left). Interestingly, BMSC-conditioned medium (BMSC-M) was sufficient to stimulate MM cells, especially AL-KD MM cells, to establish more colonies (Figure 2D, bottom; Figure 2E, right), suggesting that BMSC-derived soluble factors may have contributed to the increased clonogenicity of AL-KD MM cells. Similar results were obtained with another MM.1S cell line (supplemental Figure 2A-D). Different AL-KD MM cell lines, derived from different ALCAM shRNA lentivirus infection, showed similar clonogenicity activity in culture with BMSC-M (supplemental Figure 2E). Moreover, AL-OE cells exhibited decreased clonogenicity (supplemental Figure 2F-H). These observations indicate that ALCAM may indeed be a suppressor or negative regulator of MM clonogenicity because of AL-KD MM cells exhibiting increased colony formation when cocultured with BMSCs or their conditioned medium.
We also examined the early biological events in MM cells in 3D coculture with BMSCs. Because soft agar is hard to manipulate for fluorescent microscopy, we used a 3D printing technology to infuse carboxyfluorescein succinimidyl ester-labeled MM cells and CellTrace Far Red-labeled BMSCs into a matrix (supplemental Figure 2I). The same number of MM cells was used in all groups. Four days after coculture, the cells were examined by confocal fluorescent microscopy. As shown in Figure 2F, AL-KD MM (green) cells cocultured with BMSCs (red) formed cell clusters with reduced florescent intensity (white arrows), suggesting that BMSCs stimulated AL-KD MM cells to divide and proliferate under 3D culture (Figure 2F). However, addition of ALCAM-Fc protein suppressed clonogenicity in CTR-KD and AL-KD MM cells (Figure 2G).
Because ALCAM was known as an adhesion molecule and previous work suggested that adhesion role of ALCAM contributed to MM bone disease progression,23 we evaluated adhesion function of ALCAM in myeloma clonogenicity. ALCAM mediates both cell–cell and cell–matrix adhesions.8 Specifically, cell–cell adhesion is mediated via homophilic ALCAM–ALCAM interaction or heterophilic ALCAM-CD6 interaction between adjacent cells. First, our results that ALCAM knockdown did not stimulate MM colony formation (Figure 2D-E; supplemental Figure 2A-I) precluded the possibility that cell–matrix adhesion mediated by ALCAM or homophilic interaction of ALCAM between MM cells played a role in MM clonogenicity. Second, flow cytometry analysis showed that MM cell lines did not express CD6, the heterophilic ligand of ALCAM (supplemental Figure 3A). Addition of CD6 blocking antibody did not affect BMSC coculture-stimulated colony formation (supplemental Figure 3B). Therefore, our data indicate that ALCAM function in MM clonogenicity is independent of its adhesion activity.
ALCAM interacts with EGFR in myeloma cells
To elucidate the molecular mechanism of ALCAM regulation of MM clonogenicity, we determined the proteins interacting with ALCAM using immunoprecipitation followed by MS. The result showed that EGFR was one of the enriched proteins (supplemental Figure 4A). Because ALCAM is a cell surface molecule, we focused on membrane proteins such as EGFR. To confirm the interaction between ALCAM and EGFR, we performed proximity ligation assay and identified that ALCAM interacted with EGFR in both MM cell lines and patient primary MM cells (Figure 3A). The interaction between ALCAM and EGFR in RPMI8226 cells was also confirmed by immunoprecipitation (Figure 3B). Next, we used immunofluorescence staining to examine subcellular localizations of ALCAM and EGFR in RPMI8226 and MM.1S cells (Figure 3C-F). ALCAM colocalized well with inactive EGFR proteins, but not with phosphorylated EGFR (pEGFR), which is its active form (Figure 3D-F). Our results also indicated that ALCAM knocking down did not affect the level of EGFR in RPMI8226 cells. After adding recombinant EGF, the canonical ligand of EGFR, to MM cell culture to induce EGFR phosphorylation and stimulate signaling, a reduced colocalization of ALCAM with inactive EGFR was noted (Figure 3G-H), suggesting that ALCAM may interact only with the inactive form of EGFR in MM cells, and phosphorylation of EGFR by EGF reduces the interaction between ALCAM and EGFR proteins. Finally, we performed a structural simulation to visualize the interaction between these proteins. As shown in Figure 3I, supplemental Figure 4B-C, and supplemental Table 2, both EGF (left) and ALCAM (right; only ALCAM extracellular motif is shown) were able to bind to the EGFR extracellular motif. EGF and ALCAM were more likely to bind to the same region on EGFR, and ALCAM had a higher affinity than EGF, based on ZDOCK score calculated by structural simulation. Finally, we showed that ALCAM competed with EGF for binding with EGFR using immunoprecipitation assay. In a cell-free system, addition of ALCAM-Fc, in a dose-dependent manner, attenuated the binding of EGF to EGFR (Figure 3J, top). Moreover, addition of recombinant EGF interrupted EGFR-ALCAM binding with a dose dependent manner (Figure 3J, bottom). Together, these data indicate that ALCAM may block EGF-EGFR signaling by competing with EGF for EGFR binding.

ALCAM interacted with EGFR in myeloma cells. (A) Proximity ligation assay showing ALCAM and EGFR interaction in human MM cell lines (normal RPMI8226, MM1S cells, and ALCAM-KD cells) and primary MM cells (2 of 5) under fluorescence microscopy. The cell nucleus was stained using DAPI (blue). The white arrow points to the site with a positive signal (red spot). Staining EGFR and ALCAM in RPMI8226 cells alone as the negative control. (B) Left: immunoprecipitation of ALCAM and EGFR in RPMI8226 cells, followed by the western blotting of EGFR (top) and ALCAM (bottom), respectively; right: immunoprecipitation of ALCAM and EGFR in RPMI8226 cells, followed by the western blotting of ALCAM (top) and EGFR (bottom), respectively. (C) Confocal fluorescence microscopy analysis of immunofluorescently stained RPMI8226 cells. The y-axis indicates the value of integrated optical density, which could demonstrate the colocalization of ALCAM and EGFR or pEGFR. The data were obtained from 10 randomly choose fields and shown as the mean ± SD. Red, ALCAM; green, EGFR or pEGFR; blue, DAPI for nucleus. (D) Result quantification. (E) Similarly performed experiment as in panel C with RPMI8226-ALCAM- KD cells; results are summarized in panel F. The data were obtained from 3 independent experiments and shown as the mean ± SD. (G) The same immunofluorescence staining of ALCAM and EGFR in MM cells RPMI8226 with or without addition of recombinant EGF (10 ng/mL) for 1 hour. (H) Result quantification. (I) Structure simulation showing the interaction of EGF-EGFR extracellular domain (left) and ALCAM-EGFR extracellular domains (right). EGFR extracellular domain structure is shown in the black and white surface. The higher ZDOCK score indicates higher binding affinity. (J) Top: recombinant EGF (0.5 μg/mL) and EGFR (1 μg/mL) were dissolved in Tris-HCl buffer (pH = 7.4) in the presence of increasing doses of ALCAM-Fc (−, without ALCAM-Fc; +, ALCAM-Fc 0.5 μg/mL; ++, ALCAM-Fc 1 μg/mL), after 30 minutes’ incubation on ice, the mixtures were subjected for immunoprecipitation using αEGF antibody, followed by the western blotting of EGFR and EGF, respectively; bottom: ALCAM-Fc (0.5 μg/mL) and EGFR (1 μg/mL) were dissolved in Tris-HCl buffer (pH = 7.4) in the presence of increasing doses of recombinant EGF (−, without recombinant EGF; +, recombinant EGF 1 μg/mL; ++, recombinant EGF 2 μg/mL), after 30 minutes’ incubation on ice, the mixtures were subjected for immunoprecipitation using αALCAM antibody, followed by the western blotting of EGFR and ALCAM, respectively. All data in bar graphs were assessed by 2-tailed Student t test. *P < .05.
ALCAM interacted with EGFR in myeloma cells. (A) Proximity ligation assay showing ALCAM and EGFR interaction in human MM cell lines (normal RPMI8226, MM1S cells, and ALCAM-KD cells) and primary MM cells (2 of 5) under fluorescence microscopy. The cell nucleus was stained using DAPI (blue). The white arrow points to the site with a positive signal (red spot). Staining EGFR and ALCAM in RPMI8226 cells alone as the negative control. (B) Left: immunoprecipitation of ALCAM and EGFR in RPMI8226 cells, followed by the western blotting of EGFR (top) and ALCAM (bottom), respectively; right: immunoprecipitation of ALCAM and EGFR in RPMI8226 cells, followed by the western blotting of ALCAM (top) and EGFR (bottom), respectively. (C) Confocal fluorescence microscopy analysis of immunofluorescently stained RPMI8226 cells. The y-axis indicates the value of integrated optical density, which could demonstrate the colocalization of ALCAM and EGFR or pEGFR. The data were obtained from 10 randomly choose fields and shown as the mean ± SD. Red, ALCAM; green, EGFR or pEGFR; blue, DAPI for nucleus. (D) Result quantification. (E) Similarly performed experiment as in panel C with RPMI8226-ALCAM- KD cells; results are summarized in panel F. The data were obtained from 3 independent experiments and shown as the mean ± SD. (G) The same immunofluorescence staining of ALCAM and EGFR in MM cells RPMI8226 with or without addition of recombinant EGF (10 ng/mL) for 1 hour. (H) Result quantification. (I) Structure simulation showing the interaction of EGF-EGFR extracellular domain (left) and ALCAM-EGFR extracellular domains (right). EGFR extracellular domain structure is shown in the black and white surface. The higher ZDOCK score indicates higher binding affinity. (J) Top: recombinant EGF (0.5 μg/mL) and EGFR (1 μg/mL) were dissolved in Tris-HCl buffer (pH = 7.4) in the presence of increasing doses of ALCAM-Fc (−, without ALCAM-Fc; +, ALCAM-Fc 0.5 μg/mL; ++, ALCAM-Fc 1 μg/mL), after 30 minutes’ incubation on ice, the mixtures were subjected for immunoprecipitation using αEGF antibody, followed by the western blotting of EGFR and EGF, respectively; bottom: ALCAM-Fc (0.5 μg/mL) and EGFR (1 μg/mL) were dissolved in Tris-HCl buffer (pH = 7.4) in the presence of increasing doses of recombinant EGF (−, without recombinant EGF; +, recombinant EGF 1 μg/mL; ++, recombinant EGF 2 μg/mL), after 30 minutes’ incubation on ice, the mixtures were subjected for immunoprecipitation using αALCAM antibody, followed by the western blotting of EGFR and ALCAM, respectively. All data in bar graphs were assessed by 2-tailed Student t test. *P < .05.
EGF-EGFR signaling contributes to myeloma clonogenicity
Based on structural simulation, we hypothesized that EGF was the soluble factor that regulated MM clonogenicity. To test our hypothesis, we performed a colony formation assay in the presence of an EGF neutralizing antibody. As shown in Figure 4A-B, in the presence of EGF neutralizing antibody, BMSC-M-induced MM clonogenicity was repressed in CTR-KD and AL-KD cells in a dose-dependent manner. In contrast, recombinant EGF stimulated MM cell colony formation even in the absence of BMSCs (Figure 4C-D). Under regular culture conditions, AL-KD cells had slightly higher level of pEGFR (Y1173) than CTR-KD cells. When cultured in BMSC-conditioning medium, both CTR-KD and AL-KD had upregulated pEGFR (Y1173) (Figure 4E). We also found that addition of the EGF neutralizing antibody repressed EGFR phosphorylation in MM cells in BMSC-M (Figure 4E). These results indicate that BMSC-derived soluble factor EGF contributes to EGFR pathway activation in MM cells. Finally, we examined EGF expression in BMSC-M and patient BM and detected high levels of the cytokine in patient BM (Figure 4F). These results indicate that EGF-EGFR signaling is important for MM clonogenicity.
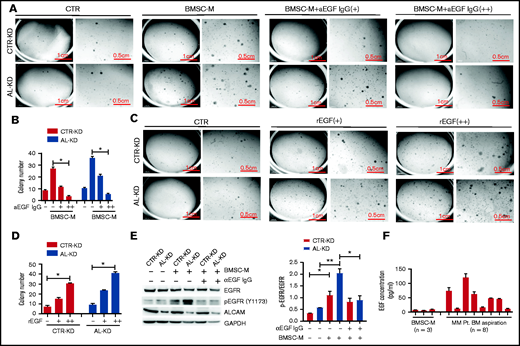
EGF promoted myeloma cells clonogenicity. (A) Imaging of colony-forming assays using RPMI8226 cells (CTR-KD and AL-KD) in the presence of EGF neutralizing antibody (+, EGF neutralizing antibody 10 μg/mL; ++, EGF neutralizing antibody 30 μg/mL). The results are quantified in panel B. (C) Colony-forming assay and (D) statistic result of RPMI8226 (CTR-KD and AL-KD) cells in the presence of recombinant EGF (CTR, without rEGF; +, rEGF 10 ng/mL; ++, rEGF 20 ng/mL). (E) RPMI8226 cells were cultured in CTR-M or BMSC-M in the presence of EGF-neutralizing antibody (10 μg/mL) for 48 hours. The EGFR activation was examined by western blotting for pEGFR (Y1173). The results are quantified in the right panel. (F) EGF concentration in BMSC-M (BMSCs from 3 healthy individuals) and BM aspirations from patients with MM (8 patients) was examined by enzyme-linked immunosorbent assay. (E) Two-tailed Student t test or (B,D) 1-way ANOVA with multiple comparisons. *P < .05, **P < .01.
EGF promoted myeloma cells clonogenicity. (A) Imaging of colony-forming assays using RPMI8226 cells (CTR-KD and AL-KD) in the presence of EGF neutralizing antibody (+, EGF neutralizing antibody 10 μg/mL; ++, EGF neutralizing antibody 30 μg/mL). The results are quantified in panel B. (C) Colony-forming assay and (D) statistic result of RPMI8226 (CTR-KD and AL-KD) cells in the presence of recombinant EGF (CTR, without rEGF; +, rEGF 10 ng/mL; ++, rEGF 20 ng/mL). (E) RPMI8226 cells were cultured in CTR-M or BMSC-M in the presence of EGF-neutralizing antibody (10 μg/mL) for 48 hours. The EGFR activation was examined by western blotting for pEGFR (Y1173). The results are quantified in the right panel. (F) EGF concentration in BMSC-M (BMSCs from 3 healthy individuals) and BM aspirations from patients with MM (8 patients) was examined by enzyme-linked immunosorbent assay. (E) Two-tailed Student t test or (B,D) 1-way ANOVA with multiple comparisons. *P < .05, **P < .01.
ALCAM suppresses EGF-initiated pro-clonogenic cell signaling in myeloma cells
Our data suggest that EGFR, activated by its ligand EGF, initiates a pro-clonogenic cell signaling in MM cells. ALCAM competes with EGF for binding to EGFR and thus suppresses EGF-induced pro-clonogenic signaling. To elucidate the molecular mechanism, we performed pathway enrichment analyses based on MM patients’ gene expression profiles. As shown in Figure 5A, hedgehog pathway genes’ activation was enriched in EGFRhigh MM cells. Based on the literature of EGFR downstream cell signaling24-28 and the result of pathway enrichment, we hypothesized that ALCAM-EGFR regulated myelomagenesis via the crosstalk among PI3K/Akt cell signaling, Mek/Erk cell signaling, and hedgehog pathway.
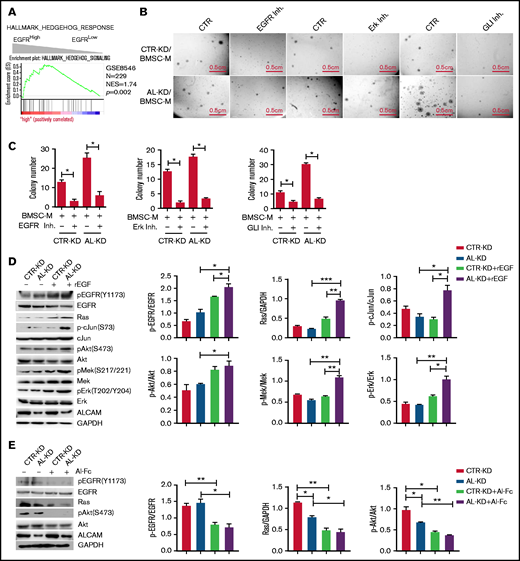
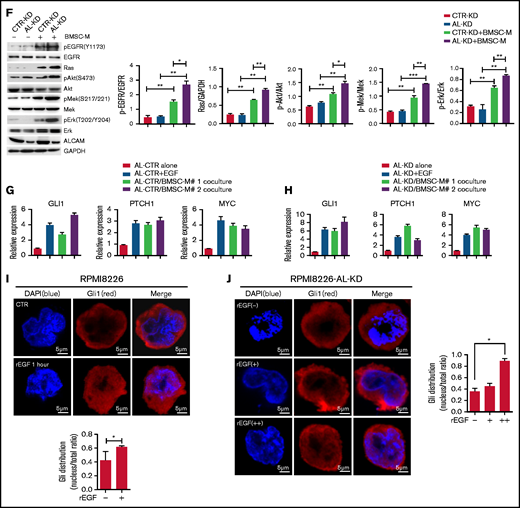
ALCAM suppressed EGFR-initiated hedgehog pathway activation. (A) Gene Set Enrichment Analysis showing hedgehog pathway gene enrichment in EGFRhigh MM cells. (B) Colony formation assay of CTR-KD or AL-KD RPMI8226, cocultured with BMSC in the presence of an EGFR inhibitor (gefitinib, 200 nM), an Erk inhibitor (U0126, 100 nM), or a Gli inhibitor (GNAT61, 5 μM). (C) Quantification of colony-forming assay. (D) Addition of recombinant EGF (10 ng/mL) in cultured CTR-KD and AL-KD RPMI8226 cells for 10 minutes, with the cell lysate used for western blotting. The results are quantified in the right panel. (E) Addition of ALCAM-Fc chimera (Al-Fc, 0.25 μg/mL) in cultured CTR-KD and AL-KD RPMI8226 cells for 1 hour, with the cell lysate used for western blotting. The results are quantified in the right panel. (F) RPMI8226 cells (CTR-KD and AL-KD) cocultured with BMSC-M for 48 hours or cultured in complete medium, and examined by western blotting. The results are quantified in the right panel. (G) RPMI8226-CTR cells cultured under normal conditions, or treated with recombinant EGF (10 ng/mL) for 10 minutes, or cocultured with BMSC-M for 48 hours, then examined the hedgehog pathway genes GLI1, PTCH1, and MYC by qPCR. (H) Performed similar experiment as in panel G with RPMI8226-ALCAM- KD cells. (I) RPMI8226 cells cultured with or without recombinant EGF (10 ng/mL) for 1 hour. The cells were examined by immunofluorescence staining followed by confocal florescence microscopy. The data were obtained from 10 randomly choose fields and shown as the mean ± SD. Red: Gli1; blue: DAPI for nucleus. The Gli1 distribution in cells are quantified in the right panel. (J) The same immunofluorescence staining of Gli1 in RPMI8226 cells (AL-KD) with or without addition of recombinant EGF (−, without EGF; +, EGF 10 pg/mL; ++, EGF 10 ng/mL). All data in bar graphs were assessed by 2-tailed Student t test. *P < .05, **P < .01; ***P < .001.
ALCAM suppressed EGFR-initiated hedgehog pathway activation. (A) Gene Set Enrichment Analysis showing hedgehog pathway gene enrichment in EGFRhigh MM cells. (B) Colony formation assay of CTR-KD or AL-KD RPMI8226, cocultured with BMSC in the presence of an EGFR inhibitor (gefitinib, 200 nM), an Erk inhibitor (U0126, 100 nM), or a Gli inhibitor (GNAT61, 5 μM). (C) Quantification of colony-forming assay. (D) Addition of recombinant EGF (10 ng/mL) in cultured CTR-KD and AL-KD RPMI8226 cells for 10 minutes, with the cell lysate used for western blotting. The results are quantified in the right panel. (E) Addition of ALCAM-Fc chimera (Al-Fc, 0.25 μg/mL) in cultured CTR-KD and AL-KD RPMI8226 cells for 1 hour, with the cell lysate used for western blotting. The results are quantified in the right panel. (F) RPMI8226 cells (CTR-KD and AL-KD) cocultured with BMSC-M for 48 hours or cultured in complete medium, and examined by western blotting. The results are quantified in the right panel. (G) RPMI8226-CTR cells cultured under normal conditions, or treated with recombinant EGF (10 ng/mL) for 10 minutes, or cocultured with BMSC-M for 48 hours, then examined the hedgehog pathway genes GLI1, PTCH1, and MYC by qPCR. (H) Performed similar experiment as in panel G with RPMI8226-ALCAM- KD cells. (I) RPMI8226 cells cultured with or without recombinant EGF (10 ng/mL) for 1 hour. The cells were examined by immunofluorescence staining followed by confocal florescence microscopy. The data were obtained from 10 randomly choose fields and shown as the mean ± SD. Red: Gli1; blue: DAPI for nucleus. The Gli1 distribution in cells are quantified in the right panel. (J) The same immunofluorescence staining of Gli1 in RPMI8226 cells (AL-KD) with or without addition of recombinant EGF (−, without EGF; +, EGF 10 pg/mL; ++, EGF 10 ng/mL). All data in bar graphs were assessed by 2-tailed Student t test. *P < .05, **P < .01; ***P < .001.
To test our hypothesis, we performed a colony formation assay with the inhibitors of signaling molecules, such as EGFR inhibitor gefitinib, Erk inhibitor U0126, and hedgehog pathway Gli inhibitor GANT61. Our results showed that all inhibitors repressed BMSC-M-stimulated colony formation (Figure 5B-C). Western blotting results indicated that recombinant EGF activated Mek/Erk cell signaling and PI3K/Akt cell signaling in AL-KD MM cells (Figure 5D). Alternatively, addition of the ALCAM-Fc fusion protein inhibited the expression of pEGFR and pAkt (Figure 5E). Coculture of MM cells with BMSC-conditioning medium also activated Mek/Erk cell signaling and PI3K/Akt cell signaling in AL-KD MM cells (Figure 5F). Similar results were obtained when AL-KD MM cells were cocultured with patients BMSC conditioning medium (supplemental Figure 5). Previous studies showed that the hedgehog pathway activation resulted in overexpression of the pathway-related genes, such as GLI1 and PTCH1. Therefore, GLI1 and PTCH1 expressions, as well as hedgehog pathway downstream gene MYC expression, could be used to monitor the pathway activation.29,30 As shown in Figure 5G-H, recombinant EGF or BMSC-M promoted the hedgehog pathway activation in both CTR-KD and AL-KD RPMI8226 cells. Immunofluorescence staining showed that recombinant EGF resulted in Gli1 translocation to the nucleus (Figure 5I; supplemental Figure 6A), which is a hallmark of hedgehog pathway activation.31-33 The same was true in MM.1S cells (supplemental Figure 6B). More important, our result showed that recombinant EGF promoted Gli1 nuclear translocation with a dose-dependent manner (Figure 5J). Overall, our results suggest that ALCAM inhibits EGF/EGFR-initiated hedgehog pathway activation and MM clonogenicity.
ALCAM regulates myeloma clonogenicity in vivo
Next, we examined whether ALCAM regulates MM clonogenicity in vivo in MM mouse models. In a human MM xenograft mouse model, CTR-KD or AL-KD MM cells were mixed with or without BMSCs and subcutaneously injected into immune-deficient mice. The group of mice inoculated with AL-KD MM cells mixed with BMSCs had the fastest tumor growth (Figure 6A). CTR-KD and AL-KD MM cells alone had similar tumor growth in vivo, suggesting that ALCAM did not regulate tumor growth in the absence of tumor microenvironment. Next, we used a murine adoptive plasma cancer model developed by Hu et al.34 In this model, mouse plasma cells were transformed into malignant cells by viral overexpression of the oncogenes MYC and RAS. In our study, 2 viral constructs were used (Figure 6B): one was the AK virus overexpressing oncogenes MYC and RAS and containing an ALCAM shRNA and the other was the CK virus overexpressing MYC and RAS and containing a nontarget shRNA. The expression of target genes in viral infected cells was examined by western blotting (Figure 6C). The model was established as described in Figure 6D. Immunohistochemistry staining showed that the mouse BM had increased numbers of plasma cells (CD138+) (Figure 6E). Flow cytometry analysis showed CD138+/GFP+ cells in BM of the CK and AK groups, but not in the noninjected group. This result suggested that clonal plasma cells originated from the virus-infected cells (Figure 6F). The survival of the 2 groups showed that AL-KD plasma cells had accelerated myeloma development and disease progression (Figure 6G). Overall, our data suggest that high ALCAM expression represses myelomagenesis in vivo.

ALCAM suppressed myeloma clonogenicity in vivo in mouse models. (A) Human MM xenograft mouse model was established. Tumor growth after inoculation was examined. (B) Scheme graph showing the CK and AK constructs. (C) western blotting of virus-infected NIH3T3 cell lysates. The results are quantified in the right panel. The data were obtained from 3 independent experiments and shown as the mean ± SD. (D) Scheme graph showing the procedure of adoptive plasma cell cancer model generation. (E) Immunohistochemistry of CD138 in mice BM from non-cancer-bearing mice (NC), CK mice, and AK mice (2 of 5). (F) Flow cytometry analysis of mouse BM cells. The number indicates GFP+/CD138+ cell ratio (left, 2 of 5), and result quantification (right). (G) Mouse survival after adoptive transplantation. All data in bar graphs were assessed by 2-tailed Student t test. *P < .05; **P < .01.
ALCAM suppressed myeloma clonogenicity in vivo in mouse models. (A) Human MM xenograft mouse model was established. Tumor growth after inoculation was examined. (B) Scheme graph showing the CK and AK constructs. (C) western blotting of virus-infected NIH3T3 cell lysates. The results are quantified in the right panel. The data were obtained from 3 independent experiments and shown as the mean ± SD. (D) Scheme graph showing the procedure of adoptive plasma cell cancer model generation. (E) Immunohistochemistry of CD138 in mice BM from non-cancer-bearing mice (NC), CK mice, and AK mice (2 of 5). (F) Flow cytometry analysis of mouse BM cells. The number indicates GFP+/CD138+ cell ratio (left, 2 of 5), and result quantification (right). (G) Mouse survival after adoptive transplantation. All data in bar graphs were assessed by 2-tailed Student t test. *P < .05; **P < .01.
Clinical significance of ALCAM-EGFR axis in human myeloma
Our results showed that the ALCAM-EGFR interaction regulates myelomagenesis. Genome-wide sequencing indicated that ALCAM and EGFR mutations, mainly missense mutations, are rarely seen in MM patients (supplemental Figure 7A).35 Comparatively, cancer cell lines have more ALCAM and EGFR mutations, such as gene amplification and deep deletion.36 We examined a published microarray dataset of MM again.18 As shown in Figure 1B, ALCAM expression in this dataset correlated with MM survival. Furthermore, ALCAM/EGFR ratio, but not EGFR expression, correlated with MM survival (Figure 7A). MM cells expressed relatively low levels of EGFR (supplemental Figure 7B). Thus, our results indicate ALCAM as a key regulator of the ALCAM-EGFR axis. Thus, we propose a model of ALCAM-EGFR function in myelomagenesis (Figure 7B).
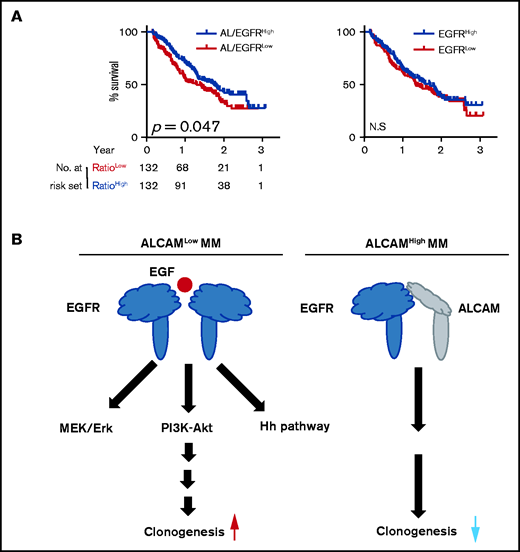
Model of ALCAM regulation on myeloma clonogenicity. (A) Kaplan-Meier curves showing OS rates associated with ALCAM/EGFR ratio, and EGFR expression in MM, then tested by log-rank test. (B) Graphic model of ALCAM function in MM.
Model of ALCAM regulation on myeloma clonogenicity. (A) Kaplan-Meier curves showing OS rates associated with ALCAM/EGFR ratio, and EGFR expression in MM, then tested by log-rank test. (B) Graphic model of ALCAM function in MM.
Discussion
ALCAM is widely expressed in different human cancers. In colorectal carcinoma, the expression of ALCAM was negatively correlated with the patients’ survival.9 On the contrary, loss of ALCAM was associated with a more aggressive phenotype of breast cancer among African American women.5 Our results demonstrated that higher ALCAM expression had longer OS than those with lower expression. Such discrepancy might be because ALCAM had multiple biological roles in different human cancers. We found that MM BM had increased ALCAM expression compared with healthy BM cells. Besides, there is a decreasing trend of ALCAM expression during MM progression. It was notable that Kristiansen et al found the similar ALCAM expression pattern in prostate cancer.10 ALCAM is low-expressed in normal prostatic glands, but upregulated in low-grade prostate cancer and progressively lost in high-grade lesions. Another example was CXCR4 in MM. MM cells overexpressed CXCR4; CXCR4High MM had increased drug sensitivity and treatment outcome.37 In this study, we investigated the function of ALCAM and EGFR in myelomagenesis. In general, MM microenvironment played a critical role in MM pathogenesis. Here, we identified a novel microenvironment-conferred pathway that regulated myelomagenesis. Microenvironment-derived EGF activated its receptor EGFR on MM cells and caused intracellular signaling transduction to hedgehog pathway, which promoted myeloma clonogenicity. ALCAM competed with EGF in binding with EGFR and thus suppressed EGF-EGFR initiated clonogenicity-promotion cell signaling. The action of EGFR–hedgehog signaling transduction required EGF. Structure simulation suggested that ALCAM and EGF might compete with each other in binding to the same region of EGFR. It was notable that Wu et al also found the similar binding competition in a different cell setting.38 We further suggested that ALCAM only interacted with the inactive form of EGFR, but not phosphorylated EGFR. Overall, mutual exclusive binding of ALCAM and EGF to EGFR supported our model of ALCAM function in MM clonogenicity regulation. Importantly, in this regulatory crosstalk, ALCAM might be a “superior” regulator because ALCAM expression, not EGFR, correlates with MM patient survival. According to flow cytometry analysis, MM cell lines and primary MM cells have very low EGFR expression (data not shown). ALCAM expression exhibited more heterogeneity than EGFR expression among MM patients.
Recently, Xu et al provided evidence to show that ALCAM regulated BM homing of MM cells and MM-associated bone disease.23 Xu examined ALCAM expression in primary MM cells. Based on an animal study using MM cell lines, Xu showed that ALCAM-KD MM cells inoculated in immune-deficient mice had longer OS and smaller tumor burden than CTR-KD. However, Xu did not provide clinical data addressing the correlation of ALCAM expression and MM OS. According to our microarray-based analysis using different datasets of patients with MM, the patients with high ALCAM expression in MM cells had better OS than the patients with low ALCAM expression. In addition, Paiva et al found that ALCAM expression was downregulated in patients with MM MRD cells.17 In our study, microarray-based analysis showed that recurrent MM had lower ALCAM expression than primary MM. Such finding indicated a pattern of ALCAM expression alteration during MM pathogenesis. In addition, among different molecular clusters of MM, PR MM had the lowest ALCAM expression. According to Zhan’s work, PR MMs were proliferation active and had gene expression signature similar to MM cell lines, the very end stage of MM development.14,39 Although the alteration of ALCAM expression pattern during MM progression and treatment was still missing, we hypothesized that relapsed and refractory MM might have lower ALCAM expression than primary tumors. We also hypothesized that ALCAM expression was repressed during MM pathogenesis. Therefore, Paiva’s finding is particularly interesting to us in that the finding would be the clinical evidence that supported our hypotheses: because MRD MM cells had low ALCAM expression, MRD-derived recurrent MM might have decreased ALCAM expression, compared with primary MM cells. Overall, our findings are more consistent with Paiva’s results,17 but not Xu’s.23 However, we agree with Xu et al that ALCAM plays a “pivotal” role in MM. More evidence from clinics might solve the discrepancy.
There were several limitations in our study. First, we were unable to investigate physiological and pathological myelomagenesis. MM is a highly heterogeneous disease with complicated, diverse, and dynamic genetic and cytogenetic alterations.40 In the adoptive MM model used, tumors originated from transformed plasma cells with overexpression of oncogenes MYC and RAS. Although this was one of the applicable plasma tumor animal models to date, such a simplified model had obvious limitations in a myelomagenesis study. Second, we were unable to determine the physiological role of ALCAM-EGFR interaction in myelomagenesis. Our evidence strongly indicated that ALCAM interacted with EGFR in MM cells. However, we were unable to quantify such interaction in different patients’ samples, and associated the interaction status with clinical factors. Third, as discussed previously, the clinical evidences of ALCAM alteration during MM pathogenesis, as well as its mechanism of regulation, was still missing. Further investigation on these limitations might provide us more insight of myelomagenesis.
Acknowledgments
The authors thank the tissue bank of the Department of Hematology and the Department of Pathology, West China Hospital, Sichuan University, for providing samples and the Laboratory of Clinical Proteomics and Metabolomics, West China Hospital, Sichuan University, for providing mass spectrometric detection service.
This work was supported by grants to Y.Z. from the National Science Foundation of China (no. 81670188 and no. 81870157), Science and Technology Department of Sichuan Province (no. 2019YJ0028), and the Sichuan University Faculty Start Fund; a grant to Q.Y. from Science and Technology Project of Sichuan Province (2018FZ0030); and a grant to Z.L. from Science and Technology Project of Sichuan Province (2019YFS0104).
Authorship
Contribution: H.L., Dan Zhang, and F.W. performed the majority of the experiments; Y.Z. and Q.Y. initiated the work, designed the majority of the experiments, and wrote the manuscript; Q.W., M.G., Y.H., T.L., J.H., T.J., Y.D., P.Z., Danfeng Zhang, Y.Q., L.Y., and T.G. performed the experiments; and W.Z., J.Z., Y.G., L.P., W.L., L.Z., Z.L., and Y.W. provided samples and critical suggestions for this study.
Conflict-of-interest disclosure: The authors declare no competing financial interests.
Correspondence: Yuhuan Zheng, Department of Hematology, West China Hospital, #37 GuoXue Xiang St, Chengdu 610041, China; e-mail: zhengyuhuan@scu.edu.cn; and Qing Yi, Center for Translational Research in Hematological Malignancies, Houston Methodist Cancer Center /Houston Methodist Research Institute, Houston methodist, 6550 Fannin, Smith 8, Houston, TX 77030; e-mail: qyi@houstonmethodist.org.

