

Key Points
POD<24 months was associated with inferior survival among patients with MCL after both intensive and less intensive frontline treatment.
Patients with POD<6 months or progressive disease after frontline treatment had the highest risk of early mortality.

Abstract
Although an expanding array of effective treatments has resulted in recent improvement in survival of patients with mantle cell lymphoma (MCL), outcomes remain heterogeneous, and identification of prognostic factors remains a priority. We assessed the prognostic impact of time to progression of disease (POD) after first-line therapy among 455 patients with relapsed MCL. Patients were categorized by duration of first remission as PRF/POD6, defined as progressive disease during induction or POD within 6 months of diagnosis (n = 65; 14%); POD6-24, defined as POD between 6 and 24 months after diagnosis (n = 153; 34%); and POD>24, defined as POD >24 months after diagnosis (n = 237; 53%). The median overall survival from POD (OS2) was 1.3 years (95% confidence interval [CI], 0.9-2.4) for patients with PRF/POD6, 3 years (95% CI, 2-6.8) for those with POD6-24, and 8 years (95% CI, 6.2-NR) for those with POD>24. Median OS2 was inferior in patients with early POD (defined as PRF/POD6 or POD6-24) after both intensive and less intensive frontline treatment. The prognostic performance of time until POD was replicated in an independent cohort of 245 patients with relapsed MCL, with median OS2 of 0.3 years (95% CI, 0.1-0.5) for PRF/POD6, 0.8 years (95% CI, 0.6-0.9) for POD6-24, and 2.4 years (95% CI 2.1-2.7) for POD>24. Early POD is associated with inferior OS2 in patients with relapsed MCL, identifying a high-risk population for future prospective studies.
Introduction
Mantle cell lymphoma (MCL) is an uncommon subtype of non-Hodgkin lymphoma (NHL), representing <10% of all cases, with an increasing incidence in recent decades.1 Outcomes of patients with MCL have improved over the past 2 decades, coinciding with the development of monoclonal antibodies targeting CD20, intensification of initial therapies, and the more recent targeted oral therapies.1-3 Although median survival exceeds 10 years in younger patients with MCL who were treated in the rituximab era, MCL is a highly heterogeneous disease, and a subset of patients continue to experience poor outcomes, even with modern therapies, with roughly 15% to 20% of patients progressing within 2 years of frontline treatment.3-9 The MCL international prognostic index (MIPI) risk score, based on clinical features at the time of diagnosis, is a well-validated tool for prognostic risk stratification of patients with MCL.10-12 Additional biologic MCL risk factors include increased proliferation rate (high Ki-67), blastoid morphology, loss-of-function mutations within TP53, and genomic instability, as reflected by a complex karyotype (CK), each of which are associated with an adverse prognosis with frontline chemoimmunotherapy (CIT).13-16
Among both indolent and aggressive NHL subtypes, time to progression of disease (POD) after frontline treatment is a robust prognostic factor among patients with relapsed disease. In indolent NHL, including the follicular lymphoma and indolent nonfollicular lymphoma subtypes, POD within 24 months of frontline CIT (early POD) predicts inferior overall survival (OS), suggesting that a subgroup of patients with these diseases are predisposed to treatment resistance.17-20 Similarly, among patients with relapsed diffuse large B-cell lymphoma, a short time to relapse predicts inferior survival.21-23 In MCL, relapse within 12 months of autologous stem cell transplant (ASCT) has been associated with inferior survival in a report including patients who receive ASCT, either as frontline consolidation or after salvage therapy.24 More recently, POD within 24 months of intensive cytarabine-containing frontline therapy was associated with increased mortality in comparison with later POD in a retrospective cohort of patients with and a smaller prospective validation cohort.25
The prognostic significance of early POD after less intensive frontline therapies for MCL has not been evaluated, and given that the median age at MCL diagnosis is 68 years, less intensive frontline treatment is commonly used in clinical practice. We evaluated the prognostic significance of time to POD in a large multiinstitutional MCL cohort including patients treated with either intensive or less intensive frontline therapy and describe outcomes after classification of second-line therapies among patients with primary refractory disease.
Methods
Patient selection
For our training cohort, patients aged ≥18 years with a diagnosis of MCL treated from 2000 through 2017 were identified from 12 participating US medical centers. Clinical, pathologic, treatment, and outcome data were collected retrospectively. Institutional review board approval was obtained at each participating center before data collection. Patients with documented POD at any time after frontline therapy were included in the primary analysis. The study was conducted in accordance with the Declaration of Helsinki.
MIPI risk score at diagnosis was calculated for patients with available baseline lactate dehydrogenase level, Eastern Cooperative Oncology Group (ECOG) performance status, and white blood cell count, as previously described.10 The proliferation index, measured by immunostaining for Ki67 performed according to institutional standards, was recorded, and patients were dichotomized according to the previously validated Ki67 cutoff of 30%.14,26,27 Cytogenetic analysis by conventional metaphase karyotyping, when available, was reviewed retrospectively, and patients with ≥3 unrelated cytogenetic abnormalities, excluding t(11;14), were defined as having CK.
Disease progression and treatment response were assessed by investigators using available imaging studies according to response criteria relevant to the era of treatment. Patients with documented relapse of disease after frontline treatment were included in this analysis and were categorized into 3 groups: (1) refractory disease defined as progressive disease as best response to frontline therapy or POD within 6 months of date of diagnosis (PRF/POD6), (2) POD between 6 and 24 months of date of diagnosis, (POD6-24), and (3) POD >24 months from date of diagnosis, (POD>24). A 6-month POD cutoff was chosen to define the PRF/POD6 cohort, as that cutoff has been used to define refractory patients with transient response to antilymphoma therapy28 and, in other NHL subtypes, has been associated with the highest risk of early mortality.29 We defined relapse groups in the training cohort from date of diagnosis to date of relapse, to account for a subset of patients with missing data for date of initiation of frontline therapy. Intensive treatment was defined as receipt of high-dose cytarabine-containing induction therapy and/or ASCT consolidation in first remission; all other frontline treatments were considered less intensive. Second-line therapy was categorized as CIT, Bruton’s tyrosine kinase inhibitor (BTKi) therapy for patients treated with BTKi as a single agent or in combination, and lenalidomide and/or bortezomib treatment of patients treated with 1 or both agents, including in combination with monoclonal antibodies. Patients undergoing allogeneic hematopoietic cell transplant (HCT) after relapse were identified for purposes of descriptive analysis.
Validation cohort
Adult patients with MCL treated at BC Cancer with frontline bendamustine and rituximab (BR); rituximab, cyclophosphamide, doxorubicin, vincristine, and prednisone (R-CHOP); or rituximab, cyclophosphamide, vincristine, and prednisone (R-CVP) were identified using the BC Cancer Centre for Lymphoid Cancer clinical and pathology databases, which have been described.9,30 Frontline therapy was administered according to institutional practice, with patients treated with R-CHOP or R-CVP from January 2003 through May 2013 and patients treated with BR from March 2012 through December 2018. ASCT consolidation was performed in fit patients aged <70 years and responding to frontline CIT. Patients with documented POD were included in the analysis. As complete data regarding date of initiation of frontline therapy was available for all patients and a subset of patients were managed initially with observation, relapse groups were defined from the start of CIT rather than from date of diagnosis. Patients were categorized by time to POD as PRF/POD6, POD6-24, or POD>24.
Statistical considerations
OS from the time of first POD (OS2) was estimated using the Kaplan-Meier method, censoring patients who were alive at the time of last follow-up. Secondary progression-free survival (PFS2) likewise was estimated beginning at first POD by using the Kaplan-Meier method, censoring patients who were alive and without evidence of progression at last follow-up. OS2 and PFS2 were compared between time to POD categories using the log-rank test. Univariable and multivariable analyses were performed by using Cox proportional hazard models fit for OS2. Ninety-five percent confidence intervals (CIs) were calculated for all estimates. Comparison of baseline characteristics of the POD groups in the training cohort were compared by using Pearson’s χ2 test for categorical variables and analysis of variance for numerical covariates. Comparisons of clinical characteristics between the primary and validation cohort were performed by using Pearson’s χ2 test. Statistical significance was assessed at the P < .05 level, and statistical analysis was performed using SAS 9.4 (SAS Institute Inc, Cary, NC) for the training cohort and with SPSS 13.0 (SPSS Inc, Chicago, IL) for the validation cohort.
Results
Training cohort
In total, 1168 patients with a diagnosis of MCL were identified: the median PFS was 4.6 years, with a median follow-up of 3.5 years (range, 0.3-20.6) from diagnosis. A total of 455 patients (39%) had documented relapse of disease after frontline treatment and were therefore included in the subsequent analysis.
Baseline characteristics for the 455 patients with relapsed disease are displayed in Table 1. The median follow-up was 2.6 years (range, 0-15.3) from first progression. Frontline treatment was classified as intensive in 54% of patients. The median time from date of diagnosis to start of treatment was 31 days (range, 0-1878). Seventy-one patients (17%) had a diagnosis to treatment interval greater than 90 days (Table 1). The most common frontline treatments were rituximab, hyperfractionated cyclophosphamide, vincristine, doxorubicin, and dexamethasone, alternating with high-dose cytarabine and methotrexate (R-Hyper CVAD) in 117 patients (26%); R-CHOP in 112 patients (25%); BR in 89 patients (19%); and rituximab with methotrexate, cyclophosphamide, vincristine, doxorubicin, and prednisone followed by high-dose cytarabine chemomobilization in 45 patients (10%; supplemental Table 1). A total of 49 patients (11%) were enrolled in a clinical trial for frontline treatment. One hundred eighty patients (40%) underwent ASCT consolidation in first remission, and 110 patients (24%) received maintenance rituximab, including 34 patients who received maintenance rituximab after ASCT. Second-line treatments were recorded for 377 patients and included CIT in 145 patients, BTKi in 108 patients, and lenalidomide and/or bortezomib–containing treatment in 73 patients (supplemental Table 2). In total, 17 patients (4%) underwent ASCT at any time after first progression of disease. One hundred thirty patients (29%) were enrolled in a therapeutic clinical trial for ≥1 line of therapy.
Comparison of baseline patient characteristics among POD groups
| Variable | Total* n = 455 n (%) | PRF/POD6 n = 65 n (%) | POD6-24 n = 153 n (%) | POD>24 n = 237 n (%) | P |
|---|---|---|---|---|---|
| Age at diagnosis | |||||
| Median (range) | 62 (32-93) | 66 (32-86) | 63 (38-87) | 60 (32-93) | .002 |
| Mean | 61 | 63 | 63 | 59 | |
| Sex | |||||
| Female | 104 (23) | 12 (18) | 35 (23) | 57 (24) | .636 |
| Male | 351 (77) | 53 (82) | 118 (77) | 180 (76) | |
| ECOG PS | |||||
| 0-1 | 346 (94) | 52 (93) | 112 (90) | 182 (96) | .154 |
| ≥2 | 24 (6) | 4 (7) | 12 (10) | 8 (4) | |
| Ann Arbor stage | |||||
| 1-3 | 62 (14) | 7 (11) | 12 (8) | 43 (19) | .011 |
| 4 | 378 (86) | 57 (89) | 135 (92) | 186 (81) | |
| Splenomegaly | |||||
| Yes | 210 (57) | 32 (55) | 86 (67) | 92 (51) | .016 |
| No | 157 (43) | 26 (45) | 42 (33) | 89 (49) | |
| LN >5 cm | |||||
| Yes | 72 (23) | 12 (24) | 29 (27) | 31 (19) | .386 |
| No | 247 (77) | 39 (76) | 80 (73) | 128 (81) | |
| B symptoms | |||||
| Yes | 126 (31) | 15 (25) | 61 (45) | 50 (24) | <.001 |
| No | 276 (69) | 45 (75) | 75 (55) | 156 (76) | |
| MIPI risk score | |||||
| Low risk | 74 (35) | 10 (27) | 17 (22) | 47 (47) | .002 |
| Intermediate risk | 72 (34) | 10 (27) | 29 (38) | 33 (33) | |
| High risk | 67 (31) | 17 (46) | 30 (39) | 20 (20) | |
| Ki67 | |||||
| ≤30% | 93 (50) | 13 (36) | 32 (40) | 48 (68) | <.001 |
| >30% | 94 (50) | 23 (64) | 48 (60) | 23 (32) | |
| Complex karyotype | |||||
| Yes | 30 (20) | 3 (14) | 20 (35) | 7 (10) | .001 |
| No | 121 (80) | 18 (86) | 37 (65) | 66 (90) | |
| Histology | |||||
| Blastoid | 61 (20) | 15 (33) | 28 (26) | 18 (12) | .001 |
| Nonblastoid | 245 (80) | 31 (67) | 79 (74) | 135 (88) | |
| Diagnosis to treatment interval, d | |||||
| 0-90 | 345 (83) | 54 (92) | 128 (90) | 163 (76) | <.001 |
| >90 | 71 (17) | 5 (8) | 14 (10) | 52 (24) | |
| Not recorded | 39 | 6 | 11 | 22 |
LN, lymph node.
Total number <455 in some categories because of missing data.
Sixty-five patients (14%) were categorized as PRF/POD6, 153 patients (36%) as POD6-24, and 237 patients (52%) as POD>24. In comparing patients with relapsed disease according to time of POD, patients with PRF/POD6 or POD6-24 compared with those with POD>24 were older on average (median age, 66 for PRF/POD6, 63 for POD6-24, and 60 for POD>24; P = .002), and a greater proportion had established MCL risk factors, including high-risk MIPI (46% PRF/POD6, 39% POD6-24, and 20% POD>24; P = .002), a Ki67 index >30% (64% PRF/POD6, 60% POD6-24, and 32% POD>24; P < .001), and CK (14% PRF/POD6, 35% POD6-24, and 10% POD>24; P = .001). In addition, a greater proportion of patients in the POD>24 relapse category had an initial diagnosis-to-treatment interval >90 days (8% PRF/POD6, 10% POD6-24, and 24% POD>24; P < .001). A comparison of baseline characteristics between POD groups is displayed in Table 1.
We first sought to determine the association of time to POD with PFS2 and OS2. The median OS from first progression (OS2) among relapsed patients was 1.3 years (95% CI, 0.9-2.4) for patients with PRF/POD6, 3 years (95% CI 2-6.8) for patients with POD6-24, and 8 years (95% CI, 6.2-not reached [NR]) for patients with POD>24 (Figure 1A). The median PFS2 was 1 year (95% CI, 0.4-1.3) for patients with PRF/POD6, 1 year (95% CI, 0.8-1.4) for patients with POD6-24, and 2.3 years (95% CI, 1.8-3.2) for patients with POD>24 (Figure 1B).
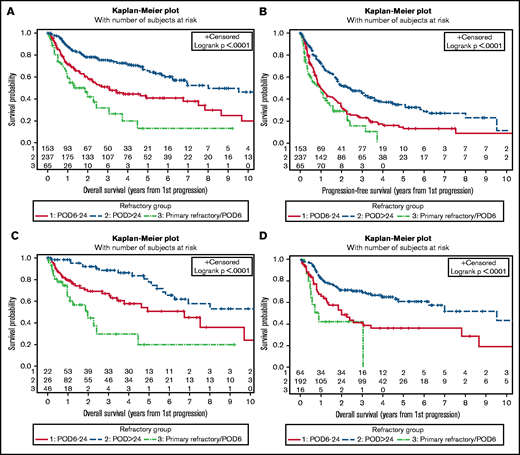
Survival and training cohorts. Kaplan-Meier plots of OS from first relapse (A), PFS from first relapse (B), OS from first relapse among patients treated with less intensive frontline treatment (C), and OS from first relapse among patients treated with intensive frontline treatment (D), categorized by duration of first remission.
Survival and training cohorts. Kaplan-Meier plots of OS from first relapse (A), PFS from first relapse (B), OS from first relapse among patients treated with less intensive frontline treatment (C), and OS from first relapse among patients treated with intensive frontline treatment (D), categorized by duration of first remission.
As prior reports regarding the prognostic significance of early relapse in MCL have focused on patients who were treated with intensive frontline approaches, we analyzed outcomes among relapsed patients categorized by frontline treatment intensity. Among patients receiving less intensive frontline treatment (ie, R-CHOP or BR without ASCT consolidation), median OS2 after relapse was 2 years (95% CI, 0.9-4.5) for patients with PRF/POD6, 6.8 years (95% CI, 3.1-9.7) for patients with POD6-24, and 10.5 years (95% CI, 5.8-NR) for patients with POD>24 (Figure 1C). Among patients treated with intensive frontline therapy, median OS2 was 0.9 years (95% CI, 0.4-3) in the PRF/POD6 group, 2 years (95% CI, 1.1-3.4) in the POD6-24 group, and 9.5 years (95% CI, 4.8-NR) in the POD>24 group (Figure 1D).
To assess the impact of time to POD on survival and the association with known prognostic risk factors in MCL, univariable analysis was performed to assess the association of time to relapse and baseline patient and tumor characteristics with OS2 (Table 2). Baseline characteristics associated with inferior survival from time of relapse included blastoid histology (hazard ratio [HR], 1.9; 95% CI, 1.3-2.9), stage IV disease (HR, 2.0; 95% CI, 1.2-3.3), CK (HR, 2.2; 95% CI, 1.1-4.4), presence of B symptoms (HR, 1.4; 95% CI, 1.0-2.0), and high-risk MIPI score (HR, 2.5; 95% CI, 1.4-4.3). Early POD was associated with inferior survival from first relapse, with HR, 3.8 (95% CI, 2.5-5.8) for PRF/POD6 and HR, 2.1 (95% CI, 1.5-2.9) for POD6-24 in comparison with POD>24. Receipt of rituximab maintenance was associated with improved OS2 (HR, 0.6; 95% CI, 0.4-0.9).
Association between risk factors and overall survival from first progression
| Variable | n | HR (95% CI) by univariable analysis | P (HR) | HR (95% CI) by multivariable analysis | P (HR) |
|---|---|---|---|---|---|
| Age | 452 | 1.02 (1.01-1.04) | .003 | — | — |
| Stage | — | — | |||
| 1-3 | 62 | — | — | ||
| 4 | 378 | 1.95 (1.17-3.27) | .010 | ||
| Splenomegaly | — | — | |||
| Yes | 210 | 1.50 (1.07-2.11) | .018 | ||
| No | 157 | — | — | ||
| LN >5 cm | — | — | |||
| Yes | 72 | 0.98 (0.64-1.50) | .928 | ||
| No | 247 | — | — | ||
| BM involvement | — | — | |||
| Yes | 315 | 1.91 (1.15-3.17) | .012 | ||
| No | 59 | — | — | ||
| Ki67% | — | — | |||
| >30 | 94 | 1.24 (0.76-2.03) | .384 | ||
| ≤30 | 93 | — | — | ||
| CK | — | — | |||
| Yes | 30 | 2.21 (1.12-4.36) | .022 | ||
| No | 121 | — | — | ||
| Blastoid histology | — | — | |||
| Yes | 61 | 1.93 (1.28-2.90) | .002 | ||
| No | 245 | — | — | ||
| Intensive treatment | — | — | |||
| Yes | 232 | 1.25 (0.92-1.72) | .157 | ||
| No | 198 | — | — | ||
| B symptoms | |||||
| Yes | 126 | 1.41 (1.02-1.96) | .037 | 1.27 (0.75-2.15) | 0.376 |
| No | 276 | — | — | — | — |
| MIPI risk score | |||||
| High risk | 67 | 2.45 (1.38-4.32) | .002 | 2.14 (1.19-3.85) | 0.011 |
| Intermediate risk | 72 | 1.24 (0.67-2.30) | .485 | 1.24 (0.66-2.33) | 0.499 |
| Low risk | 74 | — | — | — | — |
| Time to POD | |||||
| PRF/POD6 | 65 | 3.76 (2.46-5.75) | <.001 | 2.71 (1.42-5.17) | 0.002 |
| POD6-24 | 153 | 2.12 (1.53-2.93) | <.001 | 1.33 (0.75-2.35) | 0.324 |
| POD>24 | 237 | — | — | — | — |
BM, bone marrow; LN, lymph node.
We next performed multivariable analysis to determine whether the association between time to relapse and OS2 was independent of MIPI risk score at diagnosis and the presence of B symptoms. The presence of B symptoms was included in the multivariable model, given that this was determined to be a significant prognostic factor in the univariable analysis and was available for most of the patients. MIPI risk score was included, as this is a robust and well-established prognostic marker for MCL, including in relapsed disease.5,31 Other baseline prognostic factors that were associated with adverse risk on univariable analysis, such as CK, were not included in the multivariable model because of the amount of missing data, and thus the small sample size for this calculation. On multivariable analysis, both high-risk MIPI score (HR, 2.1; 95% CI, 1.2-3.9; P = .011) and PRF/POD6 (HR, 2.7; 95% CI, 1.4-5.2; P = .002) remained independently associated with inferior OS2. In the multivariable model, POD6-24 was not independently associated with inferior OS2 (HR, 1.3; 95% CI, 0.8-2.4; P = .324); however, baseline MIPI risk score was available for less than half of all patients, possibly limiting power for this calculation (Table 2).
Validation cohort
Having established an association between shorter time to POD and increased mortality risk in our training cohort, including patients treated with less intensive therapy, we sought to validate these findings in a separate independent cohort. For the validation cohort, adult patients with relapsed/refractory MCL treated at BC Cancer after frontline BR, R-CHOP, or R-CVP were included. A total of 245 patients were identified with a median follow-up of 2.2 years, including 56 patients receiving first-line treatment with BR, 169 patients with R-CHOP, and 20 patients with R-CVP; 52 patients (21%) underwent ASCT consolidation after induction therapy, and 48% received R-maintenance. In comparison with the training cohort, a greater proportion of patients in the validation cohort were >65 years of age, had an ECOG performance status of >1 and largest nodal mass ≥5 cm in diameter, and did not undergo consolidative ASCT (supplemental Table 3). Of the 245 patients with relapsed disease, 42 (17%) were categorized as PRF/POD6, 104 (42%) as POD6-24, and 99 (40%) as POD>24 after the start of treatment. A comparison of baseline characteristics by time-to-relapse category is displayed in supplemental Table 3.
At a median follow-up of 2.2 years, the median OS2 in the validation cohort was 0.3 years (95% CI, 0.1-0.5) among patients with PRF/POD6, 0.8 years (95% CI, 0.6-0.9) among those with POD6-24, and 2.4 years (95% CI, 2.1-2.7) among those with POD>24 (Figure 2A). Among the patients treated with frontline BR, the median OS2 was 0.2 years (95% CI, 0.1-1.4) among those with PRF/POD6, 0.8 years (0.4-1) among those with POD6-24, and not reached among those with POD>24 (Figure 2B). Among the patients treated with frontline R-CHOP/R-CVP, median OS2 was 0.3 years (95% CI, 0-0.7) among those with PRF/POD6, 0.7 years (95% CI, 0.6-0.9) among those with POD6-24, and 2.4 years (95% CI, 2.1-2.7) among those with POD>24 (Figure 2C). Finally, among the patients receiving ASCT consolidation, the median OS2 was 0.4 years (0.1-0.7) among those with POD within 24 months of the start of therapy vs 2.6 years (95% CI, 1.8-3.4) among those with POD>24 (Figure 2D).

Survival of the validation cohort. Kaplan-Meier plots of OS from first progression, all patients (A); OS from first progression among patients treated with BR only (B); OS from first progression in patients treated with R-CHOP or R-CVP only (C); and OS from first progression among patients who underwent ASCT consolidation in first remission only (D); all categorized by duration of first remission. In panel D, n = 42 treated with R-CHOP/R-CVP; n = 10 treated with BR.
Survival of the validation cohort. Kaplan-Meier plots of OS from first progression, all patients (A); OS from first progression among patients treated with BR only (B); OS from first progression in patients treated with R-CHOP or R-CVP only (C); and OS from first progression among patients who underwent ASCT consolidation in first remission only (D); all categorized by duration of first remission. In panel D, n = 42 treated with R-CHOP/R-CVP; n = 10 treated with BR.
On univariable analysis, shorter duration of first remission was associated with inferior OS2 in the validation cohort, with an HR of 2.9 (95% CI, 2.6-5.8) among patients with PRF/POD6 and an HR of 2 (95% CI, 1.4-2.7) among patients with POD6-24 (supplemental Table 5). On multivariable analysis incorporating MIPI risk score and time-to-POD category (n = 168 patients with available baseline MIPI risk score), PRF/POD6 and POD6-24 remained independently associated with inferior OS2 (PRF HR, 3.4; 95% CI, 2-5.7; P < .001; POD6-24 HR, 1.5; 95% CI, 1-2.35; P = .05) in the validation cohort (Table 3).
Association between risk factors and OS from first progression in validation cohort, by multivariable analysis
| Variable | HR (95% CI) | P |
|---|---|---|
| MIPI risk score | ||
| High | 3.58 (2.24-5.71) | <.001 |
| Intermediate | 1.49 (0.94-2.36) | .090 |
| Low | — | — |
| Time to POD | ||
| PRF/POD6 | 3.39 (2.04-5.65) | <.001 |
| POD6-24 | 1.54 (1.01-2.35) | .046 |
| POD>24 | — | — |
| Variable | HR (95% CI) | P |
|---|---|---|
| MIPI risk score | ||
| High | 3.58 (2.24-5.71) | <.001 |
| Intermediate | 1.49 (0.94-2.36) | .090 |
| Low | — | — |
| Time to POD | ||
| PRF/POD6 | 3.39 (2.04-5.65) | <.001 |
| POD6-24 | 1.54 (1.01-2.35) | .046 |
| POD>24 | — | — |
n = 168 patients.
Outcomes by class of second-line therapy after early POD
Given that patients in the early (PRF/POD6) POD group had the greatest risk of early mortality, we sought to determine whether class of second-line treatment was associated with differences in survival outcomes in this highest risk group of our training cohort. Of 65 patients categorized as PRF/POD6, second-line treatment was recorded for 53 patients. Twenty-two patients received CIT; 21 received BTKi treatment, either as a single agent (14 patients) or in combination with CIT or other novel agents (7 patients); 8 received bortezomib and/or lenalidomide, with or without anti-CD20 monoclonal antibodies; and 2 received supportive care only. Median PFS2 was 0.3 years (95% CI, 0.1-0.6) for patients treated with lenalidomide and/or bortezomib, 0.5 years (95% CI, 0.2-2.3) for those treated with CIT, and 1.2 years (95% CI, 0.5-2.3) for those treated with BTKi (P = .04; Figure 3A). Among patients treated with BTKi, the PFS2 was not superior in those who had combination therapy (median PFS2, 1.4 years for single-agent BTKi and 0.7 years for patients treated with BTKi-based combination therapy). The median OS2 from first relapse was 1.9 years (95% CI, 0.1-2) in patients treated with lenalidomide and/or bortezomib, 1.1 years (95% CI, 0.5-NR) in patients treated with CIT, and 2.4 years (95% CI, 0.7-4.5) in patients treated with BTKi (P = .55; Figure 3B).

Comparative survival for patients with PRE/POD6 by second-line treatment. Figure PFS (A) and OS (B) from first progression of disease by salvage treatment category. BTKi, either as a single agent or in combination with other treatments; Lena, treatment with lenalidomide and/or bortezomib, either as a single agent or in combination with other treatments.
Comparative survival for patients with PRE/POD6 by second-line treatment. Figure PFS (A) and OS (B) from first progression of disease by salvage treatment category. BTKi, either as a single agent or in combination with other treatments; Lena, treatment with lenalidomide and/or bortezomib, either as a single agent or in combination with other treatments.
Outcomes after allogeneic HCT
A total of 54 patients underwent allogeneic HCT for relapsed or refractory disease, including 12 with PRF/POD6, 19 with POD6-24, and 23 with POD>24. The median time from first relapse to allogeneic HCT was 0.7 years, and the median follow-up after allogeneic HCT was 2.5 years. The median OS2 among patients who underwent allogeneic HCT was 7.5 years, including a median OS2 of 3.0 years among patients with first relapse before 24 months (PRF/POD6 and POD6-24) and 9.5 years among those with first relapse after 24 months. Among patients with PRF/POD6, median OS2 was 2.0 years in those who underwent allogeneic HCT and 1.1 years in those who did not undergo transplant.
Discussion
To our knowledge, this represents the largest report to date that describes the prognostic significance of time to first relapse in patients with MCL. Consistent with the prior literature,24,25 POD<24 months of intensive therapy was associated with increased risk for early mortality in both the training and validation cohorts, identifying a high-risk population that may be preferentially selected for investigation of novel therapies in the second-line setting. In addition, we observed a strong association between time to POD and OS2 among patients treated with less intensive frontline treatment. This association was replicated in the validation cohort, including in the subgroup of patients treated with BR, which is currently a widely used frontline regimen. Among patients with early relapse after less intensive frontline treatment, outcomes were particularly poor in patients classified as PRF/POD6. The inferior OS2 among those patients in comparison with patients with later relapse (POD6-24) is consistent with observations in patients with follicular lymphoma treated in the GALLIUM study and suggests that duration of first remission among patients with early relapse may be a continuous variable providing prognostic information beyond a binary 24-month duration of the first remission cutoff.29
We observed a consistent association between early POD and increased mortality in patients with MCL across all analyzed treatment subgroups in 2 large, independent cohorts. We likewise confirmed that the association between PRF/POD6 and inferior secondary survival had prognostic significance, independent of baseline MIPI risk score in both patient cohorts. This finding suggests that duration of first remission is a relevant prognostic factor that should be included among the baseline clinical characteristics describing clinical trial participants enrolled in second-line MCL treatment studies.
The estimated OS2 in our training cohort significantly exceeded the median follow-up among patients with relapse >24 months from diagnosis, thus limiting the reliability of these estimates. Patients in our training cohort were primarily treated at tertiary referral centers, and the relatively low proportion of patients with relapsed disease may be explained in part by loss to follow-up among a subset of patients ultimately treated at local community centers at first progression. In addition, patients who are treated at an academic center may be fitter and therefore able to travel for evaluation and treatment compared with other patients. Likewise, among the patients with relapsed disease included in our analysis, censoring of patients lost to follow-up who may have received treatment at other centers for relapsed disease may result in overestimation of secondary OS. Although the data from our validation cohort support the prognostic significance of duration of first remission in MCL, OS2 was notably shorter in the validation cohort, particularly among patients in the POD>24 group. This discrepancy may be due in part to differences in baseline characteristics between patient populations, including a younger median age and higher proportion of patients with performance status of 0 or 1 in the training cohort relative to the validation cohort. There was a greater use of intensive therapies in the training cohort, including cytarabine-containing regimens and ASCT, possibly reflecting referral of fitter patients to academic centers in the United States cohort compared with the broad, province-wide population base comprising the validation cohort. Second and subsequent lines of therapy were different between both populations, with a greater number of patients in the training cohort receiving novel agents and undergoing allogeneic HCT. Finally, as previously stated, censoring of patients lost to follow-up who received treatment at other centers may lead to overestimation of OS2 in the training cohort but was not likely to occur in the validation cohort, which serves as the sole provider of oncology care for the entire province of BC where up-to-date death data are generally reliable.
Although duration of first remission has the inherent limitation that it is known only at the time of progression and by definition cannot inform choice of frontline treatment, the prognostic significance of a short duration of first remission is useful, both in clinical practice for counseling of patients and in the design of prospective trials of second-line therapies. Ongoing study is needed to further define biologic MCL risk factors, including genetic and epigenetic alterations associated with early POD, to provide better prognostication at diagnosis and inform selection of frontline treatment. A growing body of evidence has established TP53 mutations as one important biologic risk factor in MCL predictive of poor response to CIT and early mortality,15,32-34 and the lack of data regarding TP53 mutational status is a limitation of the current study. In addition, the impact of TP53 mutations on response to salvage therapy and/or novel agents is not well described.
Among patients with primary refractory disease, we observed a longer duration of PFS2 (1.2 years) than the duration of first remission among patients treated with BTKi as the second-line therapy. Longer secondary PFS than duration of first remission was similarly observed in patients with MCL with early relapse treated with second-line ibrutinib in pooled long-term follow-up of prospective studies,35 and a recent multicenter cohort study reported greater PFS2 among younger patients with early relapse of MCL treated with BTKi in comparison with CIT, with an estimated median PFS2 of 10 months.36 However, the responses to BTKi second line were not durable, and no difference in OS2 was observed compared with other classes of second-line therapy.
Our study, which includes a large patient population treated in the modern era, has important limitations, some of which are inherent to the retrospective nature of the study in a rare disease with no standard approach to treatment. Limitations include the variability in first- and second-line therapies, incomplete data for prognostic variables of interest, including MIPI risk score and Ki67 proliferation index, and lack of molecular data, including specifically TP53 mutational status. Strengths of our study include the large patient cohort, over twice the size of the largest prior report25 analyzing the prognostic significance of time to relapse in MCL, inclusion of patients receiving less intensive frontline treatment, which make up a large share of patients treated in clinical practice, and validation of these findings in a large, independent, population-based cohort.
In summary, progression of MCL within 24 months of the start of treatment is associated with inferior OS2, and patients with primary refractory disease are at highest risk of early death. Further study is warranted to better characterize the biology of this high-risk patient population. These findings have implications for clinical practice and to inform the selection of high-risk patients for future prospective therapeutic studies of relapsed MCL.
Acknowledgments
This work was supported in part by the Biostatistics and Bioinformatics Shared Resource of Winship Cancer Institute of Emory University and the National Institutes of Health, National Cancer Institute (NIH/NCI; P30CA138292) and by the Center for Clinical and Translational Science Bioinformatics Shared Resource of The Ohio State University (UL1TR002733). The content is solely the responsibility of the authors and does not necessarily represent the official views of the National Institutes of Health.
Authorship
Contribution: D.A.B. and J.B.C. conceived and designed the study, collected and analyzed data, and wrote the manuscript; J.M.S. performed statistical analyses and wrote the manuscript; D.V. collected and analyzed the data, performed the statistical analyses, and wrote the manuscript; K.M., M.C., A.S.G, S.G., K.S., O.C., B.K., V.B., J.N.G., S.K.B., B.T.H., Y.S., P.M., E.M., M.G., A.V.D., N.S.G., S.M., M.B., R.K., N.G., S.I.P., N.E., T.B., J.G., M.H., T.S.F., M.M., B.S.K, C.R.F., and K.A.B. collected and analyzed the data and wrote and reviewed the manuscript.
Conflict-of-interest disclosure: D.V. has received research funding from Roche and AstraZeneca and has consulted for Roche, Celgene, AbbVie, Seagen, Kite/Gilead, Lundbeck, Nanostring, AstraZeneca, Purdue Pharma, Sandoz, and Janssen. K.M. has received research funding from Bristol-Myers Squibb, Novartis, and Pharmacyclics and has consulted for ADC Therapeutics, AstraZeneca, Beigene, Bristol-Myers Squibb, Celgene, Kite, Morphosys, and Seattle Genetics. A.S.G has received research funding from Roche Canada, Janssen, AbbVie, and AstraZeneca; has served on advisory boards for Janssen, AbbVie, AstraZeneca, and Sandoz; and has received honoraria from Janssen. V.B. has served on the advisory board for Gamida Cell Kite and has received research funding from Karyopharm, FATE, Bristol Myers Squibb, and Incyte. J.N.G. has received research support from Loxo and has consulted for Genetech, AbbVie, and TG Therapeutics. S.K.B. has served on advisory boards for Seagen, Daiichi Sanko, and Atara and has consulted for Acrotech and Seagen. A.V.D. has received research funding from Aptose Biosciences, AstraZeneca, Gilead Sciences, Takeda Oncology, Genentech, Bayer Oncology, Verastem Oncology, and Bristol-Myers Squibb and has consulted for AstraZeneca, Abbvie, Beigene, Bayer Oncology, Bristol-Meyers-Squibb, Genentech, Karyopharm, Pharmacyclics, TG Therapeutics, Nurix, and Rigel Pharmaceuticals. N.S.G. has received research funding from Genetech and has consulted for Kite and Tessa Therapeutics. R.K. has received research funding from Kite/Gilead Sciences, Juno/Bristol-Meyers-Squibb, and Takeda Oncology and has served on advisory boards for Kite/Gilead Sciences, Juno/Bristol-Meyers-Squibb, Janssen, and Karyopharm and on the speakers bureau for AstraZeneca, Kite/Gilead Sciences, and BeiGene. B.T.H. has received research funding from and has consulted for Genentech. P.M. has consulted for ADC Therapeutics, AstraZeneca, Bayer, Bristol Myers Squibb, Cellectar, Epizyme, Gilead, Incyte, Janssen, Karyopharm, Merck, Regeneron, Takeda, Teneobio, and Verastem; has received research funding from Celgene/Bristol Myers Squibb, Takeda, and Gilead/Kite; has consulted for Celgene/Bristol Myers Squibb, Karyopharm, and Gilead/Kite; and has served on the speaker’s bureau for Celgene/Bristol Myers Squibb, BeiGene, AstraZeneca, and Gilead/Kite. N.E. has served on the speaker’s bureau for Verastem and Beigene and has consulted for Karyopharm and Genzyme. M.H. has received research funding from Takeda, Spectrum Pharmaceuticals, and Astellas Pharma; has consulted for Janssen, Incyte, ADC Therapeutics, Celgene, Omeros, Verastem, and MorphoSys; and has served on the speaker’s bureau for Sanofi Genzyme, AstraZeneca, and BeiGene. T.S.F. has received research funding from Novartis, TG Therapeutics, Portola, and Curis; has consulted for Beigene, Genentech, Adaptive Biotechnologies, AbbVie, Verastem, Kite, MorphoSys, AstraZeneca, Pharmacyclics, and Sanofi; and has served on speaker boards for Genentech, Sanofi, Seattle Genetics, AstraZeneca, Celgene/Bristol-Myers Squibb, and Adaptive Biotechnologies. C.R.F. has received research funding from Kite, Gilead, Celgene, AbbVie, Acerta, Karyopharm, Takeda, Roche, and TG Therapeutics and has consulted for Janssen/Pharmacyclics, Spectrum, Gilead/Kite, Celgene, AbbVie, Karyopharm, Bayer, Denovo Biopharma, Takeda, BeiGene, and Genentech. J.B.C. has received research funding from Janssen, Adicet, AstraZeneca, Genentech, Cellectar, and Kite/Gilead and has consulted for Genentech, Bristol Myers Squibb, Novartis, LAM, BioInvent, AstraZeneca, Seagen, and Loxo. The remaining authors declare no competing financial interests.
Correspondence: David A. Bond, Division of Hematology, Department of Internal Medicine, The Ohio State University Wexner Medical Center, 1140A Lincoln Tower, 1800 Cannon Dr, Columbus, OH 43210; e-mail: david.bond@osumc.edu.

