

Key Points
High Helios but low ICOS expression in lymph node–derived regulatory T cells associates with ex vivo failure of BsAbs.
Lenalidomide, nivolumab, and atezolizumab improve ex vivo response to BsAbs by potentiating T-cell effector functions.

Abstract
Bispecific antibodies (BsAbs) can induce long-term responses in patients with refractory and relapsed B-cell lymphoma. Nevertheless, response rates across patients are heterogeneous, and the factors determining quality and duration of responses are poorly understood. To identify key determinants of response to BsAbs, we established a primary, autologous culture model allowing us to mimic treatment with CD3xCD19 and CD3xCD20 BsAbs within the lymph node microenvironment ex vivo. T cell–mediated killing of lymphoma cells and proliferation of T cells varied significantly among patients but highly correlated between BsAbs targeting CD20 or CD19. Ex vivo response to BsAbs was significantly associated with expansion of T cells and secretion of effector molecules (eg, granzyme B, perforin) but not with expression of T-cell exhaustion (eg, PD1, TIM3) or activation markers (eg, CD25, CD69) or formation of intercellular contacts. In addition, we identified a distinct phenotype of regulatory T cells that was linked to ex vivo response independently from T-cell frequency at baseline. High expression levels of Aiolos (IKZF1), ICOS, and CXCR5 were positively associated with ex vivo response, whereas strong expression of Helios (IKZF2) had an unfavorable impact on ex vivo response to BsAbs. We further showed that lenalidomide, nivolumab, and atezolizumab improved ex vivo response to BsAbs by potentiating T-cell effector functions. In summary, our ex vivo study identified a distinct regulatory T-cell phenotype as a potential contributor to treatment failure of BsAbs and suggests drug combinations of high clinical relevance that could improve the efficacy of BsAbs.
Introduction
Redirection of autologous T cells has emerged as an effective therapeutic principle to target B-cell malignancies. One approach includes genetically modified chimeric antigen receptor (CAR) T cells that can induce complete response rates in up to 54% of patients with refractory aggressive B-cell non-Hodgkin lymphomas (B-NHLs).1-4 However, the time-consuming manufacturing process complicates the treatment of aggressive B-NHLs in clinical practice and often requires effective bridging therapies.5,6 Bispecific antibodies (BsAbs), in contrast, are an off-the-shelf approach that redirect T cells in vivo against malignant B cells by concomitant binding to CD3 and a target antigen such as CD19 or CD20.7 Blinatumomab, the first-in-class anti-CD19 BsAb, is an essential treatment option for patients with relapsed B-lineage acute lymphoblastic leukemia (B-ALL)8,9 and is often used as bridging therapy to allogeneic stem cell transplantation. Despite an overall response rate of up to 69% in patients with relapsed and refractory B-NHL, blinatumomab has never been approved for any B-NHL entity.10-12 Recently, several anti-CD20 BsAbs have shown promising preclinical activity13-16 and are currently under investigation as single or combination agents in patients with relapsed and refractory B-NHL (eg, #NCT03677154, #NCT03671018, #NCT04246086, #NCT04313608).
Similar to CAR T-cell therapy, BsAbs display a heterogeneous pattern of response and potentially severe side effects.8-11 Consequently, there is a high need to better understand treatment failure and success. The few existing preclinical studies are based on cell line models, healthy donor–derived T cells, or xenograft models,17-20 thereby disregarding the role of T cells derived from the tumor microenvironment. Preexisting T-cell exhaustion, for instance, might be a key factor for failure of T cell–engaging therapies.21-25 Exhausted T cells and their phenotype, including the expression of PD-1, TIM-3, LAG-3, and TIGIT, have been extensively studied21-27 ; however, their clinical implications, particularly regarding T cell–based therapies in B-NHL, remain unclear.
Here, we aimed to identify major determinants of response to BsAbs in nodal B-NHL, with a particular focus on the role of lymph node–infiltrating T cells. Using primary lymphoma samples, we successfully designed a culture assay that reflects the in vivo composition of malignant and nonmalignant cells within the lymph node compartment. We were able to mimic the key features of BsAb treatment, including T-cell activation, production of effector molecules, and T cell–mediated killing of B cells. We identified a regulatory T-cell phenotype that was associated with ex vivo response to BsAbs. In addition, we assessed potential combination treatments of high clinical relevance, such as lenalidomide and checkpoint inhibitors, and showed their ability to improve the efficacy of BsAb.
Materials and methods
Selection of patient samples and lymph node processing
The current study was approved by the ethics committee of the University of Heidelberg and conducted according to the Declaration of Helsinki. Informed consent of all patients was obtained in advance. Apart from the histopathologic diagnosis, no specific inclusion or exclusion criteria were applied. Supplemental Table 1 summarizes the basic data of all B-NHL samples used in this study. Lymph node samples were processed as previously described.28
Flow cytometry–based drug screening
Lymph node cells were thawed and resuspended in RPMI 1640 medium supplemented with 10% heat-inactivated AB male human serum (MilliporeSigma, St. Louis, MO) and put on a roll mixer for 3 hours to remove debris and dead cells. Cells were then poured through a 70 µm strainer and seeded at a density of 200 000 cells per 200 µL in a 96-well plate. Next, the following drugs were added to the cells: CD19-BsAb (blinatumomab, 0.1 ng/mL, 1 ng/mL, 10 ng/mL, 100 ng/mL), nivolumab (5 µg/mL), atezolizumab (30 µg/mL) (all three provided by the pharmacy of the University Hospital Heidelberg, Heidelberg, Germany), CD20-BsAb (10 ng/mL, 100 ng/mL, 1000 ng/mL, 10 000 ng/mL, provided by Genentech [San Francisco, CA] via material transfer agreement), anti-CD3 antibody (100 ng/mL; catalog #14-0038-82, Thermo Fisher Scientific, Dreieich, Germany), lenalidomide (1 µM; catalog #S1029, Selleck Chemicals, Houston, TX), ibrutinib (1 µM; catalog #S2680, Selleck Chemicals), idelalisib (1 µM; catalog #S2226, Selleck Chemicals), and venetoclax (0.1 µM; catalog #S8048, Selleck Chemicals). The concentration of dimethyl sulfoxide was adjusted in all wells to 0.1%. After 7 days, supernatants were taken, and cells were washed and stained. Dyes and antibodies used in this study are summarized in supplemental Table 2. After staining, precision count beads (catalog #424902, BioLegend, San Diego, CA) were added, enabling the quantification of absolute cell numbers. Finally, samples were analyzed with an LSR Fortessa equipped with an HTS system (BD Biosciences, Heidelberg, Germany) and BD FACSDiva software (BD Biosciences). Per well, a minimum of 10 000 events were recorded.
Immunophenotyping of T and B cells
Lymph node–derived cells were thawed and processed as described earlier. For baseline immunophenotyping, cells were stained right after thawing. For post–drug screening analysis, cells were incubated as described earlier. Antibodies used for immunophenotyping are summarized in supplemental Table 2. For intracellular markers, cells were fixed and permeabilized (catalog #00-5523-00, Thermo Fisher Scientific). Per condition, staining panel, and sample, a minimum of 50 000 events was recorded.
Analysis of flow cytometry data
All flow cytometry data were analyzed by using FlowJo (BD Biosciences). All relevant gating strategies are illustrated in supplemental Figures 1, 2, 3, and 4. Precision count beads (catalog #424902, BioLegend) were used to quantify absolute cell numbers. The percentage of viable B cells and the x-fold expansion of T cells represent absolute numbers of B or T cells normalized to the mean absolute number of B or T cells of untreated controls.
Cytokine measurement
Supernatants were taken as described earlier. Perforin, granzyme A/B (GZMA/B), interferon-γ (IFN-γ), interleukin-2 (IL-2), IL-6, IL-10, tumor necrosis factor (TNF), soluble Fas ligand (sFasL), and soluble Fas (sFas) were determined by using a bead-based immunoassay (LEGENDplex, catalog #740267, BioLegend). The assay itself and subsequent analysis were performed according to the manufacturer’s protocol. The measurements were performed by using an LSR Fortessa.
Confocal microscopy
Lymph node–derived cells were thawed and processed as described earlier. Cells were seeded at a density of 50 000 cells per well in 50 µL in a 384-well microscopy plate (Greiner, Kremsmünster, Austria). Drug perturbation was performed identical to the flow cytometry–based experiments. After 7 days, the medium was partly removed by using an automated liquid handling system (CyBio VarioWell, Analytik Jena, Germany). Afterward, staining solution containing calcein (1:2500; catalog #C3100MP, Thermo Fisher Scientific), Hoechst (1:2500; catalog #H3570, Thermo Fisher Scientific), anti–CD3-APC (1:250; catalog #300311, BioLegend), anti–CD19-PE (catalog #302207, BioLegend), and anti–CD20-PE (1:250; catalog #302305, BioLegend) was added. After 60 minutes of incubation, confocal imaging was performed by using an Opera Phenix with a 20× objective (PerkinElmer, Waltham, MA).
Image analysis
Details on imaging analysis are presented in the supplemental Methods.
Statistical analysis
If not otherwise indicated, statistical analysis was performed by using R version 4.0.2 (R Foundation for Statistical Computing, Vienna, Austria). Correlation between 2 continuous variables was analyzed by using the Spearman’s rank correlation coefficient and corresponding P values. Means of 2 samples were compared by using the paired or unpaired Wilcoxon signed-rank test. P values were adjusted for multiple testing by using the Benjamini-Hochberg procedure. All plots were generated by means of the ggplot2 package (version 3.3.2). All box plots show the minimum, first quartile, median, second quartile, and maximum.
Results
Ex vivo lymph node–derived culture assay to mimic the treatment with BsAbs
Here, we established an autologous ex vivo culture model for lymph node–derived malignant B cells and lymphoma-infiltrating T cells to mimic the treatment with BsAbs targeting CD19 or CD20 (ie, CD19-BsAb, CD20-BsAb). As previously shown, the composition of lymph node–derived lymphocytes reflects the in vivo composition of malignant B and nonmalignant T cells within the lymph node niche.28 Figure 1 summarizes the experimental set-up, including read-out methods and parameters. In total, we analyzed ex vivo responses to BsAbs in 33 primary lymph node samples from patients diagnosed with follicular lymphoma, diffuse large B-cell lymphoma, chronic lymphocytic leukemia, and mantle cell lymphoma. Important patient characteristics and the frequency of basic cell subsets, including the effector to target cell ratio at baseline, are summarized in supplemental Table 1.
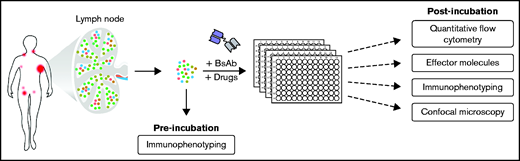
Overview of lymph node–derived culture model and experimental set-up. The experimental setup and the workflow of this study are illustrated.
Overview of lymph node–derived culture model and experimental set-up. The experimental setup and the workflow of this study are illustrated.
CD19-BsAb and CD20-BsAb induce T cell–mediated killing of lymphoma cells
BsAbs successfully induced a concentration-dependent decrease of viable B cells. At their highest concentration, CD19-BsAb and CD20-BsAb led to a median reduction of B cells by 70.2% and 87.9%, respectively (Figure 2A-B). A strong correlation was observed between BsAb targeting CD19 and CD20 regarding the mean reduction of viable B cells across all concentrations (r = 0.90) (Figure 2C). Killing of B cells occurred concomitantly with a concentration-dependent expansion of T cells (eg, a 3.7-fold and 5.7-fold median increase) when treated with the highest concentration of CD19- and CD20-BsAb, respectively (Figure 2D-E). Again, there was good correlation between both BsAbs regarding the mean T-cell expansion across all concentrations (r = 0.80) (Figure 2F).
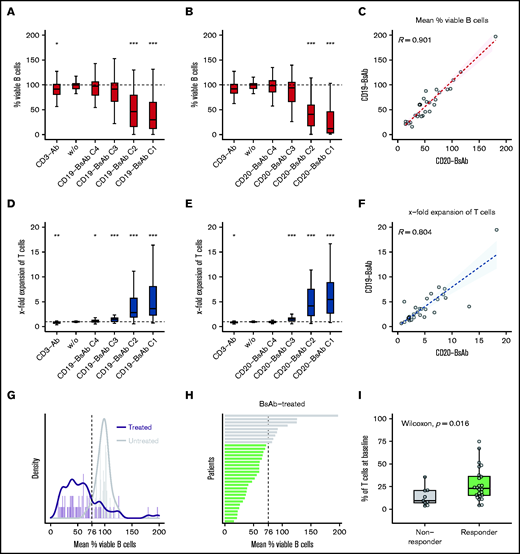
CD20- and CD19-BsAb induce concentration-dependent killing of B cells and expansion of T cells. Lymph node–derived lymphocytes were incubated without (w/o) or with anti-CD3 antibody (CD3-Ab), 4 different concentrations (C1-C4) of CD19-BsAb (n = 33 biologically independent samples), or CD20-BsAb (n = 29 biologically independent samples). Cells were harvested after 7 days and analyzed by using quantitative flow cytometry. Shown are the percentages based on the absolute numbers of viable B cells (A, B) or the x-fold expansion based on the absolute numbers of viable T cells (D, E) normalized to w/o. P values were calculated between w/o and every other condition using the two-sided Wilcoxon’s test. The mean reduction of viable B cells (C) or the mean x-fold expansion of T cells (F) across all concentrations was correlated for the treatment with CD19-BsAb (y-axis) and CD20-BsAb (x-axis). Spearman’s correlation coefficients (R) are given. (G) Histogram showing the mean percentage of viable B cells of CD19-BsAb– or CD20-BsAb–treated (purple) and untreated/control (gray) samples. Solid lines represent corresponding density curves. Dashed vertical line at 76% indicates the point of intersection of both density curves. (H) Bars represent the mean percentage of viable B cells per patient after exposure to BsAbs across all concentrations. Green or gray bars highlight responders or nonresponders, respectively. (I) Shown is the frequency of T cells at baseline for both response groups. If not otherwise indicated, P values were calculated by using the two-sided Wilcoxon’s test and adjusted according to the Benjamini-Hochberg procedure. ***≙P ≤ .001; **≙P ≤ .01; *≙P ≤ .05; missing asterisks indicate P > .05.
CD20- and CD19-BsAb induce concentration-dependent killing of B cells and expansion of T cells. Lymph node–derived lymphocytes were incubated without (w/o) or with anti-CD3 antibody (CD3-Ab), 4 different concentrations (C1-C4) of CD19-BsAb (n = 33 biologically independent samples), or CD20-BsAb (n = 29 biologically independent samples). Cells were harvested after 7 days and analyzed by using quantitative flow cytometry. Shown are the percentages based on the absolute numbers of viable B cells (A, B) or the x-fold expansion based on the absolute numbers of viable T cells (D, E) normalized to w/o. P values were calculated between w/o and every other condition using the two-sided Wilcoxon’s test. The mean reduction of viable B cells (C) or the mean x-fold expansion of T cells (F) across all concentrations was correlated for the treatment with CD19-BsAb (y-axis) and CD20-BsAb (x-axis). Spearman’s correlation coefficients (R) are given. (G) Histogram showing the mean percentage of viable B cells of CD19-BsAb– or CD20-BsAb–treated (purple) and untreated/control (gray) samples. Solid lines represent corresponding density curves. Dashed vertical line at 76% indicates the point of intersection of both density curves. (H) Bars represent the mean percentage of viable B cells per patient after exposure to BsAbs across all concentrations. Green or gray bars highlight responders or nonresponders, respectively. (I) Shown is the frequency of T cells at baseline for both response groups. If not otherwise indicated, P values were calculated by using the two-sided Wilcoxon’s test and adjusted according to the Benjamini-Hochberg procedure. ***≙P ≤ .001; **≙P ≤ .01; *≙P ≤ .05; missing asterisks indicate P > .05.
Ex vivo response to BsAbs is associated with T-cell frequency at baseline
To further investigate factors that affect BsAb-mediated killing of B cells, we used the mean percentages of viable B cells after exposure to CD19-BsAb or CD20-BsAb (Figure 2C) as a continuous parameter for ex vivo response. To define ex vivo response additionally as a discrete parameter, we compared the mean percentage of viable B cells after exposure to BsAbs vs the percentage of viable B cells in untreated/control samples. The corresponding density curves intersected at 76% (Figure 2G); consequently, samples were classified as ex vivo responders or nonresponders depending on whether the mean percentage of viable B cells was lower or higher than 76%, respectively (Figure 2H).
Both the frequency of T cells at baseline (P = .016) (Figure 2H) and their expansion upon exposure to BsAbs (P = .011) (supplemental Figure 5A) were significantly higher in responders, whereas the ratio of CD4+ vs CD8+ T cells at baseline was similar between responding and nonresponding samples (supplemental Figure 5B). Correlating the mean percentage of viable B cells pairwise with the frequency of T cells at baseline (R = −0.43; P = .013) (supplemental Figure 5C), the expansion of T cells upon exposure to BsAbs (R = −0.36; P = .042) (supplemental Figure 5D) or the ratio of CD4+ vs CD8+ T cells at baseline (R = 0.02; P = .92) (supplemental Figure 5E) led to comparable results. In addition, neither pretreatment history of the lymph node donor (supplemental Figure 5F) nor sex (supplemental Figure 5G) or lymphoma entity (supplemental Figure 5H) was associated with ex vivo response to BsAbs.
Ex vivo response to BsAbs is linked to secretion of effector molecules
We further measured the T-cell effector molecules GZMBA, GZMB, IFN-γ, IL10, IL-2, IL-6, perforin, sFas, and sFasL after incubating ex vivo lymph node cultures with CD19-BsAb. We detected high secretion of GZMB, IFN-γ, IL-10, perforin, sFasL (Figure 3A), and, at lower levels, GZMA and sFas (supplemental Figure 6A), showing that our culture model reproduces another key feature of BsAb treatment.29 In contrast, hardly any IL-2, TNF, or IL-6 was detected, further suggesting that redirected T cells neither secrete nor depend on these effector molecules for their cytotoxic activity, which is in line with previous results.30
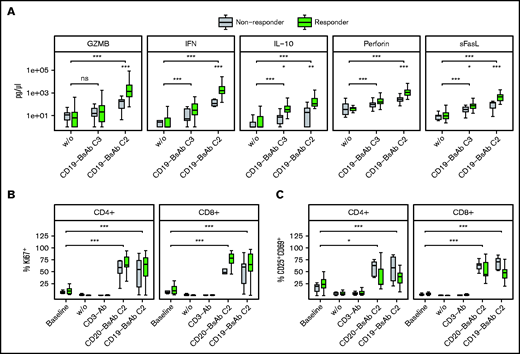
BsAbs induce secretion of effector molecules and expression of activation markers in CD4+ and CD8+ T cells. Lymph node–derived lymphocytes were incubated without (w/o) or with anti-CD3 antibody (CD3-Ab), one or two concentrations of CD19-BsAb (n = 32 biologically independent samples), or one concentration of CD20-BsAb (n = 14 biologically independent samples). Supernatants (A) or cells (B-C) were harvested after 7 days and analyzed by using flow cytometry or a bead-based immunoassay, respectively. In addition, the same samples were analyzed by flow cytometry at baseline. Shown in panel A are the levels of 5 different effector molecules, as indicated. Box plots in panels B and C display the proportion of the given cell subset of the total CD4+ and CD8+ T cells. The classification into responders and nonresponders refers to Figure 2H. P values were calculated between both response groups as indicated by the brackets using the two-sided Wilcoxon’s test. P values were adjusted by using the Benjamini-Hochberg procedure. ***≙ P ≤ .001; **≙ P ≤ .01; *≙ P ≤ .05; missing asterisks indicate P > .05. ns, not significant.
BsAbs induce secretion of effector molecules and expression of activation markers in CD4+ and CD8+ T cells. Lymph node–derived lymphocytes were incubated without (w/o) or with anti-CD3 antibody (CD3-Ab), one or two concentrations of CD19-BsAb (n = 32 biologically independent samples), or one concentration of CD20-BsAb (n = 14 biologically independent samples). Supernatants (A) or cells (B-C) were harvested after 7 days and analyzed by using flow cytometry or a bead-based immunoassay, respectively. In addition, the same samples were analyzed by flow cytometry at baseline. Shown in panel A are the levels of 5 different effector molecules, as indicated. Box plots in panels B and C display the proportion of the given cell subset of the total CD4+ and CD8+ T cells. The classification into responders and nonresponders refers to Figure 2H. P values were calculated between both response groups as indicated by the brackets using the two-sided Wilcoxon’s test. P values were adjusted by using the Benjamini-Hochberg procedure. ***≙ P ≤ .001; **≙ P ≤ .01; *≙ P ≤ .05; missing asterisks indicate P > .05. ns, not significant.
Levels of GZMB, IFN, IL-10, perforin, and sFasL were significantly increased in ex vivo responders compared with nonresponders, as classified earlier (Figures 2H,3A). Comparable results were obtained by correlating the mean percentage of viable B cells (Figure 2H) and the levels of GZMB, IFN, IL-10, perforin, or sFasL (R less than or equal to −0.49; P ≤ .01) (supplemental Figure 6B), suggesting that these effector molecules are associated with ex vivo response to BsAbs.
BsAbs trigger T-cell activation independently of induced ex vivo response
Next, we investigated whether BsAbs changed the phenotype of lymphoma-infiltrating CD4+ and CD8+ T cells, and if so, whether these changes were linked to ex vivo response to BsAbs. Both CD19-BsAb and CD20-BsAb strongly induced Ki67 expression in CD4+ and CD8+ T cells, showing that these cells were actively cycling in our culture model (Figure 3B). Among CD4+ and CD8+ T cells, we observed an increased proportion of CD25+CD69+ (Figure 3C) and GZMB+ cells (supplemental Figure 7A) as well as enhanced expression of ICOS (supplemental Figure 7B), suggesting an activated T-cell phenotype upon BsAb treatment. Moreover, BsAbs converted effector to central memory T cells (supplemental Figure 8A-B). Molecules associated with T-cell exhaustion, namely TIM3 and TIGIT, were also induced in CD4+ and CD8+ T cells (supplemental Figure 7C-D), whereas the expression of PD1 and the percentage of CD57+ cells were not significantly changed upon exposure to BsAbs (supplemental Figure 7E-F).
We further investigated if these T-cell subsets were differentially distributed between ex vivo responders and nonresponders (Figure 3B-C; supplemental Figure 7). However, none of the aforementioned markers measured at baseline or after exposure to BsAb, including the exhaustion markers TIM3, TIGIT, or PD1, was significantly different between ex vivo responders and nonresponders. Only the induction of CD4+GZMB+ and CD8+GZMB+ populations was stronger in responders than in nonresponders, which is in line with greater amounts of GZMB in the supernatants (Figure 3A). Taken together, these results suggest that response to BsAbs is not primarily determined by expression of exhaustion markers at baseline or T-cell activation upon BsAb treatment.
A regulatory T-cell phenotype determining ex vivo response to BsAbs
Increased frequencies of regulatory T cells in peripheral blood have been associated with reduced efficacy of blinatumomab in B-ALL.31 Here, we also quantified regulatory T cells at baseline (FoxP3+CD25– and FoxP3+CD25+) (Figure 4A) and found that lymph nodes infiltrated by B-NHL harbored significantly higher numbers of FoxP3+CD25– and FoxP3+CD25+ T cells compared with reactive (nonmalignant) lymph nodes. However, there was no significant difference between responding and nonresponding samples (Figure 4B). After exposure to BsAbs, the overall proportion of FoxP3+ T cells was similar compared with baseline (supplemental Figure 9A), although their composition was shifted toward FoxP3+CD25+ regulatory T cells (supplemental Figure 9B).
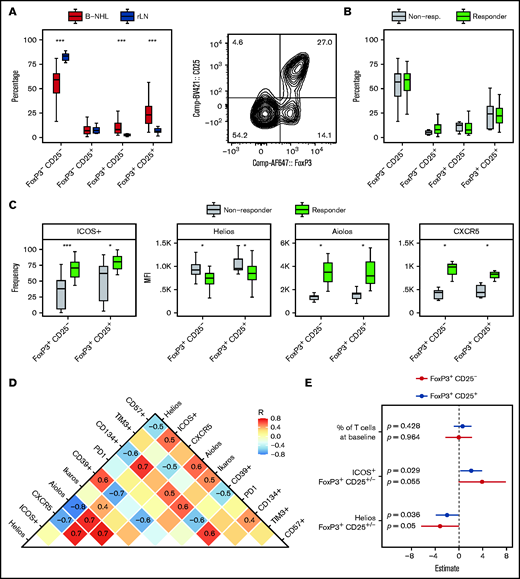
Regulatory T-cell phenotype is associated with ex vivo response to BsAbs. Shown is a representative contour plot of regulatory T cells, which were identified as viable CD3+CD4+FoxP3+CD25+/− cells of the total CD4+ T cells. Shown are 42 (A) or 33 biologically independent (B-C) samples. Box plots in panel C of the indicated markers show either the median fluorescence intensity (MFI) or the frequency of positive (+) cells of total FoxP3+CD25+/− T cells. Differences between both response groups or between B-NHL and reactive lymph node (rLN) samples were evaluated by using the two-sided Wilcoxon’s test. P values were corrected for multiple testing by using the Benjamini-Hochberg procedure. (D) Additional markers were determined in 15 biologically independent samples and correlated among each other. Spearman’s correlation coefficients (R) are displayed if the absolute R value was ≥0.4. (E) Forest plot illustrating a multivariate logistic regression with the indicated covariates and response status (responder, nonresponder) as dependent variable. The model was calculated separately for FoxP3+CD25+/− regulatory T cells. ***≙ P ≤ .001; *≙ P ≤ .05; missing asterisks indicate P > .05.
Regulatory T-cell phenotype is associated with ex vivo response to BsAbs. Shown is a representative contour plot of regulatory T cells, which were identified as viable CD3+CD4+FoxP3+CD25+/− cells of the total CD4+ T cells. Shown are 42 (A) or 33 biologically independent (B-C) samples. Box plots in panel C of the indicated markers show either the median fluorescence intensity (MFI) or the frequency of positive (+) cells of total FoxP3+CD25+/− T cells. Differences between both response groups or between B-NHL and reactive lymph node (rLN) samples were evaluated by using the two-sided Wilcoxon’s test. P values were corrected for multiple testing by using the Benjamini-Hochberg procedure. (D) Additional markers were determined in 15 biologically independent samples and correlated among each other. Spearman’s correlation coefficients (R) are displayed if the absolute R value was ≥0.4. (E) Forest plot illustrating a multivariate logistic regression with the indicated covariates and response status (responder, nonresponder) as dependent variable. The model was calculated separately for FoxP3+CD25+/− regulatory T cells. ***≙ P ≤ .001; *≙ P ≤ .05; missing asterisks indicate P > .05.
We further analyzed the phenotype of FoxP3+CD25– and FoxP3+CD25+ regulatory T cells, including IKZF1 (Ikaros), IKZF2 (Helios), and IKZF3 (Aiolos), as well as the surface molecules ICOS, CXCR5, PD1, CD39, CD134, and TIM3, which are commonly associated with the activity of regulatory T cells. We observed that regulatory T cells of ex vivo responders showed significantly higher expression of ICOS, CXCR5, and Aiolos, whereas expression of Helios was reduced compared with nonresponders (Figure 4C). All determined markers were correlated to analyze coexpression patterns (Figure 4D). Helios expression correlated positively with expression of CD39, which is known to mediate suppressive effects of regulatory T cells,32 whereas ICOS was coexpressed with CD134, CD57, Aiolos, and CXCR5.
To investigate whether this phenotype of regulatory T cells was associated with ex vivo response independently from the T-cell frequency at baseline (Figure 2I), we calculated a multivariate logistic regression with T-cell frequency at baseline, ICOS and Helios expression as covariates, and response status (ie, responder, nonresponder) as dependent variable (Figure 4E). The expression of ICOS (P = .029) and Helios (P = .036) among FoxP3+CD25+ regulatory T cells was significantly more important at predicting ex vivo response to BsAbs than the frequency of T cells at baseline (P = .428). Moreover, this analysis confirmed that high ICOS but low Helios expression was favorable for ex vivo response. Similar results were obtained for FoxP3+CD25– regulatory T cells.
These data suggest that the phenotype of regulatory T cells might be an essential factor contributing to the failure of BsAb treatment.
Confocal microscopy reveals ex vivo clustering induced by BsAbs
We used confocal microscopy to visualize intercellular interactions upon exposure to BsAbs and to investigate if the lack of ex vivo response could be explained by a lack of interaction between B and T cells (Figure 5A). Treatment of ex vivo lymph node cultures with BsAbs induced large clusters, which were mainly composed of viable T cells (Figure 5B-C). The cluster size was concentration dependent and significantly increased with increasing concentrations of the CD19-BsAb (Figure 5D). The number of B cells within clusters significantly decreased after exposure to CD19-BsAb (Figure 5E), whereas the number of cluster-derived T cells increased with increasing concentrations of BsAb (Figure 5F). Ex vivo treatment with CD20-BsAb led to comparable results (supplemental Figure 10A-C).
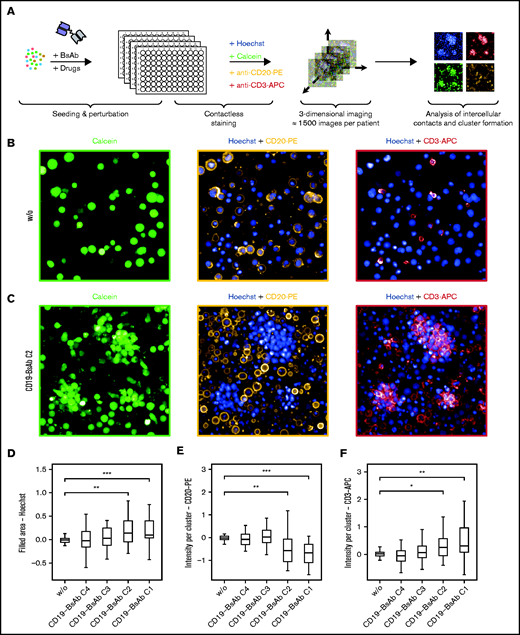
BsAbs induce clustering of T cells and B cells. (A) Schematic overview of the confocal microscopy experimental set-up. (B-F) Lymph node–derived lymphocytes (n = 27 biologically independent samples) were seeded into 384-well microscopy plates and incubated for 7 days without (w/o) or with CD19-BsAb at 4 different concentrations (C1-C4). After 7 days, cells were stained with Hoechst, calcein, anti-CD20 PE-conjugated, and anti-CD3 APC-conjugated antibodies. Shown are representative images for the untreated condition in panel B and the CD19-BsAb–treated condition in panel C separated by channel as indicated. The filled area of clusters was quantified (panel D) and the intensity of CD20-PE (panel E) or CD3-APC (panel F) within these clusters was determined. All conditions were tested for significance vs untreated control (w/o) using the two-sided Wilcoxon’s test. P values were corrected for multiple testing by using the Benjamini-Hochberg procedure. *** ≙ P ≤ .001; ** ≙ P ≤ .01; * ≙ P ≤ .05; missing asterisks and/or horizontal brackets indicate P > .05. APC: allophycocyanin; PE: phycoerythrin.
BsAbs induce clustering of T cells and B cells. (A) Schematic overview of the confocal microscopy experimental set-up. (B-F) Lymph node–derived lymphocytes (n = 27 biologically independent samples) were seeded into 384-well microscopy plates and incubated for 7 days without (w/o) or with CD19-BsAb at 4 different concentrations (C1-C4). After 7 days, cells were stained with Hoechst, calcein, anti-CD20 PE-conjugated, and anti-CD3 APC-conjugated antibodies. Shown are representative images for the untreated condition in panel B and the CD19-BsAb–treated condition in panel C separated by channel as indicated. The filled area of clusters was quantified (panel D) and the intensity of CD20-PE (panel E) or CD3-APC (panel F) within these clusters was determined. All conditions were tested for significance vs untreated control (w/o) using the two-sided Wilcoxon’s test. P values were corrected for multiple testing by using the Benjamini-Hochberg procedure. *** ≙ P ≤ .001; ** ≙ P ≤ .01; * ≙ P ≤ .05; missing asterisks and/or horizontal brackets indicate P > .05. APC: allophycocyanin; PE: phycoerythrin.
Responding samples had significantly lower B-cell proportions within clusters compared with nonresponding samples (supplemental Figure 10D-E), confirming the validity of the reported BsAb-mediated effects across different read-out methods. However, the cluster area in nonresponders was not reduced compared with responders (supplemental Figure 10F-G), suggesting that a lack of cell–cell interactions does not explain the failure of BsAb killing in nonresponding samples.
Lenalidomide and checkpoint inhibitors improve response to BsAb
Finally, we aimed to improve the efficacy of BsAb by clinically relevant drug combinations, particularly in samples without sufficient ex vivo response (nonresponders). Considering that potential combinations could also deteriorate the activity of BsAb by their negative impact on T cells, we tested 2 different concentrations of BsAb: a lower concentration with only moderate single-agent activity and a higher concentration that induced considerable killing of B cells and expansion of T cells.
Lenalidomide is an immunomodulatory drug and well known to promote activation of T and NK cells via degradation of IKZF1/3 and induction of IL-2 secretion.33,34 The addition of lenalidomide significantly enhanced the activity of CD19-BsAb at both concentrations regarding the killing of B cells (Figure 6A), the expansion of T cells (Figure 6B), and the secretion of effector molecules (supplemental Figure 11A). In addition to CD19-BsAb, lenalidomide enhanced the activity of CD20-BsAb (supplemental Figure 12A-B). Similar, although less pronounced, effects were observed when combining the checkpoint inhibitors atezolizumab (anti-PDL1) or nivolumab (anti-PD1) with CD19-BsAb (Figure 6A-B; supplemental Figure 11B) or CD20-BsAb (supplemental Figure 12A-B).

Lenalidomide and checkpoint inhibitors improve response to BsAbs. Lymph node–derived lymphocytes were incubated without (w/o) or with 2 concentrations (C2, C3) of CD19-BsAb (C3 ≙ “Low,” C2 ≙ “High”) or 1 concentration of CD20-BsAb (C3 ≙ “Low”) and/or 1 combination drug as indicated. Cells were harvested after 7 days and analyzed by using quantitative flow cytometry. Box plots show the percentages of the absolute numbers of viable B cells (A, C, D) or the x-fold expansion of viable T cells (B). The blue (panel A, B cells) and red (panel B, T cells) solid lines connect the medians of each condition to ease interpretation. Shown are data from n = 27 (low concentration of CD19-BsAb) or n = 13 (high concentration of CD19-BsAb) or n = 24 (low concentration of CD20-BsAb) biologically independent samples. (C and D) Data were separated by the response groups, as defined in Figure 2H. Conditions were tested for significance either as indicated by the brackets (panels A and B) or between the 2 response groups (panels C and D) by using the paired (panels A and B) or unpaired (panels C and D) two-sided Wilcoxon’s test. P values were corrected for multiple testing by using the Benjamini-Hochberg procedure. *** ≙ P ≤ .001; ** ≙ P ≤ .01; * ≙ P ≤ .05; ns ≙ P > .05. ns, not significant.
Lenalidomide and checkpoint inhibitors improve response to BsAbs. Lymph node–derived lymphocytes were incubated without (w/o) or with 2 concentrations (C2, C3) of CD19-BsAb (C3 ≙ “Low,” C2 ≙ “High”) or 1 concentration of CD20-BsAb (C3 ≙ “Low”) and/or 1 combination drug as indicated. Cells were harvested after 7 days and analyzed by using quantitative flow cytometry. Box plots show the percentages of the absolute numbers of viable B cells (A, C, D) or the x-fold expansion of viable T cells (B). The blue (panel A, B cells) and red (panel B, T cells) solid lines connect the medians of each condition to ease interpretation. Shown are data from n = 27 (low concentration of CD19-BsAb) or n = 13 (high concentration of CD19-BsAb) or n = 24 (low concentration of CD20-BsAb) biologically independent samples. (C and D) Data were separated by the response groups, as defined in Figure 2H. Conditions were tested for significance either as indicated by the brackets (panels A and B) or between the 2 response groups (panels C and D) by using the paired (panels A and B) or unpaired (panels C and D) two-sided Wilcoxon’s test. P values were corrected for multiple testing by using the Benjamini-Hochberg procedure. *** ≙ P ≤ .001; ** ≙ P ≤ .01; * ≙ P ≤ .05; ns ≙ P > .05. ns, not significant.
The Bruton tyrosine kinase inhibitor ibrutinib did not significantly alter ex vivo response to CD19-BsAb (Figure 6A-B) or CD20-BsAb (supplemental Figure 12A-B). Idelalisib, a PI3 kinase inhibitor, significantly deteriorated expansion of T cells induced by CD19-BsAb or CD20-BsAb (supplemental Figure 12B). Venetoclax exerted considerable cytotoxicity as a single agent, thereby reducing the number of viable B cells when combined with CD19-BsAbS or CD20-BsAb (supplemental Figure 11A). Expansion of T cells was unaffected when venetoclax was added to CD19-BsAb but deteriorated when added to CD20-BsAb.
We next analyzed which patients benefited most from lenalidomide and checkpoint inhibitors. Regarding the killing of B cells (Figure 6C-D), the secretion of effector molecules, such as GZMB and IL-10 (supplemental Figure 13A-B), and the expansion of T cells (supplemental Figure 13C-D), these drugs enhanced the impact of CD19-BsAb and CD20-BsAb predominantly in samples already showing a response to BsAb mono-treatment. These results indicate that the addition of lenalidomide or checkpoint inhibitors was not able to convert nonresponders into responders but rather improved preexisting response by enhancing T-cell effector functions.
Discussion
In the current study, we established a primary, lymph node–derived culture model to mimic the treatment of B-NHL with BsAbs ex vivo and were thus able to identify key factors determining the induced response. First, we showed that our assay reflected the most important functional features of BsAb treatment, including activation of T cells, production of effector molecules, and T cell–mediated killing of B cells. Wong et al35 treated peripheral blood–derived chronic lymphocytic leukemia samples ex vivo with blinatumomab and detected similar patterns in their study. In our culture model, responses to BsAb varied significantly among patients but highly correlated between BsAbs targeting CD20 or CD19. To identify factors that affect ex vivo response to BsAbs, we quantified effector molecules and characterized lymph node–derived T cells before and after incubation with BsAbs. As expected, higher levels of cytotoxic effector molecules (eg, perforin) and stronger expansion of T cells upon BsAb treatment were associated with ex vivo response. In contrast, the expression of activation markers themselves, such as CD25, CD69, and ICOS, was not significantly different between samples with and without ex vivo response to BsAbs. These findings indicate that lymph node–derived T cells could be successfully activated in all samples but in some cases were unable to expand or to secrete sufficient amounts of effector molecules to induce killing of B cells. In our study, this limited cytotoxic activity was not related to a more exhausted T-cell phenotype at baseline because expression of PD1, TIM3, or TIGIT was not associated with ex vivo response to BsAbs. Failure of CD19 CAR T-cell therapy, in contrast, can be linked to T-cell exhaustion.36 We therefore speculate that BsAbs might still be a treatment option for patients who fail to respond to CAR T-cell therapy.
Because regulatory T cells can suppress activated T cells and subsequent cytokine production,37-39 they represent another potential explanation for failure of BsAb treatment despite successful T-cell activation. Duell et al31 investigated the frequency of regulatory T cells in 42 blood samples derived from patients with ALL before treatment with blinatumomab. The investigators found that in vivo nonresponders had a significantly higher frequency of regulatory T cells than in vivo responders. Similar results were obtained by Verkleij et al40 in a multiple myeloma ex vivo bone marrow model. Even though we could not confirm these results in the lymph node compartment of B-NHL, we identified a distinct phenotype of regulatory T cells that was associated with ex vivo response to BsAbs. Strong expression of the transcription factor Helios (IKZF2) was associated with nonresponse, whereas expression of Aiolos (IKZF3) was higher in responding samples. This result coincides with previous research showing that Aiolos and Helios have opposite roles in regulatory T cells.41 Strong expression of Helios is attributed to a highly suppressive phenotype,42 whereas impaired or reduced expression of Helios was found to be associated with a consecutive lack of inhibitory activity.43,44 Among the suppressive effector molecules, IL-10 is one of the key candidates by which regulatory T cells could mediate such a treatment failure.45 However, IL-10 is also able to activate CD8+ T cells and to promote antitumor activity.46 In our assay, IL-10 was secreted along with cytotoxic effector molecules and detected in even higher levels in ex vivo responders. Therefore, IL-10 unlikely contributes substantially to failure of BsAb treatment in patients with the aforementioned phenotype of regulatory T cells. Similarly, Duell et al31 regarded a cytokine-based mechanism as unlikely and considered rather a cell–cell contact-dependent mechanism explaining how regulatory T cells inhibit the cytotoxic response against malignant B cells. Using confocal microscopy, we confirmed that intercellular contacts are preserved upon exposure to BsAbs even in ex vivo nonresponders.
We further aimed to improve the efficacy of BsAbs by combining them with clinically relevant drugs. We found that the combination of BsAbs and lenalidomide or checkpoint inhibitors significantly enhanced expansion of T cells, production of effector molecules, and T cell–mediated killing of B cells. Indeed, lenalidomide is currently being evaluated as a combination partner for blinatumomab or mosunetuzumab, another CD20-BsAb, in different phase 1 studies in patients with B-NHL (#NCT02568553 and #NCT04246086). Similarly, there are clinical trials evaluating blinatumomab in combination with nivolumab in patients with ALL (NCT04546399) and mosunetuzumab in combination with atezolizumab in patients with B-NHL (NCT02500407). In vivo data, potentially confirming our ex vivo results, are not yet available.
In summary, to the best of our knowledge our study is the first to investigate the ex vivo response to BsAbs by using primary lymph node–derived lymphocytes from patients with nodal B-NHL. We identified a distinct regulatory T-cell phenotype that might be an essential factor for failure of BsAb treatment. Moreover, we showed that lenalidomide and checkpoint inhibitors are promising combination drugs for BsAb treatment. Further studies ideally accompanying prospective clinical trials are needed to confirm our findings in vivo.
Acknowledgments
The authors thank Angela Lenze (University Hospital Heidelberg), the EMBL flow core facility, and the pharmacy of the University Hospital Heidelberg for their excellent (technical) assistance.
T.R. was supported by a physician scientist fellowship of the Medical Faculty of University Heidelberg. M.S. was supported by a grant of the Deutsche Forschungsgemeinschaft. S.D. was supported by a grant of the Hairy Cell Leukemia Foundation, the Heidelberg Research Centre for Molecular Medicine, and an e:med BMBF junior group grant and Deutsche Forschungsgemeinschaft through the SFB873 project B7. P.M.R. was supported by a fellowship of the DKFZ Clinician Scientist Program and by the Dieter Morszeck Foundation.
Authorship
Contribution: T.R., M.K., C.K., and M.B. conducted experiments; T.R. and M.B. acquired data; T.R., B.J.B., M.S., and S.D. wrote the paper; T.R., V.K., and W.H. performed data analysis; P.M.R., P.D., C.M.-T., and S.D. designed the study; and C.M.-T. and S.D. provided reagents.
Conflict-of-interest disclosure: The authors declare no competing financial interests.
Correspondence: Sascha Dietrich, Department of Medicine V, University Hospital Heidelberg, Im Neuenheimer Feld 410, 69120 Heidelberg, Germany; e-mail: sascha.dietrich@embl.de.

