

Key Points
PBMCs obtained from SCT individuals restrict HIV-1 infection, and inhibition of HO-1 partially reversed the restriction.
WLH had lower SCT prevalence and those with SCT had higher levels of CD4+/CD8+ ratios compared with non-SCT WLH.

Abstract
Patients with sickle cell disease (SCD) have a lower risk for HIV-1 infection. We reported restriction of ex vivo HIV-1 infection in SCD peripheral blood mononuclear cells (PBMCs) that was due, in part, to the upregulation of antiviral, inflammatory, and hemolytic factors, including heme oxygenase-1 (HO-1). Here, we investigated whether individuals with sickle cell trait (SCT), who develop mild hemolysis, also restrict HIV-1 infection. Ex vivo infection of SCT PBMCs exhibited an approximately twofold reduction of HIV-1 replication and lower levels of HIV-1 reverse transcription products, 2-long terminal repeat circle, HIV-1 integration, and gag RNA expression. SCT PBMCs had higher HO-1 messenger RNA (mRNA) and protein levels and reduced ribonucleotide reductase 2 (RNR2) protein levels. HO-1 inhibition by tin porphyrin eliminated ex vivo HIV-1 restriction. Among Howard University clinic recruits, higher levels of HO-1 and RNR2 mRNA and lower HIV-1 env mRNA levels were found in SCT individuals living with HIV-1. To determine the population-level effect of SCT on HIV-1 prevalence, we assessed SCT among women living with HIV (WLH) in the WIHS (Women Interagency HIV-1 Study). Among WIHS African-American participants, the prevalence of SCT was lower among women with HIV compared with uninfected women (8.7% vs 14.2%; odds ratio, 0.57; 95% confidence interval, 0.36-0.92; P = .020). WIHS WLH with SCT had higher levels of CD4+/CD8+ ratios over 20 years of follow-up (P = .003) than matched WLH without SCT. Together, our findings suggest that HIV-1 restriction factors, including HO-1 and RNR2, might restrict HIV-1 infection among individuals with SCT and limit the pathogenicity of HIV.
Introduction
Sickle cell disease (SCD), a group of inherited disorders that affect hemoglobin (Hb), is the most common monogenic disorder and affects millions of people worldwide. In the United States, the number of people with SCD is ∼100 000 and an additional 3 million people carry the sickle cell trait (SCT).1 The most common sickle cell mutation is HbS (Glu6Val substitution in β-globin), followed by the HbC mutation (Glu6Lys substitution in β-globin), and the prevalence of SCT is 12.5% in Washington, DC (combined HbAS and HbAC).2 Several previous studies have suggested that patients with SCD are less likely to acquire HIV-1 infection and have slower disease progression.3-5 The prevalence of anti–HIV-1 but not human T-cell leukemia virus type 1 antibodies was low (2.7% vs 7.9%) in patients with SCD transfused with blood that was not screened for HIV-1.3 Low or nondetectable viral load was observed in a small cohort of HIV-1–infected (HIV-1+) patients with SCD.4
We previously analyzed 400 000 medical records from the National Hospital Discharge Survey database (from 1997-2009), which showed a low frequency of HIV-1 diagnosis among SCD patients (≈1.5% vs ≈3.3%; odds ratio [OR], 0.33; 95% confidence interval [CI], 0.22-0.42) compared with patients with hepatitis C and other blood-borne infections.5 Recently, a study of Nigerian children showed a lower prevalence of SCD and SCT among those with HIV compared with HIV-negative individuals.6 We found lower levels of ex vivo HIV-1 infection in SCD peripheral blood mononuclear cells (PBMCs).7 We attributed this finding to the increased expression of ferroportin (FPN), as FPN inhibition by hepcidin, a FPN inhibitory peptide produced by the liver, reversed HIV-1 inhibition in SCD PBMCs. We postulated that increased FPN expression levels led to reduction of intracellular iron in SCD PBMCs and increased expression of heme and iron-related genes, including hypoxia-induced factor 1α, heme oxygenase-1 (HO-1), nuclear factor of kappa light polypeptide gene enhancer in B-cell inhibitor α (IKBα), and cell cycle–dependent kinase (CDK) inhibitors p21 and p27. In addition, reduced phosphorylation of the SAM domain and HD domain–containing protein 1 (SAMHD1) Thr-592 phosphorylation in SCD PBMCs was linked to the reduction of CDK2 activity and inhibition of HIV-1 reverse transcription (RT). Thus, heme and iron regulatory pathways in SCD contribute to the restriction of HIV-1 infection.
SCT is considered benign compared with SCD, although individuals with SCT have higher risks of chronic kidney disease, atrial fibrillation, and thromboembolism (as reviewed elsewhere8 ). SCT blood has higher viscosity,9 and SCT red blood cells are prone to sickling at low oxygen saturation. We hypothesized that an SCT environment might partially recapitulate that of SCD exhibiting mild hemolysis and local ischemia and thus may confer some protection from or modulation of disease due to HIV-1 infection.
To test this hypothesis, we analyzed HIV-1 infection of SCT PBMCs using 1 round of infection with HIV-1 pseudotyped with vesicular stomatitis virus envelope glycoprotein (VSVG) and continuously replicating T-tropic HIV-1 IIIB. We also determined the affected HIV-1 replication steps, including HIV-1 RT, 2-long terminal repeat (LTR) circles, HIV-1 integration, and HIV-1 transcription. To analyze potential HIV-1 inhibitory factors expressed in SCT PBMCs, customized TaqMan Low Density arrays (Thermo Fisher Scientific, Waltham, MA) containing probes for 42 known restriction factors were used. We identified HO-1 as the only factor showing significant upregulation and validated its effect by using an HO-1 inhibitor, tin porphyrin (snIX).10 We also overexpressed HO-1 to evaluate its effect on HIV-1 replication.
We next tested our hypothesis in SCT individuals with HIV-1 infection, first by analyzing RNA levels of HIV-1 env and several host restriction factors, including HO-1, in PBMC samples obtained from individuals recruited at Howard University Center for Infectious Disease Management and Research (CIDMAR) and pediatric clinics. The association of SCT with HIV-1 infection was then tested in the WIHS (Women’s Interagency HIV Study) cohort of women living with HIV-1. We genotyped all non-Hispanic Black participants in this cohort, identified participants with SCT, and analyzed SCT prevalence among women with HIV-1 infection and at risk of infection. HIV viral load and CD4/CD8 levels among SCT+ HIV-1–infected women in this cohort were also compared. Together, this study pointed to the potential role of SCT on HIV-1 infection in vitro, and on HIV-1 prevalence and pathogenesis at the population level.
Methods
Human subjects research
This study was approved by the Institutional Review Board of Howard University (13-MED-03), and participants without HIV infection were recruited, including those with SCT and control subjects without SCT. The study was conducted in accordance with the Declaration of Helsinki. Prior samples collected under Howard University IRB-09-PED-03 were also used, including samples from HIV-positive patients of all ages and sexes who attended adult (CIDMAR) or pediatric clinics at Howard University Hospital. A parent or guardian consented for those aged ≤17 years, and children aged >8 years gave assent.
Women’s Interagency HIV Study
WIHS, initiated by the National Institute of Allergy and Infectious Diseases in the early 1990s, is a multisite national longitudinal study of HIV-positive participants and high-risk HIV-negative age-matched control subjects that allows comparisons of disease burden according to HIV status, treatment, age, and other markers.11 WIHS participants provide an opportunity for deep longitudinal analysis for HIV infection progression in the United States. WIHS enrolled 2339 women (30% HIV-negative and 70% HIV-positive) at several clinical research centers: Atlanta, Georgia; Birmingham, Alabama/Jackson, Mississippi; Bronx, New York; Brooklyn, New York; Chicago, Illinois; Miami, Florida; Raleigh, North Carolina; San Francisco, California; and Washington, DC. WIHS databases contain longitudinal assessment of incident and fatal cancers, virologic and immunologic plasma and serum biomarkers, genome-wide association studies, and deep sequencing on genes. All participants in WIHS provided informed consent for use of their data and samples for research purposes at the respective institutions in which they were enrolled. Approval for access to these samples for this study was requested and approved by the WIHS Executive Committee after submission and review of a scientific concept sheet. PBMCs were obtained from WIHS repositories for the selected African-American participants. In addition, selected clinical data were shared by using the Kleopatra encryption protocol.
SCT genotyping of WIHS samples
To identify SCT (HbAS) mutations, we modified a previously reported procedure that uses DdeI (CTNGA) restriction digestion that is blunted upon HbS mutation (GAG→GTG).12 DNA was extracted from PBMCs by using a QIAamp DNA Mini Kit (Qiagen, Germantown, MD). DNA concentration was measured on NanoDrop and adjusted to 10 ng/μL. DNA was amplified by polymerase chain reaction (PCR) that was run for 30 cycles (95°C annealing, 55°C annealing, and 72°C extension) with forward primer AGTCAGGGCAGAGCCATCTA and reverse primer GTTTCTATTGGTCTCCTTAAACCTG. PCR reaction products were digested with DdeI restriction enzyme and separated on 1.5% agarose gel. DdeI-digested PCR products were detected as 122 bp and 95 bp products for wild-type β-globin gene and 217 bp, 122 bp, and 95 bp products for SCT.
Cells and media
PBMCs were purchased from Sanguine (Sherman Oaks, CA) or Precision for Medicine (Flemington, NJ), or were isolated from blood of SCT individuals or HbAA participants recruited at Howard University. All cells were cultured at 37°C at 5% carbon dioxide.
Viral vectors
HIV-1 proviral vector pNL4-3.Luc.R-E- (courtesy of Nathaniel Landau, NYU School of Medicine, New York, NY) was obtained from the National Institutes of Health AIDS Research and Reference Reagent Program. HIV-1 (IIIB) was purchased from Advanced Biotechnologies (Eldersburg, MD).
One round of HIV-1 infection of SCT PBMCs
PBMCs were isolated from whole blood7 obtained from SCT (HbAS) and non-SCT (HbAA) individuals. Volunteers with SCT and HbAA control subjects were recruited at Howard University Hospital and donated blood samples according to an investigational review board–approved protocol (supplemental Table 1). HbAS status of SCT was confirmed with a high-resolution high-performance liquid chromatography system. Vesicular stomatitis virus envelope glycoprotein (VSVG)-pseudotyped pNL4-3.Luc.R-E-virus (HIV-1-LUC-G) was prepared as previously described.13 PBMCs were activated before the infection with phytohemagglutinin (0.5 μg/mL) for 24 hours, followed by interleukin-2 (10 U/mL) for 24 hours before the infection with HIV-1-LUC-G at ∼1 ng of p24 per 5 × 10⁶ cells. PBMCs were cultured in 6-well plates at 0.5 × 10⁵ cells/mL, at 37°C and 5% carbon dioxide for 48 hours. The cells were collected, washed with phosphate-buffered saline, and resuspended in 100 μL of phosphate-buffered saline. Then, 100 μL of reconstituted luciferase buffer (LucLite Kit, PerkinElmer, Waltham, MA) was added to each well; after 10 minutes’ incubation, the lysates were transferred into white plates (PerkinElmer) and luminescence measured by using Labsystems Luminoskan RT equipment (PerkinElmer).
Infection of SCT PBMCs with T-tropic HIV-1 IIIB
PBMCs were activated before the infection as described earlier. Cells cultured for 3 days were exposed to T tropic HIV-1 (IIIB) at a multiplicity of infection of 0.01. Cells were collected after 6 hours for viral DNA analysis and 4 days’ postinfection for viral RNA analysis. For quantitative analysis of HIV-1 gag, quantitative PCR was conducted as described earlier14 using primers for HIV gag, forward primer ATAATCCACCTATCCCAGTAGGAGAAAT, and reverse primer TITGGTCCITGTCITATGTCCAGAATGC. Mean cycle number at detection threshold (crossing point [Cp]) values for target genes and 18S ribosomal RNA (rRNA) were determined, and the ΔΔCt method was used to calculate relative expression levels. Statistical significance was determined for Cp gag/Cp 18S RNA ratios, as relative expression levels do not follow Gaussian distribution. For quantification of HIV-1 DNA, PBMCs from individuals with and without SCT were infected as described earlier with HIV-1 (IIIB). Total DNA extraction and quantification of early and late LTR products were performed as described earlier.7 The 2-LTR circles and integrated HIV-1 DNA were measured as previously described.15
Western blot analysis
PBMCs were lysed in whole cell lysis buffer (50 mM Tris-HCl, pH 7.5, 0.5 M NaCl, 1% NP40, 0.1% sodium dodecyl sulfate [SDS]) supplemented with protease cocktail. Proteins were resolved on 4% to 12% Bis-Tris gels (Invitrogen, Carlsbad, CA), transferred to polyvinylidene fluoride membranes, and immunoblotted with the indicated antibodies.
Antibodies
Antibodies were purchased from the following companies: SAMHD1 from Bethyl Laboratories (Montgomery, TX); SAMHD1 phosphorylated on Thr-592 (P-Thr592) from Prosci (Poway, CA); ribonucleotide reductase 2 (RNR2) from Abcam (Cambridge, MA); and β-actin from Santa Cruz Biotechnology (Dallas, Texas).
CDK2 activity assay
The CDK2 activity assay has been described previously.16 Briefly, PBMCs were lysed in whole cell lysis buffer (50 mM Tris-HCl, pH 7.5, 0.3 M NaCl, 1% NP-40, 0.1% SDS) supplemented with protease cocktail (MilliporeSigma, Burlington, MA). CDK2 was immunoprecipitated by using anti-CDK2 antibodies. Kinase assay was performed at 30°C for 20 minutes in the kinase assay buffer containing 2 µg histone H1 as a substrate, 200 μM adenosine triphosphate, and 5 μCi of (γ-32P) adenosine triphosphate. At the end of the incubation, SDS-containing electrophoresis sample buffer was added to stop the reaction, and protein bands were resolved on 10% SDS–polyacrylamide gel electrophoresis. A gel was dried and protein bands were visualized by exposing them to a Phosphor Imager screen and scanning the screen in Cyclon Phospho Imager (formely Packard Bioscience, now PerkinElmer).
HO-1 overexpression
HO-1–expressing plasmid was purchased from OriGene (catalog #RC200463; Rockville, MD) in which HO-1 is expressed with an N-terminal Myc-DDK tag under the control of the human cytomegalovirus (CMV) promoter. 293T cells were grown in 96-well plates and transfected by using Mirus transIT 2020 reagent (Mirus Bio, Madison, WI) as recommended by the manufacturer. HO-1–expressing vector was combined with an empty vector containing CMV promoter to achieve various HO-1 expression levels as indicated and with enhanced green fluorescent protein–expressing vector to normalize the transfection. At 24 hours’ posttransfection, the cells were infected with HIV-1-LUC-G for an additional 48 hours. Luciferase activity was measured as described earlier. To analyze HO-1 expression, 293T cells were grown in 6-well plates and transfected with HO-1–expressing vector for 48 hours. The cells were lysed, and the lysates were resolved on 10% SDS–polyacrylamide gel electrophoresis and immunoblotted with anti–c-Myc antibodies to detect HO-1 expression and anti-actin antibodies for loading control.
Analysis of mRNA expression
Total RNA was extracted by using TRIzol reagent according to the manufacturer’s protocol (Invitrogen, Carlsbad, CA). Total RNA (100 ng) was reverse transcribed to complementary DNA by using a Superscript RT-PCR kit (Invitrogen); hexamers and oligo-dT were used as primers. For Real-time PCR analysis, complementary DNA was amplified by using a Roche LightCycler 480 and SYBR Green1 Master mix (Roche Diagnostics, Indianapolis, IN). PCR was conducted with denaturation at 95°C for 10 seconds, annealing at 60°C for 10 seconds, and extension at 72°C for 10 seconds for 45 cycles. The 18S rRNA was used as a housekeeping normalization standard for quantification of mRNA levels HO-1, FPN, IKBα, p21, RNR2, and SAMHD1. Primer sequences were as follows: FPN, forward CCAAAGGGATTGGATTGTTG, reverse AAATAAAGCCACAGCCGATG; RNR2, forward CGATGGTGCAGCCGCTATTA, reverse ATCATTTACGGGGGAAGGCG; HO-1, forward CTTCTTCACCTTCCCCAACA, reverse AGCTCCTGCAACTCCTCAAA; IKBα, forward GCCTGGACTCCATGAAAGAC, reverse GTCTGCTGCAGGTTGTTCTG; p21, forward GGAAGACCATGTGGACCTGT, reverse GGATTAGGGCTTCCTCTTGG; SAMHD1, forward GAGGTTGCCAGTGCTAAACC, reverse TCTGTTGGGGGCAGTCTTAC; and 18SrRNA, forward CTGTTGCTACATCGACCTTT, reverse CTCCAGGTTTTGCAACCAGT.
Determination of HIV-1 RNA and DNA levels
Quantitative analysis of HIV-1 RNA and DNA was conducted as previously described.17
Flow cytometry
Activated PBMCs (1 × 10⁶ cells) were fixed for 5 minutes at room temperature in 4% paraformaldehyde and then permeabilized for 15 minutes in Cytofix/Cytoperm buffer (catalog #554714; BD Pharmingen, San Diego, CA). Cells were stained with p24-linked to fluorescein isothiocyanate (FITC-A) antibodies (catalog #6604665; Beckman Coulter Life Sciences, Indianapolis, IN) for 1 hour at 4°C in the dark. After staining, the cells were washed and analyzed in BD FACSCalibur (BD Biosciences, San Jose, CA) using FlowJo software (Ashland, OR).
Small molecule inhibitor(s) of HO-1
The stock solution of the HO-1 inhibitor tin protoporphyrin (Frontier Specialty Chemicals, Logan, UT) was prepared in 0.2 N NaOH and adjusted to pH 7.4 by using 1 N HCl. HIV-1 (IIIB)–infected control and SCT PBMCs were incubated with tin protoporphyrin 4 days’ postinfection. Total RNA was then isolated and analyzed for gag RNA expression by real-time PCR as described earlier.
Custom-designed restriction factor array
Relative quantification of 42 restriction factors was performed by using a custom-made TaqMan Low Density Array (Applied Biosystems, Foster City, CA) that has been described previously.18 Thermal cycling was performed by using a ViiA7 Real-Time PCR System (Thermo Fisher Scientific). A panel of 6 housekeeping genes (GAPDH, 18S rRNA, ACTB, PP1A, RPLP0, and UBC) was included in the TaqMan Low Density Array plates, of which GAPDH was identified as the most stably expressed among all samples analyzed by using the geNorm algorithm.19 Raw cycle threshold numbers of amplified gene products were therefore normalized to GAPDH. Cumulative restriction factor expression scores were calculated as the sum expression of all restriction factors of an individual, as previously described.20
Statistical analysis for experimental data
All graphs were prepared by using GraphPad Prism 6 software (La Jolla, CA). Data are presented as mean ± standard deviation or standard error of the mean as indicated in the figure legends. Continuous variables were transformed to normal distribution if required. Means were compared with Student t tests, and P < .05 was defined as a statistically significant change. SCT (HbAS) frequency was tested between HIV-uninfected and people living with HIV (PLWH) groups using OR (95% CI). Repeated data, including viral load and CD4 and CD8 counts, were analyzed by using mixed effect linear models (using random intercept). In each model, the β for HbAS (ie, mean difference from non-SCT individuals [HbAA]), time, and interaction between time and genotype was calculated. The interaction β is an estimate of effect of HbAS on rate of biomarker change during the study duration.
Results
Inhibition of ex vivo HIV-1 infection in SCT
Because SCT erythrocytes are prone to sickling, we hypothesized that SCT can partially recapitulate the protective effect of SCD from HIV-1 infection. PBMCs were infected with HIV-1-LUC-G (see details in the Methods), and ∼25% reduction of luciferase activity was observed for HIV-1–infected SCT PBMCs (Figure 1A). We next tested infection of SCT PBMCs with T-tropic HIV-1 IIIB. Lower levels of HIV-1 p24 (∼50% reduction) were observed in infected SCT PBMCs compared with the infected control PBMCs (Figure 1B) as measured by enzyme-linked immunosorbent assay in culture media. Levels of HIV-1 gag RNA were also significantly reduced in the infected SCT PBMCs compared with the infected control PBMCs (Figure 1C). We also detected fewer HIV-1–infected cells expressing intracellular p24, which was measured in the infected PBMCs by using flow cytometry (Figure 1D). To elucidate steps of HIV-1 replication that were affected in SCT PBMCs, early and late RT, 2-LTR circles, and HIV-1 integration were analyzed by quantifying HIV-1 DNA.21 We observed a marked 2.5-fold inhibition of late LTR sequence production in HIV-1–infected SCT PBMCs (P = .03) and twofold inhibition of 2-LTR circles (P = .05) and HIV-1 DNA integration (P = .005) (Figure 1E). In contrast, there were no statistically significant changes in early LTR (P = .1).
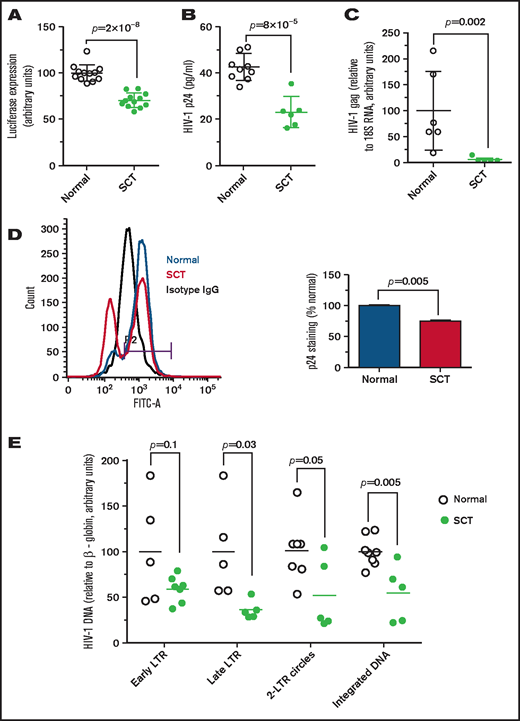
Inhibition of HIV-1 in SCT PBMCs. (A) One round of infection with HIV-1-LUC-G virus expressing luciferase. PBMCs were purified from whole blood obtained from individuals with SCT and HbAA control subjects. The cells were treated with phytohemagglutinin and interleukin-2 to activate T cells. PBMCs (12 HbAA, 33% female; 12 HbAS, 83% female) were infected with HIV-1-LUC-G virus expressing luciferase. Luciferase activity was measured at 48 hours’ postinfection. The results are expressed relative to the infection of PBMCs from control subjects, which was set to 100%. Data are shown as mean ± standard deviation. (B-C) HIV-1 (IIIB) replication is repressed in SCT PBMCs. PBMCs were purified and activated as described earlier and infected by HIV-1 (IIIB). Samples were collected at 4 days’ postinfection. Supernatants were collected, and p24 levels were measured by using an enzyme-linked immunosorbent assay (panel B, 8 HbAA, 37.5% female; 6 HbAS, 66.7% female). Cells were collected and RNA was extracted, reverse transcribed, and analyzed with primers for HIV-1 gag gene by real-time PCR using 18S RNA as a reference (panel C, 6 HbAA, 33.3% female; 5 HbAS, 60% female). Data are shown as mean ± standard deviation. (D) Reduction of intracellular HIV-1 p24 in SCT PBMCs. Intracellular p24 levels in PBMCs infected with HIV-1 IIIB were measured by using flow cytometry. A representative histogram shows isotype antibody linked to fluorescein isothiocyanate (FITC-A) staining (black), and p24-FITC-A staining of the infected control PBMCs (blue) and SCT PBMCs (red). Bar graph shows percentage of infected cells ± standard deviation (n = 2 per group, 50% female). (E) Analysis of HIV-1 replication stages in SCT PBMCs. PBMCs purified and activated as described earlier (8 HbAA, 37.5% female; 8 HbAS, 75% female) were infected with HIV-1-LUC-G virus and collected at 14 hours’ postinfection. DNA was extracted and analyzed by real-time PCR on a Roche 4800 using primers for early LTR, late LTR, 2-LTR circles, and integrated viral DNA. β-globin gene was used as a reference. The results show HIV-1 DNA levels in SCT PBMCs relative to control PBMCs.
Inhibition of HIV-1 in SCT PBMCs. (A) One round of infection with HIV-1-LUC-G virus expressing luciferase. PBMCs were purified from whole blood obtained from individuals with SCT and HbAA control subjects. The cells were treated with phytohemagglutinin and interleukin-2 to activate T cells. PBMCs (12 HbAA, 33% female; 12 HbAS, 83% female) were infected with HIV-1-LUC-G virus expressing luciferase. Luciferase activity was measured at 48 hours’ postinfection. The results are expressed relative to the infection of PBMCs from control subjects, which was set to 100%. Data are shown as mean ± standard deviation. (B-C) HIV-1 (IIIB) replication is repressed in SCT PBMCs. PBMCs were purified and activated as described earlier and infected by HIV-1 (IIIB). Samples were collected at 4 days’ postinfection. Supernatants were collected, and p24 levels were measured by using an enzyme-linked immunosorbent assay (panel B, 8 HbAA, 37.5% female; 6 HbAS, 66.7% female). Cells were collected and RNA was extracted, reverse transcribed, and analyzed with primers for HIV-1 gag gene by real-time PCR using 18S RNA as a reference (panel C, 6 HbAA, 33.3% female; 5 HbAS, 60% female). Data are shown as mean ± standard deviation. (D) Reduction of intracellular HIV-1 p24 in SCT PBMCs. Intracellular p24 levels in PBMCs infected with HIV-1 IIIB were measured by using flow cytometry. A representative histogram shows isotype antibody linked to fluorescein isothiocyanate (FITC-A) staining (black), and p24-FITC-A staining of the infected control PBMCs (blue) and SCT PBMCs (red). Bar graph shows percentage of infected cells ± standard deviation (n = 2 per group, 50% female). (E) Analysis of HIV-1 replication stages in SCT PBMCs. PBMCs purified and activated as described earlier (8 HbAA, 37.5% female; 8 HbAS, 75% female) were infected with HIV-1-LUC-G virus and collected at 14 hours’ postinfection. DNA was extracted and analyzed by real-time PCR on a Roche 4800 using primers for early LTR, late LTR, 2-LTR circles, and integrated viral DNA. β-globin gene was used as a reference. The results show HIV-1 DNA levels in SCT PBMCs relative to control PBMCs.
Upregulation of heme and iron regulatory and antiviral genes in SCT PMBCs
To identify a potential host HIV-1 restriction factor(s), we tested expression of the selected HIV-1 regulatory genes that we previously reported as being upregulated in SCD PBMCs,7 including HO-1, IKBα, p21, FPN, and SAMHD1. Protein levels of HO-1 were increased (Figure 2A), whereas the levels of IKBα, p21, and FPN were not changed (Figure 2B-D). In agreement with no changes in FPN levels, there was no change in SAMHD1 protein level or SAMHD1 phosphorylation levels (supplemental Figure 1A). In addition, no significant inhibition of CDK2 activity was detected (supplemental Figure 1B), in contrast to SCD PBCMs, in which CDK2 inhibition was attributed to the decreased SAMHD1 phosphorylation. To expand the analysis of anti–HIV-1 host restriction factors expressed in SCT PBMCs, mRNA expression of the selected 42 HIV-1 restriction factors was tested by using a customized array. No significant increase was observed in any of the tested factors (supplemental Figure 2). We observed decreased expression of apolipoprotein B mRNA editing enzyme catalytic polypeptide-like (APOBEC)3F, APOBEC3H, interferon-induced transmembrane protein 2 (IFITM2), SAMHD1, and tripartite motif-containing protein 5 α (TRIM5α). Because these data did not explain the reduction in HIV-1 RT, we analyzed expression of RNR2, which is known to be affected by intracellular iron levels and has an effect on HIV-1 RT. Protein levels of RNR2 were significantly reduced (approximately threefold) in SCT PBMCs (Figure 2E). Taken together, upregulation of HO-1 expression and decreased RNR2 expression were noted in SCT PBMCs.
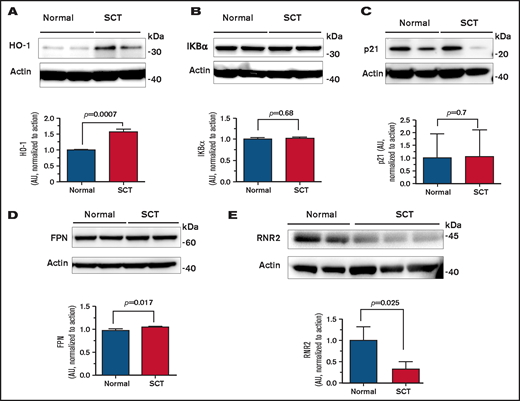
Expression of HO-1, IKBα, p21, FPN, and RNR2 in SCT PBMCs. Cell lysates from activated PBMCs obtained from individuals with SCT and normal control subjects were resolved on 4% to 12% Bis-Tris gel and probed with antibodies against HO-1 (A), IKBα (B), p21 (C), FPN (D), and RNR2 (E). β-actin was used as loading control. Results were quantified by using ImageQuant Software (Cytiva, Marlborough, MA). Bars represent 2 independent experiments. The blots show 2 representative SCT and control samples (except RNR2, where 3 SCT samples are shown). Total number of samples analyzed and quantified were 4 HbAA (50% female) and 4 HbAS (75% female) (panels A-D) and 4 HbAA (25% female) and 4 HbAS (100% female) (panel E). Data are shown as mean ± standard deviation. P values were calculated by using the Student t test.
Expression of HO-1, IKBα, p21, FPN, and RNR2 in SCT PBMCs. Cell lysates from activated PBMCs obtained from individuals with SCT and normal control subjects were resolved on 4% to 12% Bis-Tris gel and probed with antibodies against HO-1 (A), IKBα (B), p21 (C), FPN (D), and RNR2 (E). β-actin was used as loading control. Results were quantified by using ImageQuant Software (Cytiva, Marlborough, MA). Bars represent 2 independent experiments. The blots show 2 representative SCT and control samples (except RNR2, where 3 SCT samples are shown). Total number of samples analyzed and quantified were 4 HbAA (50% female) and 4 HbAS (75% female) (panels A-D) and 4 HbAA (25% female) and 4 HbAS (100% female) (panel E). Data are shown as mean ± standard deviation. P values were calculated by using the Student t test.
Competitive enzymatic HO-1 inhibitor reverses HIV-1 inhibition in SCT PMBCs
We next focused on HO-1 to confirm its contribution for HIV-1 restriction in SCT PBMCs. HO-1 levels were further analyzed by using enzyme-linked immunosorbent assay, which revealed HO-1 upregulation in SCT PBMCs (Figure 3A). Levels of HO-1 mRNA were also significantly increased in SCT PBMCs (Figure 3B). We next tested the effect of a HO-1 small molecule inhibitor, snIX, on HIV-1 inhibition in SCT PBMCs. Treatment with snIX increased HIV-1 IIIB replication in SCT PBMCs as determined by p24 production (P = .0003), but it did not significantly change p24 levels in control PBMCs (P = .11) (Figure 3C). Treatment with snIX also increased HIV-1 gag RNA expression (Figure 3D). Ectopic expression of HO-1 from a reporter plasmid in 293T cells (Figure 3E) led to a dose-dependent inhibition of 1 round of HIV-1 infection with HIV-1-LUC-G (Figure 3F). Addition of snIX restored HIV-1 replication without having an effect on HO-1 expression. This observation further confirmed that HO-1 expression was inhibitory for HIV-1. Thus, snIX reversal of HIV-1 inhibition in SCT PBMCs and HO-1 expression in cultured cells further confirmed that HO-1 contributed to HIV-1 restriction in SCT PBMCs.
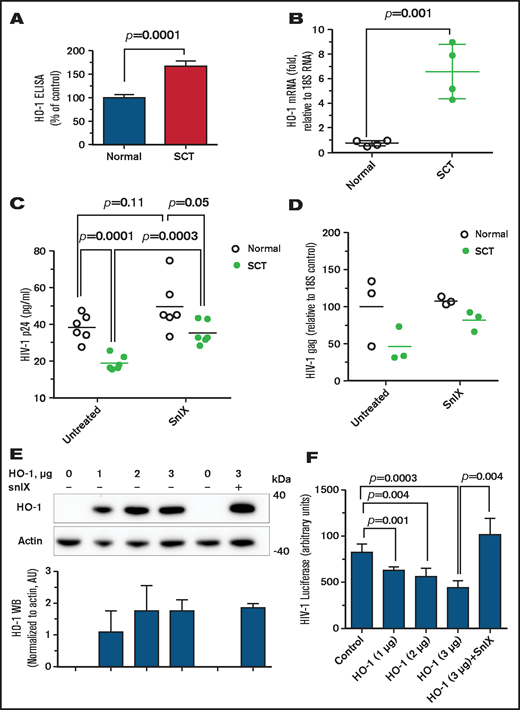
Elevated expression of HO-1 is critical for HIV-1 inhibition. (A) Upregulated HO-1 levels in SCT PBMCs. PBMCs (4 HbAA, 24% female; 4 HbAS, 100% female) were lysed, and HO-1 expression was measured in lysates by using an enzyme-linked immunosorbent assay (ELISA) from 4 control and 4 SCT PBMCs. (B) Upregulated HO-1 mRNA levels in SCT PBMCs. RNA expression of HO-1 was analyzed from 4 HbAA (50% female) and 4 SCT (75% female) PBMCs. RNA was isolated by TRIzol, reverse transcribed, and analyzed by real time PCR. Primers for 18S rRNA were used as a reference for ΔΔCt analysis. (C and D) Small molecule inhibitors of HO-1 reversed HIV-1 inhibition in SCT PBMCs. SCT PBMCs were purified and activated with phytohemagglutinin and interleukin-2 and treated with 2 μM snIX before the infection with HIV-1 (IIIB). Samples were collected 4 days’ postinfection. Supernatants were used to measure p24 by using an ELISA (panel C, 6 HbAA, 50% female; 6 HbAS, 66.7% female). Cells were collected and RNA was extracted, reverse transcribed, and analyzed with primers for HIV-1 gag gene by real-time PCR using 18S RNA as a reference (panel D, 3 HbAA, 66.6% female; 3 HbAS, 66.6% female). Data are shown as means. P values were calculated by using the Student t test. (E-F) Expression of HO-1 inhibits HIV-1. In panel E, 293T cells were transfected with the indicated amounts of HO-1–expressing vector. Cell lysates were resolved on 4% to 12% Bis-Tris gel and probed by Western blotting (WB) with antibodies against c-myc and β-actin as loading control. Results were quantified by using ImageQuant Software. Bars represent quantification from 3 independent WB experiments. Data are shown as mean ± standard deviation. In panel F, HO-1–expressing cells were further infected with HIV-1-LUC-G, and luciferase activity was measured 2 days’ postinfection. Plasmid amounts are shown in calculation for a 6-well plate to be comparable with panel E. Data are shown as mean ± standard deviation (n = 3 for each sample). P values were calculated by using the Student t test.
Elevated expression of HO-1 is critical for HIV-1 inhibition. (A) Upregulated HO-1 levels in SCT PBMCs. PBMCs (4 HbAA, 24% female; 4 HbAS, 100% female) were lysed, and HO-1 expression was measured in lysates by using an enzyme-linked immunosorbent assay (ELISA) from 4 control and 4 SCT PBMCs. (B) Upregulated HO-1 mRNA levels in SCT PBMCs. RNA expression of HO-1 was analyzed from 4 HbAA (50% female) and 4 SCT (75% female) PBMCs. RNA was isolated by TRIzol, reverse transcribed, and analyzed by real time PCR. Primers for 18S rRNA were used as a reference for ΔΔCt analysis. (C and D) Small molecule inhibitors of HO-1 reversed HIV-1 inhibition in SCT PBMCs. SCT PBMCs were purified and activated with phytohemagglutinin and interleukin-2 and treated with 2 μM snIX before the infection with HIV-1 (IIIB). Samples were collected 4 days’ postinfection. Supernatants were used to measure p24 by using an ELISA (panel C, 6 HbAA, 50% female; 6 HbAS, 66.7% female). Cells were collected and RNA was extracted, reverse transcribed, and analyzed with primers for HIV-1 gag gene by real-time PCR using 18S RNA as a reference (panel D, 3 HbAA, 66.6% female; 3 HbAS, 66.6% female). Data are shown as means. P values were calculated by using the Student t test. (E-F) Expression of HO-1 inhibits HIV-1. In panel E, 293T cells were transfected with the indicated amounts of HO-1–expressing vector. Cell lysates were resolved on 4% to 12% Bis-Tris gel and probed by Western blotting (WB) with antibodies against c-myc and β-actin as loading control. Results were quantified by using ImageQuant Software. Bars represent quantification from 3 independent WB experiments. Data are shown as mean ± standard deviation. In panel F, HO-1–expressing cells were further infected with HIV-1-LUC-G, and luciferase activity was measured 2 days’ postinfection. Plasmid amounts are shown in calculation for a 6-well plate to be comparable with panel E. Data are shown as mean ± standard deviation (n = 3 for each sample). P values were calculated by using the Student t test.
HIV-1 inhibition in PBMCs obtained from the Howard University cohort of SCT participants with HIV-1 infection
To analyze expression of HIV-1 RNA and antiviral factors in SCT individuals infected with HIV-1, we identified 9 HbAS individuals living with HIV-1 and compared them vs HIV-1+ individuals without SCT among 110 HbAA HIV-1–infected individuals recruited at Howard University CIDMAR and pediatric clinics. Basic characteristics of the study cohort are presented in Table 1. Although Hb levels in these 2 groups were not significantly different, HIV-1 viral load was significantly lower in the HbAS group; levels of HIV-1–associated complications were also reduced. We analyzed expression levels of HIV-1 env among 9 SCT HIV-1+ individuals and compared them vs 12 matching HIV-1+ individuals from the same cohort, who exhibited no statistically significant difference in HIV-1 env expression (Figure 4A).
HIV-1 viral load in SCD trait at Howard University
| Characteristic | AA | AS | P | ||
|---|---|---|---|---|---|
| N | Results | N | Results | ||
| Age, y | 110 | 34 (19-47) | 9 | 54 (41-55) | .009 |
| Female sex | 110 | 77 (70%) | 9 | 5 (56%) | .37 |
| HIV related complication | 110 | 29 (26%) | 9 | 0 | .08 |
| Duration of disease, y | 108 | 12 (5-17) | 9 | 13 (9-16) | .4 |
| HIV medication | 110 | 103 (94%) | 9 | 9 (100%) | .4 |
| Hb | 94 | 12.6 (11.6-13.5) | 9 | 12.9 (10.9-13.4) | >.9 |
| Platelet | 94 | 255 (206-311) | 9 | 247 (198-270) | .8 |
| WBC | 94 | 5.3 (4.0-7.0) | 9 | 4.7 (4.3-5.2) | .5 |
| CD4 counts | 91 | 525 (272-770) | 9 | 498 (329-595) | .6 |
| First CD8 counts | 91 | 888 (682-1399) | 9 | 599 (482-886) | .08 |
| Viral load* | 87 | 220 (20-8350) | 7 | 20 (20-20) | <.0001† |
| Mean viral load | 103 | 647 (20-12 530) | 9 | 20 (20-20) | .031‡ |
Results are median (interquartile range) unless otherwise indicated.
Viral load of 20 was assigned to all samples with a viral load ≤100.
Age and medication adjusted P < .0001.
Age and medication adjusted P = .11.
![Elevated levels of HO-1, SAMHD1, and RNR2 in PBMCs from SCT individuals with HIV-1. (A-G) RNA was extracted from buffy coats obtained from HIV-1–positive HbAS and HbAA individuals. RNA was reverse transcribed and analyzed by real-time PCR using 18S RNA as a reference for ΔΔCt analysis for HIV-1 env (panel A, 9 HbAS [55.6% female] and 12 HbAA [66.7% female]), HO-1 mRNA (panel B, 8 HbAA [75% female] and 9 HbAS [55.6% female]), SAMHD1 mRNA (panel C, 8 HbAA [75% female] and 6 HbAS [50% female]), RNR2 mRNA (panel D, 8 HbAA [75% female] and 6 HbAS [50% female]), IKBα mRNA (panel E, 8 HbAA [75% female] and 9 HbAS [55.6% female]), FPN mRNA (panel F, 8 HbAA [75% female] and 9 HbAS [55.6% female]), and p21 mRNA (panel G, 8 HbAA [75% female] and 9 HbAS [55.6% female]). Data are shown as mean ± standard deviation. P values were calculated by using the Student t test.](https://ash.silverchair-cdn.com/ash/content_public/journal/bloodadvances/5/23/10.1182_bloodadvances.2021004247/2/m_advancesadv2021004247f4.png?Expires=1769082495&Signature=xseEyJk88Lrhw5IhCmD6ykcRv2y-VI8UK56NLzxctC5-B6blteGTnxCjaFsAsAv2iTPEF2qE6up9ZmvXoqLtLD~5Qcz48UJURmF-UvbSzwwsxWYai5pcJcVcgx177U0H-2RveMrLOgQQv~Auw3PDm-sNkqan7hhaVvqbKIBLxmT3vpAMj4-k8XzcDLidleEQX75Q9ZdvCX~eat77Va4RZ2DKRIrGzURLoRm8bTyxwTTOBo3uh~SsOA2wR5ZWfviS5yaOtiIsO7XXhsVCnBULP6bYvaODUkgoehW3stXJ-dzew6L~tbE6u-ExdP~A0k2bgDECwCa2-waLr79DFOWKEg__&Key-Pair-Id=APKAIE5G5CRDK6RD3PGA)
Elevated levels of HO-1, SAMHD1, and RNR2 in PBMCs from SCT individuals with HIV-1. (A-G) RNA was extracted from buffy coats obtained from HIV-1–positive HbAS and HbAA individuals. RNA was reverse transcribed and analyzed by real-time PCR using 18S RNA as a reference for ΔΔCt analysis for HIV-1 env (panel A, 9 HbAS [55.6% female] and 12 HbAA [66.7% female]), HO-1 mRNA (panel B, 8 HbAA [75% female] and 9 HbAS [55.6% female]), SAMHD1 mRNA (panel C, 8 HbAA [75% female] and 6 HbAS [50% female]), RNR2 mRNA (panel D, 8 HbAA [75% female] and 6 HbAS [50% female]), IKBα mRNA (panel E, 8 HbAA [75% female] and 9 HbAS [55.6% female]), FPN mRNA (panel F, 8 HbAA [75% female] and 9 HbAS [55.6% female]), and p21 mRNA (panel G, 8 HbAA [75% female] and 9 HbAS [55.6% female]). Data are shown as mean ± standard deviation. P values were calculated by using the Student t test.
Elevated levels of HO-1, SAMHD1, and RNR2 in PBMCs from SCT individuals with HIV-1. (A-G) RNA was extracted from buffy coats obtained from HIV-1–positive HbAS and HbAA individuals. RNA was reverse transcribed and analyzed by real-time PCR using 18S RNA as a reference for ΔΔCt analysis for HIV-1 env (panel A, 9 HbAS [55.6% female] and 12 HbAA [66.7% female]), HO-1 mRNA (panel B, 8 HbAA [75% female] and 9 HbAS [55.6% female]), SAMHD1 mRNA (panel C, 8 HbAA [75% female] and 6 HbAS [50% female]), RNR2 mRNA (panel D, 8 HbAA [75% female] and 6 HbAS [50% female]), IKBα mRNA (panel E, 8 HbAA [75% female] and 9 HbAS [55.6% female]), FPN mRNA (panel F, 8 HbAA [75% female] and 9 HbAS [55.6% female]), and p21 mRNA (panel G, 8 HbAA [75% female] and 9 HbAS [55.6% female]). Data are shown as mean ± standard deviation. P values were calculated by using the Student t test.
We next analyzed mRNA expression of HO-1, SAMHD1, RNR2, IKBα, FPN, and p21. A significant upregulation of HO-1, SAMHD1, and RNR2 was observed (Figure 4B-D), but no statistically significant differences were detected in the expression of IKBα, FPN, or p21 (Figure 4E-G). Although this analysis was limited to only 9 patients, it provided evidence of increased HO-1 expression in SCT PBMCs obtained from individuals living with HIV-1.
Prevalence of SCT in HIV-1–infected participants in the WIHS cohort
To further analyze HIV-1 infection among individuals with SCT, we accessed a cohort of women living with HIV-1 (WIHS). A PCR-based assay with DdeI restriction digestion was used to genotype 744 of self-reported non-Hispanic Black study participants, of whom 483 were HIV-1 infected and 261 were noninfected (Table 2). The mean ± standard deviation baseline age of those who were HIV-1 infected was 38 ± 8.7 years vs 37 ± 9.7 years in noninfected subjects. The prevalence of SCT (HbAS) was determined to be 14.8% in noninfected participants and 8.7% in HIV-1–infected participants (age-adjusted OR, 0.57; 95% CI, 0.36-0.92; P = .020). We also analyzed ORs for Hispanic and non-Hispanic Black subjects (n = 777; OR, 0.55; 95% CI, 0.35-0.87; P = .011), which also revealed a lower odds of SCT among HIV-1–infected participants. In adjusted analyses for antiretroviral therapy, although HIV viral load showed no statistical difference (P = .66) (Figure 5A), a mixed effect model analysis in non-Hispanic subjects indicated that SCT participants had higher CD4/CD8 ratios that increased during the 20 years’ follow-up (P = .003 for interaction between AS and duration of follow-up) (Table 3; Figure 5B), suggesting milder disease progression compared with control subjects.
Prevalence of HIV-1 infection in WIHS cohort of African-American women with SCT
| Genotype | HIV-1 | Total | |
|---|---|---|---|
| Negative | Positive | ||
| AA | 224 (85.8%) | 441 (91.3%) | 665 (89.4%) |
| AS | 37 (14.2%) | 42 (8.7%) | 79 (10.6%) |
| Total | 261 | 483 | 744 |
| Genotype | HIV-1 | Total | |
|---|---|---|---|
| Negative | Positive | ||
| AA | 224 (85.8%) | 441 (91.3%) | 665 (89.4%) |
| AS | 37 (14.2%) | 42 (8.7%) | 79 (10.6%) |
| Total | 261 | 483 | 744 |
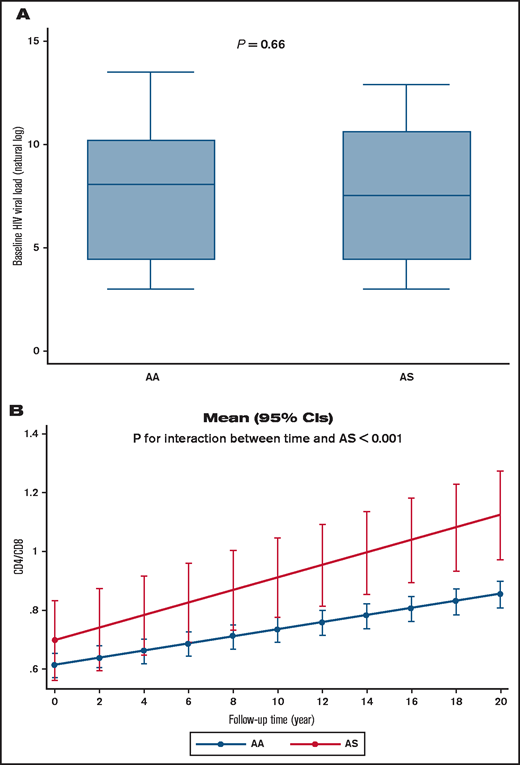
Viral load and CD4/CD8 ratios in HIV-1+ SCT WIHS participants. (A) Viral load according to Hb status in non-Hispanic Black WIHS study participants. (B) CD4/CD8 ratio change during study follow-up according to Hb status in non-Hispanic Black WIHS study participants. Mean (95% CI) was calculated by using marginal postestimation of a mixed effect model adjusted for antiretroviral therapy status.
Viral load and CD4/CD8 ratios in HIV-1+ SCT WIHS participants. (A) Viral load according to Hb status in non-Hispanic Black WIHS study participants. (B) CD4/CD8 ratio change during study follow-up according to Hb status in non-Hispanic Black WIHS study participants. Mean (95% CI) was calculated by using marginal postestimation of a mixed effect model adjusted for antiretroviral therapy status.
SCT (AS) in WIHS is associated with increase in CD4 and decrease in CD8 over time
| Variable | Effect at baseline visit | Effect on change during follow-up | ||
|---|---|---|---|---|
| β (95%CI) | P | β (95%CI) | P | |
| Viral load (natural log)* | ||||
| AS | −0.29 (–1.12 to 0.54) | .50 | −0.02 (–0.07 to 0.03) | .43 |
| Time from baseline visit, y | −0.11 (–0.14 to −0.08) | <.001 | NA | NA |
| CD4 (square root)† | ||||
| AS | 3.12 (0.92 to 5.41) | .006 | −0.12 (−0.22 to −0.01) | .036 |
| Time from baseline visit, mo | 0.14 (0.10-0.17) | <.001 | NA | NA |
| CD8 (square root)‡ | ||||
| AS | 0.06 (–1.94 to 2.06) | .95 | −0.24 (–0.32 to −0.15) | <.001 |
| Time from baseline visit, mo | −0.06 (–0.09 to −0.03) | <.001 | NA | NA |
| CD4/CD8§ | ||||
| AS | 0.05 (–0.10 to 0.19) | .53 | 0.009 (0.005 to 0.014) | <.001 |
| Time from baseline visit, mo | 0.012 (0.011 to 0.013) | <.001 | NA | NA |
Results were calculated from a mixed effect model (with random coefficient for each study subject). Interaction between AS and duration was reported as effect on change during follow-up.
Variables in model: nucleoside reverse-transcriptase inhibitors (NRTI), non-nucleoside reverse transcriptase inhibitors (NNRTI), protease inhibitor (PI), age at visit, any drug, and interaction of genotype with PI.
Variables in model: NRTI, NNRTI, PI, any drug, and interaction of genotype with NRTI.
Variables in model: NNRTI and PI.
Variables in model: NRTI, NNRTI, and interaction of genotype with NNRTI.
Discussion
Here, we showed that ex vivo HIV-1 replication is moderately suppressed in SCT PBMCs, and this suppression occurs at several stages of the HIV-1 life cycle, including RT, integration, and transcription. This observation parallels our previous findings of ex vivo HIV-1 restriction in SCD PBMCs except that HIV-1 inhibition in SCD PBMCs was much more pronounced (more than threefold).7 Similar to what we observed in SCD PBMCs, HIV-1 inhibition was observed at early and late steps of HIV-1 replication, including RT and transcription. In SCD PBMCs, FPN expression was elevated, levels of intracellular iron were reduced, and activity of CDK2 was suppressed, explaining the decreased SAMHD1 phosphorylation, which is mediated in part by CDK2. In contrast, FPN levels in SCT PBMCs were not changed, CDK2 activity was not suppressed, and SAMHD1 phosphorylation was not altered. Analysis of additional factors that might contribute to HIV-1 suppression point to HO-1 and RNR2.
HO-1 plays an important role in iron recycling by macrophages. Aged red blood cells are consumed by macrophages and degraded in their phagolysosomes, releasing heme into the cytoplasm, where it activates transcription of several genes, including HO-1.22 HO-1 degrades heme to release carbon monoxide, biliverdin, and iron. Activation of HO-1 and production of carbon monoxide was proposed to protect against cerebral malaria23 and might confer the survival advantage of SCT in endemic malarial areas of Africa.24,25 Induction of HO-1 by hemin leads to the inhibition of HIV-1 infection, although the detailed mechanism was not further clarified.10 RNR2 controls production of intracellular deoxyribonucleotide (dNTP), and its downregulation in p21-expressing macrophages was shown to reduce dNTPs and block HIV-1 RT.26 This dNTP reduction was independent from SAMHD1 and involved repression of E2F1 transcription factor that is needed for RNR2 transcription.
In the current study, increased HO-1 levels were observed in SCT PBCMs, suggesting its role in the inhibition of HIV-1 replication. Involvement of HO-1 was further confirmed with the use of snIX, an inhibitor of HO-1 that reversed HIV-1 inhibition and overexpression of HO-1 in cultured cells that inhibited HIV-1. The finding of elevated HO-1 levels is indicative of hemolysis in individuals with SCT. Our observations suggest that hemolytic conditions in SCT might contribute to HIV-1 inhibition in SCT. The decreased RNR2 levels that we observed in this study suggest inhibition of RT, in accord with our observation of reduced late LTR production.
We confirmed our in vitro findings by analyzing PBMCs from PLWH with SCT recruited at the Howard University CIDMAR clinic, in which we observed increased levels of HO-1 mRNA. We also observed increased mRNA levels of SAMHD1 and RNR2 but not FPN, p21, or IKBα. These observations indicate that HIV-1 infection in vivo in SCT individuals living with HIV-1 could be inhibited through additional mechanisms that may include SAMHD1 upregulation. Interestingly, we had previously observed increased SAMHD1 expression in macrophages and PBMCs treated with hemin,7 suggesting that hemolysis in SCT individuals living with HIV-1 might contribute to the upregulation of SAMHD1, in addition to the upregulation of HO-1. We screened all known HIV-1 restriction factors and found none of these factors to be upregulated, suggesting that HIV-1 restriction in SCT is limited to the upregulation of HO-1 and SAMHD1.
Although participants’ viral load was not detectable in this small Howard University cohort of PLWH with SCT, it was not clear whether SCT offers long-term protection. To test this hypothesis, we analyzed women living with HIV-1 from the WIHS cohort. The WIHS recruitment strategy does not revolve around SCT status, and we would have expected equal proportions of SCT among the women living with HIV and their HIV-uninfected counterparts. Our analysis found that among WIHS participants whose self-reported race/ethnicity was Black, African American, or Hispanic, those with HIV-1 were less likely to have SCT than their HIV-uninfected counterparts. This is an interesting observation that suggests differing susceptibility to HIV infection based on SCT status. However, additional population-based studies are needed to confirm these findings. We observed no differences in HIV viral load among participants with HbAS and HbAA status; however, CD4+/CD8+ ratios were consistently higher among participants with SCT compared with participants with normal Hb levels. Moreover, the difference in CD4/CD8 ratios was increasing over the course of 20 years of the WIHS study. Thus, individuals with SCT seem to have milder disease progression, as reduced CD4/CD8 ratios predict poor outcome.
The major limitation of our study is the sex bias, as we only analyzed women living with HIV-1. There is a possibility that lower frequency of SCT in this cohort might be due to higher morality of SCT who are infected with HIV-1. Future analysis of men living with HIV-1 and African subjects living with HIV-1 is needed.
Although an earlier study in sub-Saharan Africa showed no difference in HIV-1 progression between SCT and HbAA individuals,27 more recent studies showed SCT protection and thus were in line with our observations. A large screening study in Uganda evaluated >150 000 blood samples and determined an OR of 0.5 for having SCT and HIV-1 infection.28 Lower prevalence of SCT (18.8% for SCT vs expected 25%-30% for HbAA) among 208 HIV-1–infected individuals in Nigeria who also had lower viral load (414 for SCT vs 813 for HbAA) suggests a potential protective effect of SCT.6 We observed no difference in viral load in the WIHS cohort, likely because of the antiretroviral therapy and good compliance by the participants. The major clinical value of our study is the antiviral factors and pathways that regulate the interaction between SCD and HIV infection could help us to identify a novel therapeutic direction. HO-1 inhibition can be further tested. Findings of increased HO-1 expression in insulin-resistant HIV-1–infected individuals29 indicate that HO-1 inhibition can also serve to alleviate HIV-1–associated metabolic syndrome.
In conclusion, our comprehensive study showed, for the first time, that HIV-1 is restricted in SCT PBMCs because of the upregulation of hemolytic and antiviral factors, HO-1 and SAMHD1, and downregulation of RNR2. We also showed that in addition to the ex vivo HIV-1 restriction, women living with HIV-1 who have SCT exhibited increased CD4/CD8 ratios, suggesting a better overall immunologic state. Taken together, our findings suggest that mild hemolytic conditions might contribute to the suppression of HIV-1 infection in individuals with SCT.
Acknowledgments
The content is solely the responsibility of the authors and does not necessarily represent the official view of the National Heart, Lung, and Blood Institute, the National Institute of Allergy and Infectious Diseases, the National Institute on Minority Health and Health Disparities, the National Center for Advancing Translational Sciences, the National Institutes of Health, or the Department of Veterans Affairs.
This work was supported by grants from the National Institutes of Health, National Heart, Lung, and Blood Institute (P50-HL118006 and R01-HL125005), the National Institute on Minority Health and Health Disparities (G12-MD007597), and the National Institute of Allergy and Infectious Diseases (UM1-AI26617 , P50-AI150476 and P30-AI087714 [District of Columbia Center for AIDS Reseach]). Data in this manuscript were collected by the WIHS, now the MACS/WIHS Combined Cohort Study (MWCCS). MWCCS (Principal Investigators): Atlanta clinical research center (CRS) (Ighovwerha Ofotokun, Anandi Sheth, and Gina Wingood), U01-HL146241; Baltimore CRS (Todd Brown and Joseph Margolick), U01-HL146201; Bronx CRS (Kathryn Anastos and Anjali Sharma), U01-HL146204; Brooklyn CRS (Deborah Gustafson and Tracey Wilson), U01-HL146202; Data Analysis and Coordination Center (Gypsyamber D’Souza, Stephen Gange, and Elizabeth Golub), U01-HL146193; Chicago-Cook County CRS (Mardge Cohen and Audrey French), U01-HL146245; Connie Wofsy Women’s HIV Study, Northern California CRS (Bradley Aouizerat, Phyllis Tien, and Jennifer Price), U01-HL146242; Metropolitan Washington CRS (Seble Kassaye and Daniel Merenstein), U01-HL146205; Miami CRS (Maria Alcaide, Margaret Fischl, and Deborah Jones), U01-HL146203; UAB-MS CRS (Mirjam-Colette Kempf, Jodie Dionne-Odom, and Deborah Konkle-Parker), U01-HL146192; and UNC CRS (Adaora Adimora), U01-HL146194. The MWCCS is funded primarily by the National Heart, Lung, and Blood Institute, with additional cofunding from the Eunice Kennedy Shriver National Institute of Child Health and Human Development, the National Institute on Aging, the National Institute of Dental and Craniofacial Research, the National Institute of Allergy and Infectious Diseases, the National Institute of Neurological Disorders and Stroke, the National Institute of Mental Health, the National Institute on Drug Abuse, the National Institute of Nursing Research, the National Cancer Institute, the National Institute on Alcohol Abuse and Alcoholism, the National Institute on Deafness and Other Communication Disorders, the National Institute of Diabetes and Digestive and Kidney Diseases, and the National Institute on Minority Health and Health Disparities, and in coordination and alignment with the research priorities of the National Institutes of Health, Office of AIDS Research. MWCCS data collection is also supported by UL1-TR000004(University of California at San Francisco Clinical and Translational Science Institute), P30-AI050409 (Atlanta Center for AIDS Research), P30-AI050410 (University of North Carolina Center for AIDS Research), and P30-AI027767 (University of Alabama at Biminghem Center for AIDS Research).
Authorship
Contribution: N.K. designed experiments, analyzed data, and participated in manuscript writing; M.N. analyzed clinical data and participated in manuscript writing; H.L., N.A., A.A., S.W., T.A., and M.d.M.R. performed experiments and analyzed the data; J.K., S.D., P.E.H., S.R., K.A., J.L., A.L.F., S.G., A.A.A., M.N.W., M.F., M.-C.K., S.K., and J.G.T. enrolled patients and edited the manuscript; D.F.N. analyzed the data and edited the manuscript; and S.N. conceived the idea, designed the project, supervised research, and wrote the manuscript.
Conflict-of-interest disclosure: A.A.A. has received consulting funds from Merck, Gilead, and ViiV; and Merck and Gilead have provided her institution with funding for her research. The remaining authors declare no competing financial interests.
Correspondence: Sergei Nekhai, Center for Sickle Cell Disease, Howard University, 2201 Georgia Ave, NW HUIRB Suite 321D, Washington, DC 20059; e-mail: snekhai@howard.edu.

