

Key Points
ctDNA technology is useful for noninvasive monitoring of lymphoma treated with targeted agents in the clinical trial setting.
An early >2-log reduction of ctDNA levels after 2 treatment cycles was a confirmed threshold for molecular response.

Abstract
To advance the use of circulating tumor DNA (ctDNA) applications, their broad clinical validity must be tested in different treatment settings, including targeted therapies. Using the prespecified longitudinal systematic collection of plasma samples in the phase 1/2a LYM1002 trial (registered on www.clinicaltrials.gov as NCT02329847), we tested the clinical validity of ctDNA for baseline mutation profiling, residual tumor load quantification, and acquisition of resistance mutations in patients with lymphoma treated with ibrutinib+nivolumab. Inclusion criterion for this ancillary biological study was the availability of blood collected at baseline and cycle 3, day 1. Overall, 172 ctDNA samples from 67 patients were analyzed by the LyV4.0 ctDNA Cancer Personalized Profiling Deep Sequencing Assay. Among baseline variants in ctDNA, only TP53 mutations (detected in 25.4% of patients) were associated with shorter progression-free survival; clones harboring baseline TP53 mutations did not disappear during treatment. Molecular response, defined as a >2-log reduction in ctDNA levels after 2 cycles of therapy (28 days), was achieved in 28.6% of patients with relapsed diffuse large B-cell lymphoma who had ≥1 baseline variant and was associated with best response and improved progression-free survival. Clonal evolution occurred frequently during treatment, and 10.3% new mutations were identified after 2 treatment cycles in nonresponders. PLCG2 was the topmost among genes that acquired new mutations. No patients acquired the C481S BTK mutation implicated in resistance to ibrutinib in CLL. Collectively, our results provide the proof of concept that ctDNA is useful for noninvasive monitoring of lymphoma treated with targeted agents in the clinical trial setting.
Introduction
Circulating tumor DNA (ctDNA), a tumor-derived portion of total cell-free DNA (cfDNA) circulating in blood, allows for minimally invasive lymphoma diagnostics, not limited by sampling frequency, tumor accessibility, or the existence of clinically overt disease.1
In mature B-cell tumors, ctDNA technologies have been used for genotyping and disease monitoring.2-9 Qualification of ctDNA can be used to identify pretreatment mutations associated with primary resistance to therapy and for the longitudinal noninvasive detection of resistance mutations acquired during treatment. Quantification of ctDNA measures tumor volume and identifies residual disease after treatment. Persistence of ctDNA detection during curative-intent therapy is proposed as a dynamic prognostic marker of clinical outcome. Given the emerging importance of ctDNA, the implementation of ctDNA technologies to detect genomic variants and residual disease is a priority in the lymphoma research. To advance the use of ctDNA applications, their broad clinical validity must be tested in different treatment settings, including targeted therapies tested in clinical trials.2-4,9,10
The phase 1/2a LYM1002 study (registered on www.clinicaltrials.gov as NCT02329847) investigated the combination of ibrutinib+nivolumab in patients with relapsed lymphoma, including diffuse large B-cell lymphoma (DLBCL), follicular lymphoma (FL), and DLBCL transformed from chronic lymphocytic leukemia (CLL), a complication known as Richter’s syndrome (RS).11
Ibrutinib is a first-in-class oral, once-daily Bruton’s tyrosine kinase (BTK) inhibitor indicated for the treatment of CLL, mantle cell lymphoma (MCL), Waldenström’s macroglobulinemia (WM), marginal zone lymphoma, and graft-versus-host disease.12,13 In vitro studies have identified mutations in genes that are distal to BTK in the B-cell receptor signaling pathway or can activate bypass pathways (eg, CARD11, BIRC3, and TRAF3), as markers of primary resistance to ibrutinib.14,15 Mutations in the BTK and PLCG2 genes have been biologically and clinically validated as the mechanism of acquired resistance to ibrutinib in CLL,16 WM,17 and marginal zone lymphoma.18 For DLBCL and FL, ibrutinib is an investigational therapy. Accordingly, whether patients with DLBCL and FL who progress while receiving ibrutinib therapy exhibit acquired BTK or PLCG2 mutations remains unexplored.
Nivolumab, a fully human immunoglobulin G4 monoclonal antibody that blocks interaction between the programmed death 1 (PD-1) receptor and its ligands PD-L1 and PD-L2, is approved for the treatment of various cancers, including classic Hodgkin lymphoma (HL).19,20 In DLBCL, FL, and RS, nivolumab monotherapy is investigational. As a monotherapy, nivolumab has limited activity in relapsed/refractory FL21 and DLBCL,22 and clinical trial data are lacking on its action in RS.23
The combination of ibrutinib+nivolumab was safe and tolerable and demonstrated antitumor activity in lymphoma patients enrolled in the LYM1002 trial.11 Leveraging the prespecified longitudinal systematic collection of plasma samples in this trial, we aimed to test the clinical validity of a ctDNA technology for pretreatment mutation profiling, on-treatment response monitoring, and acquisition of resistance to therapy in relapsed DLBCL, FL, and RS.
Methods
Patients and LYM1002 study design
In this study, we analyzed blood samples collected from patients enrolled in the LYM1002 phase 1/2a clinical trial.11 The study was conducted in accordance with the Declaration of Helsinki and principles of Good Clinical Practice. An institutional review board approved the study at each participating site, and all patients provided written informed consent. Patients received 560 mg daily oral ibrutinib plus 3 mg/kg intravenous nivolumab every 2 weeks until disease progression or unacceptable toxicity. Additional details are available in the supplemental Materials.
Sample collection and processing
Sample collection and processing complied with recommended procedures. Blood samples were collected from all patients at cycle 1, day 1 before treatment start and at cycle 3, day 1. Whenever available, blood samples collected at the time of disease progression/end of therapy were also included in the analysis. The total volume of plasma for cfDNA extraction aimed at obtaining at least 10 ng of cfDNA corresponding to ∼1000 genome equivalents, to allow a stoichiometric sensitivity for the detection of 0.1% mutated alleles. Germline genomic DNA was isolated from peripheral blood mononuclear cells (DLBCL) and flow-sorted T cells (FL and RS). See the supplemental Materials for additional details.
LyV4.0 CAPP-seq Assay
A Cancer Personalized Profiling by Deep Sequencing (CAPP-seq) ctDNA protocol was used for the study.5,8 Libraries derived from paired germline genomic DNA and cfDNA from the same patient were sequenced simultaneously to avoid batch-related biases. The number of libraries loaded on the sequencer was tailored to obtain a coverage of at least >2000× in >80% of the region of interest. A background error-suppressed approach was used for variant calling.
Germline genomic DNA library preparation started with shearing at least 500 ng of DNA through sonication (Covaris, Woburn, MA) to obtain 150-bp fragments. The cfDNA libraries were then generated with the Kapa Library Preparation Kit (Kapa Biosystems) with at least 10 ng of cfDNA, defined as fragmented DNA with an average size of ∼100 to 200 bp, which was not further fragmented. The regions of interest were enriched using SeqCap EZ Choice Library probes (NimbleGen; Roche Diagnostics, Jakarta, Indonesia). A double-capture protocol optimized the enrichment of the regions of interest. Libraries were sequenced on the NextSeq500 (Illumina, San Diego, CA) instrument by paired-end sequencing (2 × 150-cycle protocol). A total of 24 multiplexed libraries were simultaneously sequenced in each ultradeep experiment.
Sequencing reads in FASTQ format were deduplicated with FastUniq v1.1. The resulting reads were locally aligned to the hg19 human genome assembly by BWA v.0.7.15 software with default settings and then, sorted, indexed, and assembled into an mpileup file by SAMtools v.1.3.1. The aligned reads were processed with mpileup, using the parameters -A -d 10 000 000. Single-nucleotide variations and indels were called in cfDNA vs germline genomic DNA with the somatic function of VarScan2, using the parameters min-coverage 1, -min-coverage-normal 1, -min-coverage-tumor 1, -min-var-freq 0, -min-freq-for-hom 0.75, -somatic-P-value .05, -min-avg-qual 30, -strand-filter 1, and -validation 1. The variant called by VarScan2 were annotated by using the SeattleSeq Annotation 138 tool at the default setting. All the somatic variants affecting coding and noncoding regions were retained in the analysis. To filter out variants below the base-pair resolution background frequencies across the target region, Fisher’s exact test was used to test whether the frequency in cfDNA of the variant called by VarScan2 was significantly higher than that called in the corresponding paired germline DNA, after adjustment for multiple comparisons by the Bonferroni test (multiple comparisons corrected the P threshold corresponding to an α of .05/[size of the target region in base pairs × 4 alleles per position]). To filter out systemic sequencing errors in cfDNA, an in-house database containing all cfDNA background allele frequencies across cfDNA samples from healthy subjects was used. Based on the assumption that all background allele fractions follow a normal distribution, a z-test was used to test whether a given variant in the cfDNA differed significantly in its frequency from typical cfDNA background at the same position in all the healthy subject cfDNA samples, after adjustment for multiple comparisons by Bonferroni test (multiple comparisons corrected P threshold corresponding to an α of .05/[size of the target region in bp × 4 alleles per position]). Variants that did not pass these filters were not considered further. Variants for the resulting candidate mutations and the background error rate were visualized with the Integrative Genomics Viewer.
Cell of origin characterization
The HTG EdgeSeq DLBCL Cell of Origin Assay (HTG Molecular Diagnostics, Tucson, AZ) was performed on RNA from baseline biopsy samples, to determine the cell of origin according to the manufacturer’s instructions.
Statistical analysis
The limit of quantification was calculated as the mean allele frequency of non-SNP variants from “blank” samples plus 10 standard deviations. Progression-free survival (PFS) was defined according to the International Working Group response criteria.24,25 Overall response rate was defined as the proportion of evaluable patients who achieved a complete or partial response and was assessed by investigators using computed tomography according to Lugano Classification.24 Summary statistics for continuous variables included median (interquartile range [IQR]). Categorical data were presented as frequencies and percentages (95% confidence interval [CI]) and compared by Fisher’s exact test. Survival analysis was performed by the Kaplan-Meier method, and comparison of the strata was performed with the log-rank test. The adjusted association between PFS and time-fixed and time-dependent exposure variables, respectively, was estimated by Cox regression and reported as the hazards ratio (HR) and 95% CI. Cox regression included exposure variables showing a univariable association with PFS with a Bonferroni-corrected P < .05 to account for multiple testing. All statistical tests were 2 sided. The analysis was performed with R, version v3.6.3 (http://www.r-project.org).
Results
Clinical series description
In total, 172 cfDNA samples from 67 patients were analyzed (Figure 1; supplemental Table 1). Baseline characteristics, best response, PFS, and overall survival were similar between the biomarker and overall LYM1002 populations (Table 1; supplemental Figure 1).
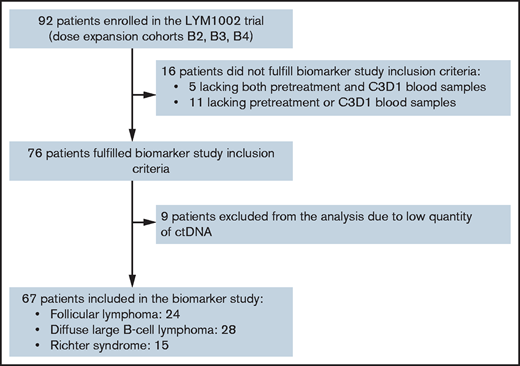
REMARK diagram of study population and patients included in the biomarker study. C3D1, cycle 3, day 1.
REMARK diagram of study population and patients included in the biomarker study. C3D1, cycle 3, day 1.
Baseline characteristics
| FL | DLBCL | RS | |
|---|---|---|---|
| n = 24 | n = 28 | n = 15 | |
| Age, y (range) | 60 (51-69) | 61 (45-71) | 67 (55-70) |
| Male | 16 (66.6) | 19 (67.8) | 7 (46.7) |
| Female | 8 (33.4) | 9 (32.1) | 8 (53.4) |
| ECOG PS | |||
| 0 | 19 (79.2) | 13 (46.5) | 4 (26.6) |
| 1 | 4 (16.6) | 12 (42.8) | 8 (53.4) |
| 2 | 1 (4.2) | 3 (10.7) | 3 (20.0) |
| Lines of treatment (range) | 3 (3-4) | 3 (2-3) | 2 (1-3) |
| Bulky disease (≥5 cm) | 8 (33.3) | 9 (32.1) | 7 (47.6) |
| Cell of origin | |||
| ABC | — | 1 (3.6) | — |
| GCB | — | 14 (50.0) | — |
| Unclassified | — | 3 (10.7) | — |
| Not available | — | 10 (35.7) | — |
Data are n (%) unless otherwise noted.
ABC, activated B-cell–like; ECOG PS, Eastern Cooperative Oncology Group performance status; GCB, germinal center B-cell–like.
Technical validation of the LyV4.0 ctDNA CAPP-seq Assay for genotyping and residual disease quantification
Our LyV4.0 ctDNA CAPP-seq Assay targeted ∼344 kb of genomic space and was designed to cover a variety of different coding genomic regions known to be recurrently mutated in mature B-cell tumors plus coding/noncoding regions targeted by aberrant somatic hypermutation (supplemental Table 2).
To validate the LyV4.0 ctDNA CAPP-seq Assay and its utility for disease detection from ctDNA, we compared in silico the enrichment of somatic mutations by LyV4.0 ctDNA CAPP-seq Assay vs that with whole-genome sequencing (WGS) after simulating mutation detection using data from 288 individual mature B-cell neoplasms (FL, DLBCL, and CLL) profiled by the International Cancer Genome Consortium.26 Although the LyV4.0 ctDNA CAPP-seq Assay covered only 0.01% of the human genome, it captured 8.1% (95% CI, 7.7-8.6) of coding variants and 24.7% (95% CI, 24.4-25.1) of variants affecting spaces that are known targets of aberrant somatic hypermutations (ASHM27 ; supplemental Tables 3 and 4 ). The LyV4.0 ctDNA CAPP-seq Assay captured a median of 2 (IQR, 1-6) coding mutations, yielding a 13-fold increase of variant detection per sample per sequenced base pair vs WGS (supplemental Table 5). The LyV4.0 ctDNA CAPP-seq Assay also captured a median of 15 (IQR 2-56) ASHMs, yielding a 2161-fold increase of variant detection per sample per sequenced base pair vs WGS. For both coding mutations and ASHMs, a slight additional increase in mutation recovery was expected in response to enlarging the probed genomic space over that included in the LyV4.0 ctDNA CAPP-seq Assay (supplemental Figure 2A).
To experimentally quantify the tumor mutation recovery rate of the LyV4.0 ctDNA CAPP-seq Assay, the same genomic space was analyzed in 32 mature B-cell tumors with paired cfDNA and tumor genomic DNA from purified lymphoma cells by flow sorting. We observed a high (98.7%; 95% CI, 95.2-99.9) yield of somatic mutations by LyV4.0 ctDNA CAPP-seq vs sequencing of tumor genomic DNA (supplemental Figure 2B; supplemental Table 6), validating the performance of the LyV4.0 ctDNA CAPP-seq Assay in recovering lymphoma mutations at the wet laboratory level.
When applied to cfDNA samples from 30 patients cured of lymphoma (ie, “blank” samples), the limit of quantification of the LyV4.0 ctDNA CAPP-seq Assay was 0.09%, which represented the analytical background noise threshold over which the assay produced a signal distinguishable from “blank” (supplemental Figure 2C). When cfDNA samples from 3 patients with active lymphoma were diluted in control cfDNA from a healthy donor (limiting dilutions resulting in tumor fractions between 50% and 0.01%), the analytical sensitivity of the LyV4.0 ctDNA CAPP-seq Assay was 0.1%, representing the lowest detectable allele frequency (supplemental Figure 2D).
Prognostic value of pretreatment mutations
A summary of genes affected by nonsynonymous, synonymous, and noncoding somatic mutations in pretreatment ctDNA is shown in Figure 2 (also supplemental Figure 3; supplemental Tables 7 and 8). The germinal center B-cell–like phenotypic subtype was relatively enriched among patients with DLBCL. Accordingly, genes recurrently affected by nonsynonymous somatic mutations in DLBCL were those characterizing the EZB, C3, and ST2 genetic subtypes.28,29 The molecular profiles documented in pretreatment ctDNA from relapsed FL and RS were consistent with previously reported genetic signatures.30,31
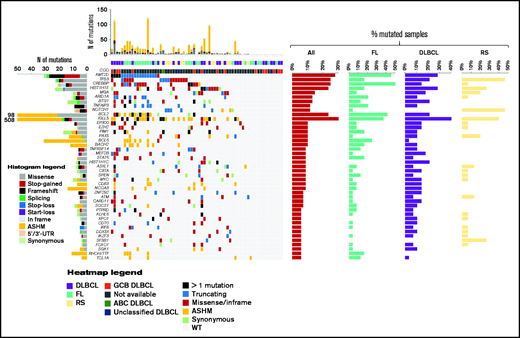
The heat map of genes mutated in ≥10% of cases in pretreatment circulating tumor DNA. Disease histology and cell of origin are color coded and shown below the heat map. In the heat map, each row represents a gene, and each column represents a primary tumor. The heat map is manually clustered to emphasize mutational co-occurrence. The number and type of somatic mutations in any patient are plotted in the histogram above the heat map, and the number and type of somatic mutations in any given gene are plotted in the histogram on the left of the heat map. The horizontal bar graphs on the right of the heat map show the gene mutation frequency in all cases (red bar), in relapsed FL (turquoise bar), in relapsed DLBCL (violet bar), and in RS (yellow bar).
The heat map of genes mutated in ≥10% of cases in pretreatment circulating tumor DNA. Disease histology and cell of origin are color coded and shown below the heat map. In the heat map, each row represents a gene, and each column represents a primary tumor. The heat map is manually clustered to emphasize mutational co-occurrence. The number and type of somatic mutations in any patient are plotted in the histogram above the heat map, and the number and type of somatic mutations in any given gene are plotted in the histogram on the left of the heat map. The horizontal bar graphs on the right of the heat map show the gene mutation frequency in all cases (red bar), in relapsed FL (turquoise bar), in relapsed DLBCL (violet bar), and in RS (yellow bar).
Among genes mutated in ≥5% of pretreatment ctDNA samples, TP53 had the strongest and most consistent prognostic value after adjustment for multiplicity (supplemental Figure 4). TP53 mutations occurred in pretreatment ctDNA of 25.4% (95% CI, 16.4-37.0) of patients with lymphoma, including 16.7% (95% CI, 6.0-36.4) with relapsed FL, 21.4% (95% CI, 9.8-39.8) with relapsed DLBCL, and 46.7% (95% CI, 24.8-69.8) with RS. Overall, patients with TP53 mutations in pretreatment ctDNA experienced significantly shorter PFS vs patients with wild-type TP53 (Figure 3A). With the limitations imposed by the sample sizes, this observation held also when the analysis was stratified according to the disease histology in FL and DLBCL (Figure 3B-C). In RS, patients with wild-type TP53 had a nominal PFS longer than patients with mutated TP53 (Figure 3D). The general poor outcome of RS and the small size of the RS cohort may explain why the difference in PFS was not significant. TP53 mutations in ctDNA were an independent prognostic variable for PFS (HR, 2.81; P = .05) after adjustment for the confounding effects of disease histology and number of previous treatments (supplemental Table 9). In keeping with this clinical observation, clones harboring pretreatment TP53 mutations virtually never disappeared during ibrutinib+nivolumab therapy (Figure 4). These results suggest that neither ibrutinib nor nivolumab can overcome the resistance heralded by TP53 mutations in lymphoma, and they collectively indicate that ctDNA genotyping is an adequate tool for detecting single mutations associated with primary resistance to this combination.
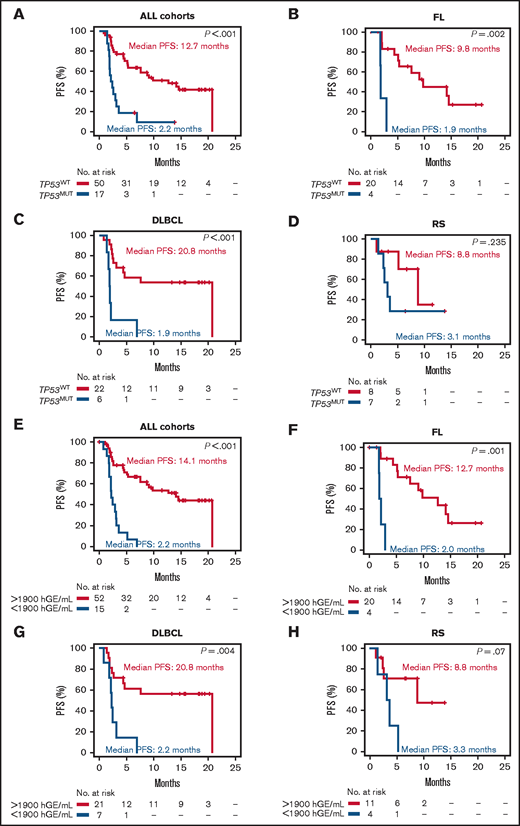
Kaplan-Meier curves of PFS stratified according to the pretreatment TP53 status and pretreatment ctDNA load. All cohorts stratified by TP53 mutation status (A), relapsed FL stratified by TP53 mutation status (B), relapsed DLBCL stratified by TP53 mutation status (C), and RS stratified by TP53 mutation status (D). Red: mutated (MUT); blue: wild-type (WT). All cohorts stratified by ctDNA load measured in haploid genomic equivalents per milliliter of plasma (E), relapsed FL stratified by ctDNA load (F), relapsed DLBCL stratified by ctDNA load (G), and RS stratified by ctDNA load (H). Red: ctDNA load >1900 hGE/mL of plasma; blue: ctDNA load ≤1900 hGE/mL of plasma.
Kaplan-Meier curves of PFS stratified according to the pretreatment TP53 status and pretreatment ctDNA load. All cohorts stratified by TP53 mutation status (A), relapsed FL stratified by TP53 mutation status (B), relapsed DLBCL stratified by TP53 mutation status (C), and RS stratified by TP53 mutation status (D). Red: mutated (MUT); blue: wild-type (WT). All cohorts stratified by ctDNA load measured in haploid genomic equivalents per milliliter of plasma (E), relapsed FL stratified by ctDNA load (F), relapsed DLBCL stratified by ctDNA load (G), and RS stratified by ctDNA load (H). Red: ctDNA load >1900 hGE/mL of plasma; blue: ctDNA load ≤1900 hGE/mL of plasma.

Acquisition of resistance mutations. The ternary plot shows the clonal evolution from pretreatment to cycle 3, day 1 ctDNA in each gene and among all histologies. Only nonresponding/progressing patients were included in the analysis, corresponding to a total of 406 mutations analyzed (nonsynonymous somatic mutations and noncoding mutations affecting regions of ASHMs). Each circle indicates a gene. The genes of interest are labeled. The size of each circle is proportional to the number of somatic nonsynonymous gene mutations. Color codes and the position of the circles on the side of the ternary plot define whether genes have mutations that are preferentially pretreatment-private (left, blue), progression-private (right, yellow), or shared mutations (top, red).
Acquisition of resistance mutations. The ternary plot shows the clonal evolution from pretreatment to cycle 3, day 1 ctDNA in each gene and among all histologies. Only nonresponding/progressing patients were included in the analysis, corresponding to a total of 406 mutations analyzed (nonsynonymous somatic mutations and noncoding mutations affecting regions of ASHMs). Each circle indicates a gene. The genes of interest are labeled. The size of each circle is proportional to the number of somatic nonsynonymous gene mutations. Color codes and the position of the circles on the side of the ternary plot define whether genes have mutations that are preferentially pretreatment-private (left, blue), progression-private (right, yellow), or shared mutations (top, red).
By recursive partitioning, ctDNA load in baseline samples stratified PFS with an optimized threshold of 1900 haploid genomic equivalents (hGE)/mL of plasma. According to this threshold, high pretreatment ctDNA levels occurred in 22.4% (95% CI, 13.5-34.5) of lymphoma patients, including 16.7% (95% CI, 5.5-38.2) with relapsed FL, 25.0% (95% CI, 11.5-45.2) with relapsed DLBCL, and 26.7% (95% CI, 8.9-55.2) with RS. Patients with high pretreatment levels of ctDNA had significantly inferior PFS vs those with low levels (Figure 3E-H).
Prognostic value of early ctDNA dynamics during therapy
We tested whether early ctDNA dynamics during therapy could predict the outcome of targeted therapy with ibrutinib+nivolumab. A reduction (>2-log) in ctDNA levels after 2 cycles of therapy with ibrutinib+nivolumab (ie, 28 days after the start of therapy) was achieved by 28.6% (95% CI, 13.5-50.2) of patients with relapsed DLBCL who had ≥1 pretreatment variant (Figure 5A) and was associated with best response (Figure 5B) and improved PFS (Figure 5C). Reduction (>2-log) in ctDNA levels after 2 cycles of therapy was infrequent in DLBCL harboring TP53 mutations (1 of 6). Reduction (>2-log) in ctDNA levels after 2 cycles of therapy was also infrequent in relapsed FL and RS.
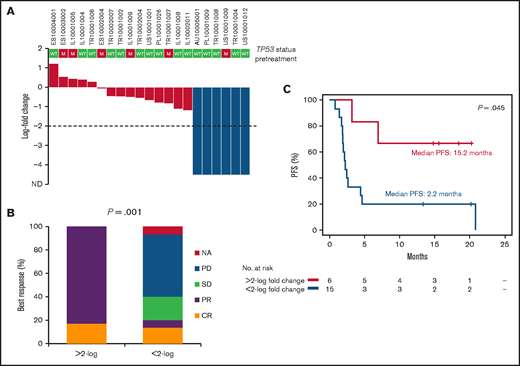
Molecular response after 2 courses of treatment in relapsed DLBCL. (A) Waterfall plot of the log-fold change in ctDNA load after 2 courses of treatment in relapsed DLBCL. Levels of ctDNA are normalized to baseline levels. The dashed line tracks the −2-log threshold. Each column represents a patient and is color coded according to the depth of reduction in ctDNA load. (B) Best response to treatment according to the log-fold change in ctDNA load after 2 courses of treatment in relapsed DLBCL. (C) Kaplan-Meier curves of PFS stratified according to the log-fold change in ctDNA load after 2 courses of treatment in relapsed DLBCL. Red, <2-log-fold change in ctDNA load; blue: >2-log–fold change in ctDNA load. CR, complete response; NA, not applicable; PD, progressive disease; PR, partial response; SD, stable disease.
Molecular response after 2 courses of treatment in relapsed DLBCL. (A) Waterfall plot of the log-fold change in ctDNA load after 2 courses of treatment in relapsed DLBCL. Levels of ctDNA are normalized to baseline levels. The dashed line tracks the −2-log threshold. Each column represents a patient and is color coded according to the depth of reduction in ctDNA load. (B) Best response to treatment according to the log-fold change in ctDNA load after 2 courses of treatment in relapsed DLBCL. (C) Kaplan-Meier curves of PFS stratified according to the log-fold change in ctDNA load after 2 courses of treatment in relapsed DLBCL. Red, <2-log-fold change in ctDNA load; blue: >2-log–fold change in ctDNA load. CR, complete response; NA, not applicable; PD, progressive disease; PR, partial response; SD, stable disease.
Quantitative levels of ctDNA during treatment showed prognostic value when considered as a time-fixed (HR 11.98; P = .009) or time-dependent covariate (HR 3.21; P = .003), independent of the confounding effects of TP53 mutation and ctDNA load in pretreatment ctDNA (supplemental Tables 10 and 11).
Noninvasive detection of treatment-emergent resistance mutations
For each patient, we compared the mutation profile between pretreatment and post–cycle 2 ctDNA samples. Clonal evolution occurred frequently during treatment, reflecting substantial subclonal complexity. Among nonresponders, we identified 10.3% of new mutations in ctDNA from post–cycle 2 samples (not detected in pretreatment ctDNA), and 29.2% of mutations detected in pretreatment ctDNA that disappeared in post–cycle 2 ctDNA samples (Figure 6; supplemental Table 12). This observation suggested a strong selection pressure imposed by treatment leading to relatively early clonal shifts (by day 28) in the mutational spectrum of ctDNA in lymphomas resistant to ibrutinib+nivolumab.
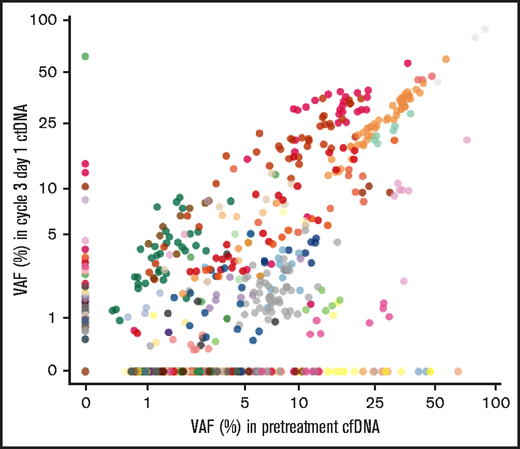
Clonal evolution monitoring in ctDNA. Scatterplot of pretreatment and cycle 3, day 1 variant allele frequency (VAF) of each mutation (n = 1006) and among all histologies. Stable mutations are shown as black dots. Mutations from each patient are plotted in different colors.
Clonal evolution monitoring in ctDNA. Scatterplot of pretreatment and cycle 3, day 1 variant allele frequency (VAF) of each mutation (n = 1006) and among all histologies. Stable mutations are shown as black dots. Mutations from each patient are plotted in different colors.
Overall, among nonresponders (n = 31), 3 patients acquired mutations in the PLCG2 gene, including 2 patients with RS, 1 patient with relapsed DLBCL; no patients had relapsed FL. Consistently, among regions included in the LyV4.0 ctDNA CAPP-seq Assay, treatment-emergent new mutations affected only the coding exons of PLCG2 (Figure 4). No patients acquired the C481S BTK mutation implicated in resistance to ibrutinib in CLL and WM16,17 or coding nonsynonymous mutations in B2M, CIITA, EZH2, and CREBBP, known to affect major histocompatibility complex (MHC) class I and II expression (Figure 4).32-36 Overall, these observations indicate that ctDNA genotyping can facilitate monitoring of emergent on-treatment mutations causing acquired resistance to treatment.
Discussion
Biomarker studies in solid tumors confirmed the clinical utility of ctDNA monitoring at different treatment time points across different tumor histologies and through various treatment scenarios, including chemotherapy, surgery, and targeted therapy.37 The proof of concept of the clinical utility of ctDNA monitoring in hematologic malignancies has recently been provided by several retrospective studies.2-9,38
This exploratory biomarker study based on the prespecified systematic collection of plasma samples in the LYM1002 study corroborates the clinical validity of ctDNA analysis in lymphoma in the context of a multicenter international clinical trial. Major findings of this study are (1) qualification and quantification analyses of ctDNA identified baseline mutations associated with primary resistance to lymphoma therapy; (2) ctDNA analyses enabled real-time assessment of the dynamics of tumor evolution during treatment, including early response/residual disease and acquisition of somatic or resistance mutations developed during treatment with ibrutinib+nivolumab.
TP53 aberrations prognosticate poor outcome in lymphoma treated with chemoimmunotherapy.39-42 We showed that TP53 mutations predict ibrutinib+nivolumab treatment failure in relapsed DLBCL and FL, consistent with a similar finding in relapsed MCL treated with ibrutinib alone.43 This finding suggests that, at variance with CLL,44 patients with TP53-mutated lymphoma do not achieve major clinical benefit with ibrutinib.
One of the most promising areas for future ctDNA-based cancer studies is treatment-response monitoring. Several studies reported that ctDNA levels can be used to monitor residual disease during treatment of solid cancers,45-48 but the applications of ctDNA technology in lymphoma are still under active investigation. In retrospective analyses, early molecular response defined as a >2-log drop in ctDNA after 1 or 2 cycles of therapy predicted outcome during front-line chemotherapy in DLBCL and HL.5,8,49 Current analysis confirmed that an early (ie, 28 days from treatment start, after 2 cycles of therapy) molecular response predicts outcomes in lymphoma treated with targeted therapy. The optimal time for the early molecular response assessment in our study falls within the range of 7 to 56 days from initiation of treatment previously reported as prognostic in CLL, DLBCL, and cHL.4-6,8 However, the optimal time for early molecular response assessment may vary, depending on the type of lymphoma and treatment administered, as has been reported by previous studies assessing response with positron emission tomography/computed tomography.50,51 Defining the optimal earliest time of molecular response assessment is important for the prompt identification of patients refractory to treatment, who may benefit from the early application of available salvage treatments.
Contrary to previous reports on the C481S BTK mutation leading to acquired resistance to ibrutinib in CLL and WM,16,17 we did not detect any treatment-emergent C481S BTK mutations in relapsed FL or DLBCL. Similar observations were reported in patients with FL and MCL treated with ibrutinib52,53 and may suggest alternate mechanisms of ibrutinib resistance. Alternatively, adding nivolumab to ibrutinib may have prevented the emergence of BTK mutant clones.
Faulty antigen presentation is implicated in acquired resistance to immune checkpoint inhibitors in solid tumors. Mutations in B2M, CIITA, EZH2, and CREBBP are known to perturb expression of the MHC class I and II in lymphoma,32-36 which may cause the diminished antitumor activity of the PD-1 blockade.54 In this analysis, mutations known to affect MHC class I and/or II expression have not emerged during treatment with nivolumab+ibrutinib. This observation suggests that, at variance with solid tumors,55 genetic defects in the antigen-presentation machinery may not play a role in resistance to immune checkpoint blockade or, alternatively, that ibrutinib reverses the negative impact of these mutations.
Our assay and study design mitigated the risk of analytical errors and biases. The accuracy of the assay was ensured by the timely processing of plasma samples, the intralaboratory validation of the LyV4.0 ctDNA CAPP-seq Assay, the use of matched germline genomic DNA from blood cells to suppress biological background,56 and the in silico elimination of highly stereotypical artifacts. Overall, our approach achieved a quantification limit of 0.09% and a sensitivity of 0.1%. The prospective, monitored, and aligned collection of clinical information and response assessment allowed for accurate clinical correlations. The feasibility of real-time application of the LyV4.0 ctDNA CAPP-seq Assay in guiding treatment is being now tested in a clinical trial (www.clinicaltrials at NCT04604067).
Recently, Hodkinson et al.57 reported biomarker analyses of tissue biopsy specimens collected in the LYM1002 trial.11 A direct comparison between these data and our ctDNA analysis results was not feasible because of the different collection time points.
This analysis had some limitations. The LYM1002 trial lacked a comparator arm,11 and a clinically actionable mutation level could not be determined. The sample size was small and further subdivided into responder and nonresponder groups. In addition, the results have not been calibrated across different ctDNA platforms, and the ctDNA LyV4.0 Assay interlaboratory agreement has not been tested in a round-robin trial. Finally, deep-targeted sequencing with the LyV4.0 ctDNA CAPP-seq Assay is limited to ctDNA detection of ≥10−3 frequency; it is anticipated that new technologies leveraged on genome-wide mutational integration may deepen the sensitivity of residual disease monitoring in plasma.58
The clinical implications of our observations for future clinical research include considerations of (1) testing TP53 mutations in clinical trials of BTK inhibitors for the treatment of lymphoma; (2) incorporating ctDNA quantification during treatment, along with functional imaging, to refine early response assessment; and (3) evaluating the ctDNA technology in larger studies of ibrutinib and other pathway inhibitors in lymphoma to confirm the prognostic utility of ctDNA for clinical outcomes.
Acknowledgments
The authors thank all the patients who participated in this study and the study investigators. Editorial assistance was provided by Ewa Wandzioch and Liqing Xiao (Parexel) and was funded by Janssen Global Services, LLC.
This study was supported by a grant from Janssen Research and Development, LLC; Swiss Cancer League grants 3746, 4395, 4660, and 4705 (Bern, Switzerland); Research Advisory Board of the Ente Ospedaliero Cantonale grant ABREOC 2019-22514 (Bellinzona, Switzerland); European Research Council (ERC) Consolidator Grant CLLCLONE 772051; Swiss National Science Foundation grants 320030_169670/1 and 310030_192439 (Bern, Switzerland); Fondazione Fidinam (Lugano, Switzerland); the Nelia and Amadeo Barletta Foundation (Lausanne, Switzerland); Fond’Action (Lausanne, Switzerland); The Leukemia and Lymphoma Society, Translational Research Program 6594-20 (New York, NY); and Area Formazione Accademica, Ricerca e Innovazione (AFRI), Ente Ospedaliero Cantonale (Bellinzona, Switzerland).
Authorship
Contribution: D.R. designed the study, interpreted the data, and wrote the manuscript; A.B. performed the molecular experiments, interpreted the data, and contributed to manuscript preparation; L.T.d.B. and F.B. performed the bioinformatic analysis, interpreted the data, and contributed to manuscript preparation; V.S., W.W., M.R.F., and R.K. contributed to the molecular experiments and manuscript revision; G.F. and W.W. managed sample logistics and biobanking and contributed to manuscript revisions; A.C. and M.C.P. performed medical statistical analyses and contributed to manuscript revision; B.G., G.S., and E.Z. provided key scientific insights and contributed to study design, data interpretation, and manuscript revision; J.D.A. and N.F. provided clinical monitoring and management of the study and revised the manuscript; B.H. and M.S. contributed to the computational data analyses and interpretation and manuscript revision; S.B. contributed to study design and execution, data analysis and interpretation, and manuscript revision; and all authors had access to the primary clinical trial data.
Conflict-of-interest disclosure: D.R. received honoraria from AbbVie, AstraZeneca, Gilead, Janssen, Loxo and Verastem and research grants from AbbVie, AstraZeneca, Cellestia, Gilead, and Janssen. B.H., M.S., N.F., J.D.A., and S.B. are employees of the Janssen Pharmaceutical Companies of Johnson & Johnson, and M.S., J.D.A., and S.B. own stock in the company. S.B. owns stock in Gilead Sciences, Celgene, Vertex, and AbbVie. B.G. has received grants and personal fees from Pfizer and personal fees from Alnylam, Janssen, and Sanofi. E.Z. has received research support (institutional) from AstraZeneca, Celgene, Janssen, Merck, and Roche; honoraria (advisory boards) from Beigene, Celgene, Incyte, Janssen, Merck, Roche, Celltrion Helathcare, and Kyte (a Gilead Company); and travel grants from Roche and AbbVie. G.S. has received grants from AbbVie, Gilead, Roche, Celgene, Janssen, and Daiichi. The remaining authors declare no competing financial interests.
Correspondence: Davide Rossi, Department of Hematology, Oncology Institute of Southern Switzerland and Institute of Oncology Research, 6500 Bellinzona, Switzerland; e-mail: davide.rossi@eoc.ch.

