

Key Points
AHR directly regulates a wide range of genes in NK cells, including those involved in cell signaling, oxidative stress, and metabolism.
Knowing of the repertoire of genes regulated by AHR may help us better understand NK-cell dysfunction mediated by AHR ligands in cancer.

Abstract
The aryl hydrocarbon receptor (AHR) is a ligand-activated transcription factor that regulates cellular processes in cancer and immunity, including innate immune cell development and effector function. However, the transcriptional repertoire through which AHR mediates these effects remains largely unexplored. To elucidate the transcriptional elements directly regulated by AHR in natural killer (NK) cells, we performed RNA and chromatin immunoprecipitation sequencing on NK cells exposed to AHR agonist or antagonist. We show that mature peripheral blood NK cells lack AHR, but its expression is induced by Stat3 during interleukin-21–driven activation and proliferation, coincident with increased NCAM1 (CD56) expression resulting in a CD56bright phenotype. Compared with control conditions, NK cells expanded in the presence of the AHR antagonist, StemRegenin-1, were unaffected in proliferation or cytotoxicity, had no increase in NCAM1 transcription, and maintained the CD56dim phenotype. However, it showed altered expression of 1004 genes including those strongly associated with signaling pathways. In contrast, NK cells expanded in the presence of the AHR agonist, kynurenine, showed decreased cytotoxicity and altered expression of 97 genes including those strongly associated with oxidative stress and cellular metabolism. By overlaying these differentially expressed genes with AHR chromatin binding, we identified 160 genes directly regulated by AHR, including hallmark AHR targets AHRR and CYP1B1 and known regulators of phenotype, development, metabolism, and function such as NCAM1, KIT, NQO1, and TXN. In summary, we define the AHR transcriptome in NK cells, propose a model of AHR and Stat3 coregulation, and identify potential pathways that may be targeted to overcome AHR-mediated immune suppression.
Introduction
The aryl hydrocarbon receptor (AHR) is a ligand-activated transcription factor that influences diverse biological functions including cellular differentiation, malignant transformation, metabolism, and immune regulation.1-4 In the absence of agonist, AHR resides in the cytoplasm forming a complex with cochaperone proteins. On binding a ligand or an agonist, the AHR translocates to the nucleus where it forms a heterodimer with ARNT.5 The AHR/ARNT heterodimer binds to xenobiotic response elements (XREs) or AHR binding sites, regulating the expression of a wide variety of genes, including cytochrome P450 (CYP)5 .
Altered tryptophan (Trp) metabolism caused by elevated levels of the Trp-metabolizing enzymes indoleamine 2,3-dioxygenase (IDO) and tryptophan 2,3-dioxygenase (TDO), leads to generation of suppressive molecules like kynurenine (Kyn) and kynurenic acid (KA), which is linked to immune dysfunction.6-8 Elevated levels of KA have been reported in the serum of patients with hematologic malignancies like acute myeloid leukemia, lymphomas, and solid cancers such as colon, glioblastoma, and breast cancers.9-15 Kyn/KA are endogenous ligands that mediate their suppressive effects via binding to AHR and activation of this pathway induces immune tolerance.2,4,12
AHR signaling plays a critical role in shaping innate and adaptive immune responses. AHR has an important role in the development of innate lymphoid cells that are considered as natural killer (NK) cell precursors.16,17 NK cells are large granular lymphocytes that participate in the innate immune response to virally infected and neoplastic cells tumors via specialized receptors for major histocompatibility antigens and immunoglobulin G.18,19 In addition to their ability to mediate antibody-dependent cellular cytotoxicity, NK cells secrete cytokines such as interferon γ (IFNγ) and tumor necrosis factor α (TNFα) that inhibit tumor cell proliferation, enhance antigen presentation, and aid in the chemotaxis of T cells.20,21 Human NK cells have been broadly divided into 2 subsets: CD56bright and CD56dim.22,23 The CD56dim subset comprises 80% to 95% of peripheral blood NK cells and represent the mature NK-cell population in humans (stage V). They express maturity-related inhibitory receptors, cytotoxic effector proteins (perforin and granzyme B), and high expression of CD16 (FcγRIIIa), permitting responses to antibody-opsonized targets.24 In contrast, the less mature CD56bright cells represent approximately 10% of the circulating NK cells and are considered as potent cytokine producers. Furthermore, there is evidence to suggest that CD56bright NK cells serve as precursors to CD56dim NK cells, because CD56bright NK cells appear first in the blood after bone marrow or stem cell transplantation, which is then followed by an accumulation of CD56dim NK cells.25
The molecular mechanism by which AHR effects the differentiation and regulates the function of human NK cells remains largely unknown. In the present study, we use an ex vivo NK-cell expansion system to demonstrate that inhibition of AHR using an antagonist, StemRegenin-1 (SR-1), does not impact proliferation or effector function but promotes the development of NK cells with CD56dim phenotype. In contrast, NK cells treated with AHR agonists Kyn and KA suppress the cytotoxic function of NK cells and effected the expression of genes involved in regulation of metabolism. Using RNA sequencing (RNA-seq) and chromatin immunoprecipitation sequencing (ChIP-seq) approaches, we show that AHR modulates these functions by directly binding on the proximal region of gene promoters, including NCAM1 (CD56). Based on our findings, we propose a model of AHR/STAT3 pathway interactions in the regulation of mature NK-cell function.
Methods
NK-cell isolation
NK cells were isolated from whole blood or buffy coats of healthy donors using Rosette-Sep (StemCell Technologies, Vancouver, Canada) and were expanded by stimulation with FC21 feeder cells for 14 to 21 days as previously described.26,27 Briefly, irradiated FC21 feeder cells were added to the NK cell culture conditions at a ratio of 1:2 (effector:target) on day 0 and 1:1 on days 7 and 14 with human interleukin 2 (IL-2) alone (50 IU/mL) or with the following: 1 μM SR-1 (StemCell Technologies 72342), 25 μM Kyn (Tcoris Bioscience), or 25 μM KA (Tcoris Bioscience). The media were changed every 2 to 3 days.
Complete details regarding methods for cytotoxicity, flow cytometry, cytokine assays, immunoblotting, RNA-seq, CHIP-seq, and statistical analysis are provided in the supplemental Methods.
Results
Increased expression of AHR in IL-21–expanded NK cells
We used an irradiated K562 feeder cell line overexpressing membrane-bound IL-21 and 4-1BBL (FC21) to examine the role of AHR in NK-cell proliferation, differentiation, and function.27 NK cells isolated from healthy donor leukopak were grown with FC21 and low-dose IL-2 (50 IU/mL) for a period of 2 weeks. We observed that NK cells stimulated with FC21 had a modest (2.2-fold) but significant (P < .05) increase in levels of AHR transcript (Figure 1A; supplemental Figure 1A). Moreover, the expression of AHR target genes CYP1B1 and aryl hydrocarbon receptor repressor (AHRR) were also significantly increased (Figure 1A; supplemental Figure 1A). Although there was a modest increase in the AHR transcript, a robust increase in the AHR protein was observed, peaking at day 14 after FC21 stimulation (Figure 1B; supplemental Figure 2). We previously showed that FC21-mediated expansion of NK cells leads to increased Stat3 phosphorylation27,28 ; thus, we determined whether Stat3 was involved in the regulation of AHR expression during NK-cell expansion. ChIP-seq analysis confirmed that Stat3 binds to the proximal region of the AHR promoter in expanded NK cells (supplemental Figure 1E).
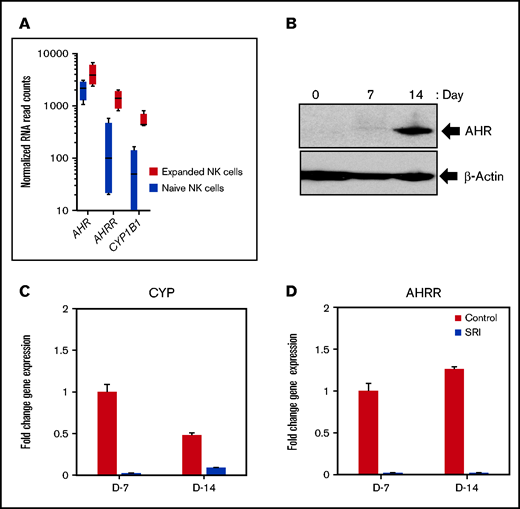
AHR expression in IL-21–expanded NK cells. (A) RNA-seq data showing the expression of aryl hydrocarbon receptor (AHR), aryl hydrocarbon receptor repressor (AHRR), and cytochrome P450 isoform B1 (CYP1B1) from naïve (resting) and day 14 expanded NK cells. NK cells isolated from healthy donors were expanded for a period of 2 weeks with irradiated K562 feeder cells overexpressing membrane bound IL-21 and 4-IBBL (FC21) in RPMI media containing IL-2 (50 IU/mL). (B) Immunoblot showing the expression of AHR from FC21 expanded NK cells at the indicated time points. Protein lysates prepared from NK cells were probed with anti-AHR or anti-actin antibodies. (C-D) Quantitative real-time PCR showing the expression of AHR targets genes CYP1B1 and AHRR from NK cells expanded with DMSO (control) or 1 μm Stemregenin (SR-1) on day 7 (D7) and day 14 (D14). The value on the y axis represents fold change in gene expression relative to the D7 control NK cells.
AHR expression in IL-21–expanded NK cells. (A) RNA-seq data showing the expression of aryl hydrocarbon receptor (AHR), aryl hydrocarbon receptor repressor (AHRR), and cytochrome P450 isoform B1 (CYP1B1) from naïve (resting) and day 14 expanded NK cells. NK cells isolated from healthy donors were expanded for a period of 2 weeks with irradiated K562 feeder cells overexpressing membrane bound IL-21 and 4-IBBL (FC21) in RPMI media containing IL-2 (50 IU/mL). (B) Immunoblot showing the expression of AHR from FC21 expanded NK cells at the indicated time points. Protein lysates prepared from NK cells were probed with anti-AHR or anti-actin antibodies. (C-D) Quantitative real-time PCR showing the expression of AHR targets genes CYP1B1 and AHRR from NK cells expanded with DMSO (control) or 1 μm Stemregenin (SR-1) on day 7 (D7) and day 14 (D14). The value on the y axis represents fold change in gene expression relative to the D7 control NK cells.
In addition, although we observed a small increase in AHR mRNA expression in NK cells expanded using the cytokine IL-2 alone by reverse transcriptase-polymerase chain reaction (RT-PCR), a robust increase in AHR expression was observed posttranscriptionally at the protein level. Together, these results provide further evidence that STAT3 is involved in AHR regulation in NK cells (supplemental Figure 1B-D).
Because there was a strong activation of the AHR pathway in expanded NK cells, we examined the effect of the AHR antagonist SR-1 on FC21-driven proliferation/expansion. Treatment of NK cells with SR-1 resulted in a >1000-fold decrease in the expression of CYP1B1 and AHRR but did not significantly impact the number of NK cells between the 2 groups at the end of 2-week expansion period (Figure 1C-D; supplemental Figure 3). Together, these results demonstrate that even complete AHR inhibition does not impact the survival of NK cells.
AHR regulates genes involved in the NK-cell development
Furthermore, to investigate the role of AHR in the NK-cell phenotype, cells were expanded with SR-1 as described above. Consistent with previous studies, after expansion with FC21, NK cells were mostly CD56bright at the end of 2 weeks.27,29,30 RT-PCR showed no change in CD56 (NCAM1) expression in NK cells after 1 week of treatment with SR-1, consistent with surface protein expression by flow cytometry. However, a fourfold increase in CD56 expression was observed in FC21-expanded NK cells on day 14 (Figure 2A). Interestingly, a significant (P < .001) increase in the percentage of CD56dim NK cells was observed after their expansion with SR-1 (Figure 2B-C). Moreover, we observed a >50-fold reduction (P < .001) in KIT (CD117) mRNA expression and a decrease (P < .01) in KIT protein levels after 2 weeks of expansion with SR-1 (Figure 2D-E). However, AHR inhibition had no impact on the expression of other NK-cell receptors at either D7 or D14 (supplemental Figure 4). In summary, these results suggest that AHR may regulate the expression of CD56 and KIT in NK cells.
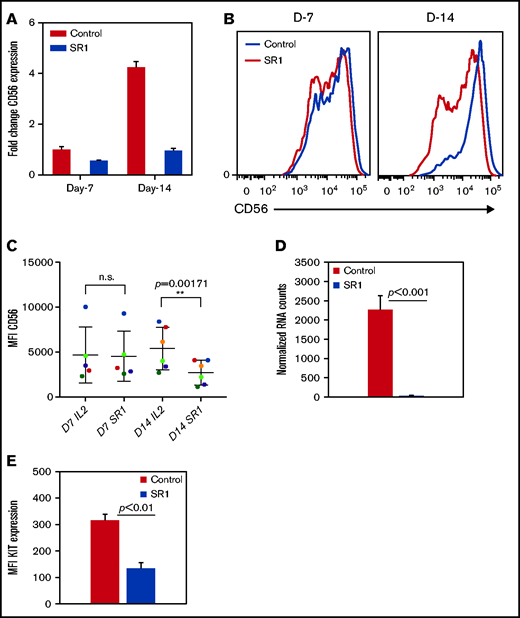
SR-1 promotes the development of CD56dim NK cells. (A) Real-time PCR showing CD56 expression from NK cells expanded with DMSO (control) or SR-1 on day 7 (D7) and day 14 (D14). The value on the y axis shows fold change in gene expression relative to D7 control NK cells. (B) Representative fluorescence-activated cell sorter histograms showing CD56 expression in day 7 or 14 expanded NK cells with SR-1 (1 μm) or DMSO (control). (C) Quantification of CD56 expression by measuring mean fluorescence intensity in NK cells expanded with SR-1 or control from multiple donors on days 7 or 14. Values show mean ± standard deviation (SD; n = 6, P < .001). ns, not significant. (D) RNA-seq data showing the expression of KIT in NK cells expanded with DMSO (control) or SR-1. Value show mean ± SD (n = 3, P < .001). (E) Fluorescence-activated cell sorter analysis showing KIT expression in NK cells expanded with SR-1 or control (DMSO) on day 14. Mean fluorescence intensity was used to determine protein expression. The values show mean ± SD (n = 3, P < .01).
SR-1 promotes the development of CD56dim NK cells. (A) Real-time PCR showing CD56 expression from NK cells expanded with DMSO (control) or SR-1 on day 7 (D7) and day 14 (D14). The value on the y axis shows fold change in gene expression relative to D7 control NK cells. (B) Representative fluorescence-activated cell sorter histograms showing CD56 expression in day 7 or 14 expanded NK cells with SR-1 (1 μm) or DMSO (control). (C) Quantification of CD56 expression by measuring mean fluorescence intensity in NK cells expanded with SR-1 or control from multiple donors on days 7 or 14. Values show mean ± standard deviation (SD; n = 6, P < .001). ns, not significant. (D) RNA-seq data showing the expression of KIT in NK cells expanded with DMSO (control) or SR-1. Value show mean ± SD (n = 3, P < .001). (E) Fluorescence-activated cell sorter analysis showing KIT expression in NK cells expanded with SR-1 or control (DMSO) on day 14. Mean fluorescence intensity was used to determine protein expression. The values show mean ± SD (n = 3, P < .01).
Effect of AHR inhibition on NK-cell functions
NK cells mediate their antitumor effects through the direct lysis of cancer cell by release of perforins and granzymes and the secretion of cytokines such as IFNγ and TNF-α. To determine the effect of AHR inhibition on the lytic function of NK cells, FC21-expanded NK cells were treated with dimethyl sulfoxide (DMSO; control) or SR-1 overnight and then used in a standard cytotoxicity assay against MHC-I–deficient K562 or MHC-I–positive glioblastoma cells (SJGBM2) and triple-negative breast cancer cells (HS578T) as target cells. AHR inhibition had no impact on the cytotoxic function of NK cells (Figure 3A-C; supplemental Figure 5). Next, to investigate whether long-term AHR inhibition impacts the lytic function of NK cells, the cells were expanded for 2 weeks in the presence of SR-1 before testing their cytotoxicity against K562 or SJGBM2 target cells. Consistent with these findings, AHR inhibition had no effect on the lytic function of NK cells (Figure 3D-E). A similar trend was observed in primary NK cells treated overnight with SR-1 (supplemental Figure 6).
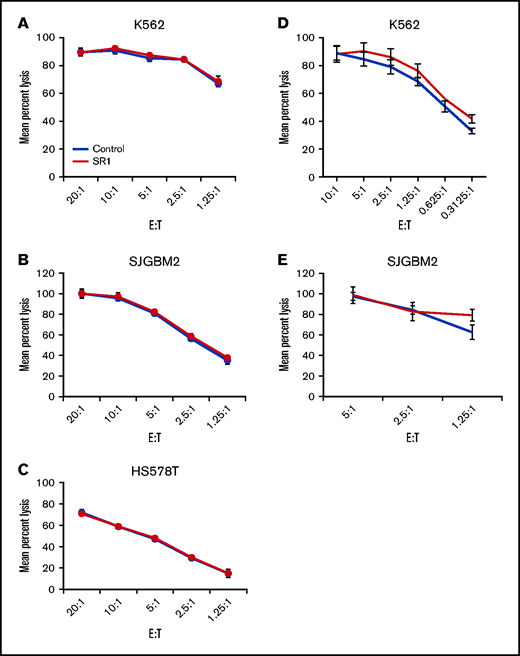
Effect of AHR inhibition on NK-cell function. (A-C) NK cells cell expanded using FC21 feeder cells for 2 weeks. Following the expansion, NK cells were treated overnight with SR-1 (1 μm) or DMSO (control). NK cells were then cocultured with calcein-labeled K562, SJGBM2, or HS578T cells at various effector to target (E:T) for 4 hours. The calcein release in the supernatant was used to determine mean specific lysis. (D-E) NK cells were expanded using FC21 cells for 2 weeks with SR-1 (1 μm) or DMSO (control). The expanded NK cells were cocultured with calcein-labeled tumors: K562 or SJGBM2 cells at E:T for 4 hours.
Effect of AHR inhibition on NK-cell function. (A-C) NK cells cell expanded using FC21 feeder cells for 2 weeks. Following the expansion, NK cells were treated overnight with SR-1 (1 μm) or DMSO (control). NK cells were then cocultured with calcein-labeled K562, SJGBM2, or HS578T cells at various effector to target (E:T) for 4 hours. The calcein release in the supernatant was used to determine mean specific lysis. (D-E) NK cells were expanded using FC21 cells for 2 weeks with SR-1 (1 μm) or DMSO (control). The expanded NK cells were cocultured with calcein-labeled tumors: K562 or SJGBM2 cells at E:T for 4 hours.
Next, to determine whether AHR is involved in regulating cytokine production, NK cells were treated overnight with SR-1 and then stimulated with K562 cells. The levels of cytokines in the supernatant were measured using bead-based arrays. Inhibition of AHR had no impact on the levels of IFNγ, TNF-α, IL-2, or other cytokines secreted in response to tumor targets (supplemental Figure S7 and data not shown). Together, these results demonstrate that AHR inhibition does not affect NK-cell functions.
AHR agonists suppress NK-cell cytotoxic function
Kyn and KA are endogenous AHR ligands that mediate their suppressive effects via binding to AHR.12 To examine the effect of AHR agonists on proliferation and function, NK cells were expanded with FC21 for 2 weeks in the presence of either Kyn (25 μM) or KA (25 μM). In the presence of the AHR agonists, NK cells grew robustly and were similar to those without AHR agonists, demonstrating again that AHR does not affect the proliferation of NK cells (supplemental Figure 8). The NK cells expanded with AHR agonists were then assessed for cytotoxicity against K562 or SJGBM2 cells. When present during expansion, both AHR agonists were able to suppress the subsequent lytic function of NK cells (Figure 4A-B). Next, to determine whether the expanded NK cells were sensitive to the inhibition of cytotoxic function during short-term exposure to AHR agonists, FC21-expanded NK cells were rested in low-dose IL-2 (50 IU/mL) overnight with or without KA and were subsequently tested for cytotoxicity against HS578T or SJGBM2 target cells. A 50% reduction in the lytic activity of NK cells was observed after KA treatment (P < .01; Figure 4C-F). However, neither agonist had an impact on the levels of IFNγ and TNF-α (supplemental Figure 9). In summary, these results demonstrate that AHR activation by agonists does not impact activation-induced proliferation or cytokine production but significantly suppresses the lytic function of NK cells.
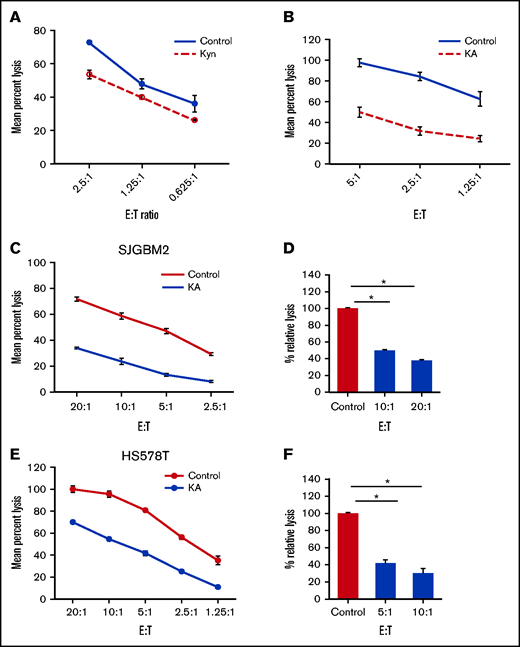
AHR agonists suppress NK-cell function. (A-B) NK cells expanded using FC21 for 2 weeks with AHR agonist 25 μm Kyn or KA. The expanded NK cells were tested against calcein-labeled tumors: K562 or SJGBM2 cells. Mean specific lysis was determined using amount of calcein release. NK cells cell expanded using FC21 for 2 weeks. Following the expansion, NK cells were treated overnight with KA (25 μM) or DMSO (control) and then cocultured with calcein-labeled tumors at various E:T for 4 hours. Representative plot showing standard cytotoxicity assay against (C) HS578T cells and (E) SJGBM2 cells. Percent lysis calculated relative to the control group shown in panels D and F. Data show mean ± standard error of the mean (n = 3; P < .01).
AHR agonists suppress NK-cell function. (A-B) NK cells expanded using FC21 for 2 weeks with AHR agonist 25 μm Kyn or KA. The expanded NK cells were tested against calcein-labeled tumors: K562 or SJGBM2 cells. Mean specific lysis was determined using amount of calcein release. NK cells cell expanded using FC21 for 2 weeks. Following the expansion, NK cells were treated overnight with KA (25 μM) or DMSO (control) and then cocultured with calcein-labeled tumors at various E:T for 4 hours. Representative plot showing standard cytotoxicity assay against (C) HS578T cells and (E) SJGBM2 cells. Percent lysis calculated relative to the control group shown in panels D and F. Data show mean ± standard error of the mean (n = 3; P < .01).
AHR regulates the NK-cell transcriptome
Next, we performed RNA-seq analysis to examine the transcriptome of NK cells expanded with FC21 with or without an AHR antagonist (SR-1) or agonist (Kyn). RNA was isolated from donor-matched NK cells before their expansion at day 0 (DO) and after expansion with FC21 alone or with SR-1 or Kyn on days 7 (D7) and 14 (D14). An unbiased gene expression analysis pipeline was used to identify the differentially expressed genes (DEGs) between IL-2– (control) and SR-1–expanded NK cells (Figure 5A-B). Principal component analysis showed that NK cells treated with SR-1 clustered together and were distinct from the control NK cells (Figure 5C; supplemental Figure 10B). Furthermore, analysis of NK cells treated with SR-1 at D7 showed change in expression of 132 genes (1.5-fold; P < .05; Figure 5D; supplemental Figure 10A), which increased to 1004 DEGs at D14 in SR-1–treated NK cells (Figure 5A-B,D). Next, we used AHR ChIP-seq to differentiate direct and indirect effects of SR-1 and Kyn on the transcriptome and identify specific genes regulated by AHR. Using this analysis, we found 24 of 132 and 148 of 1004 genes were direct AHR target genes after treatment of NK cells with SR1 on D7 and D14, respectively (Figure 5D). Gene ontology analysis using ingenuity pathway analysis (IPA) revealed an enrichment of genes involved in the regulation of processes related to cell migration and adhesion in the D7-SRI–treated group (data not shown). The DEGs were highly associated with NF-κB, IL-9, and G-protein–coupled receptor signaling pathways in D14 NK cells treated with the AHR antagonist (Figure 5E; supplemental Figure 11).
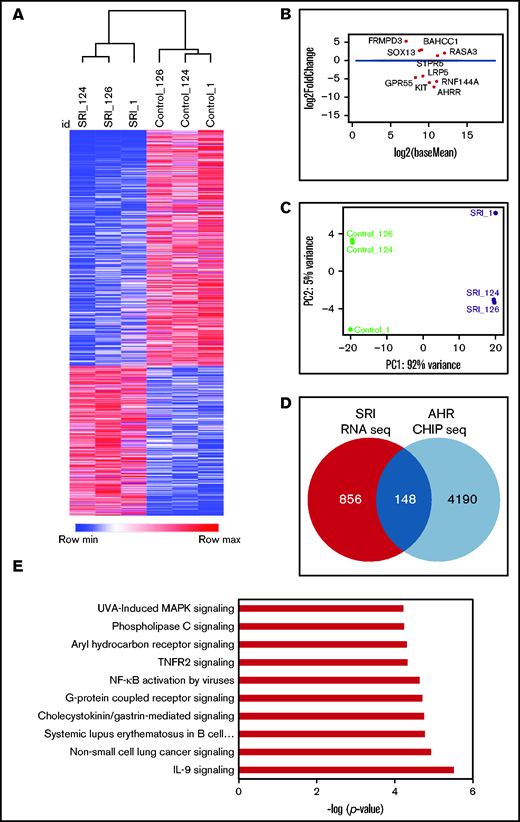
AHR inhibition leads transcriptional reprograming of NK cells. (A) Heatmap showing hierarchical clustering of DEGs between SR-1– and DMSO (control)-expanded NK cells on day 14. RNA isolated from control- or SR-1–expanded NK cells was used for RNA-seq. The transcripts were aligned to the human GRCh38 assembly. The results show the expression of genes that change 1.5-fold (P < .05). Hierarchical clustering was performed using Pearson correlation. (B) Multivariate plot showing the expression of highest expressed gene upregulated or downregulated between the control (DMSO) and SR-1 treatment groups. Each dot represents a gene, with the x axis representing expression and the y axis representing fold change. Dots colored red show genes whose differential expression is considered statistically significant (<10% false discovery rate). (C) Principal component analysis showing the genes from day 14 SR-1– or DMSO-expanded NK cells. x and y axes show principal component 1 (PC1) and principal component 2 (PC2) that explain 92% and 5% of the total variance, respectively. (D) Venn diagram showing the number of AHR targets genes in NK cells expanded with SR-1 as identified by AHR ChIP-seq on day 14. (E) IPA showing the top 10 signaling pathways. Gene ontology analysis was performed using the list of differentially expressed AHR target genes (148) from day 14 SR-1–expanded NK cells.
AHR inhibition leads transcriptional reprograming of NK cells. (A) Heatmap showing hierarchical clustering of DEGs between SR-1– and DMSO (control)-expanded NK cells on day 14. RNA isolated from control- or SR-1–expanded NK cells was used for RNA-seq. The transcripts were aligned to the human GRCh38 assembly. The results show the expression of genes that change 1.5-fold (P < .05). Hierarchical clustering was performed using Pearson correlation. (B) Multivariate plot showing the expression of highest expressed gene upregulated or downregulated between the control (DMSO) and SR-1 treatment groups. Each dot represents a gene, with the x axis representing expression and the y axis representing fold change. Dots colored red show genes whose differential expression is considered statistically significant (<10% false discovery rate). (C) Principal component analysis showing the genes from day 14 SR-1– or DMSO-expanded NK cells. x and y axes show principal component 1 (PC1) and principal component 2 (PC2) that explain 92% and 5% of the total variance, respectively. (D) Venn diagram showing the number of AHR targets genes in NK cells expanded with SR-1 as identified by AHR ChIP-seq on day 14. (E) IPA showing the top 10 signaling pathways. Gene ontology analysis was performed using the list of differentially expressed AHR target genes (148) from day 14 SR-1–expanded NK cells.
Although there was some overlap between the DEGs of SR-1– and Kyn-treated NK cells, they were mostly distinct. NK cells expanded with the AHR agonist Kyn showed no change in gene expression at D7. However, 97 genes were differentially expressed at D14, and further analysis revealed that 12 of 97 were AHR target genes (Figure 6A-B). Importantly, the expression of all 12 AHR target genes was increased compared with the control group, consistent with the role of AHR agonists functioning as transcriptional activators (supplemental Figure 12). These genes were mostly involved in the regulation of metabolic processes, including antioxidant enzymes, the pentose phosphate pathway (PPP), and iron transport (Figure 6C-D). Together our results identify AHR as a key transcriptional factor involved in the regulation of the NK-cell transcriptome, particularly of signaling and metabolic pathways.
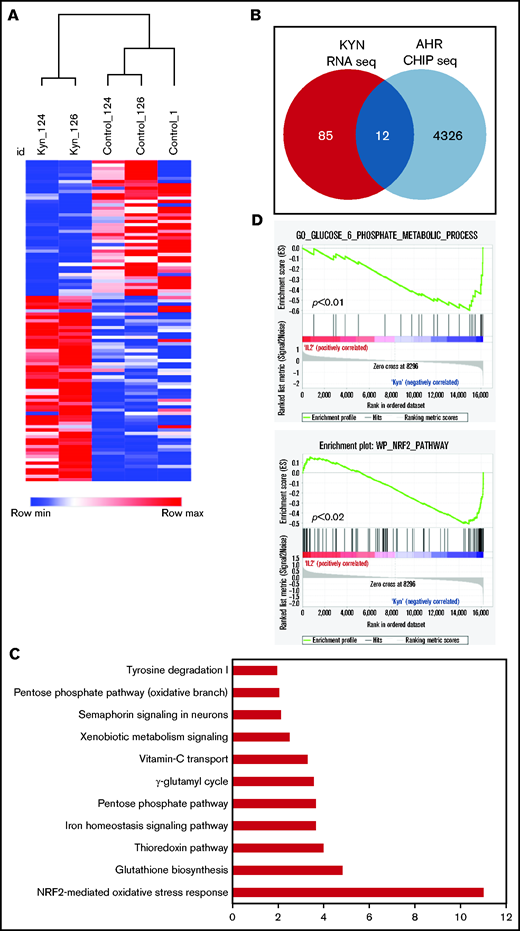
AHR agonists suppress NK-cell function. (A) Heatmap showing hierarchical clustering of DEGs between Kyn and DMSO (control) in day 14 expanded NK cells. Donor-matched control or Kyn expanded NK cells were used for RNA-seq. The results show expression of genes that change 1.5-fold (P < .05). (B) Venn diagram showing the number of the DEGs genes and AHR targets genes in NK cells expanded with Kyn. (C) IPA analysis showing the top 10 pathways. Gene ontology was performed using the list of differentially expressed AHR target genes from day 14 NK cells expanded with Kyn. (D) Gene Set Enrichment Analysis (GSEA) analysis showing an enrichment of glucose metabolic (top) and NRF2 (bottom) pathways in NK cells expanded with Kyn.
AHR agonists suppress NK-cell function. (A) Heatmap showing hierarchical clustering of DEGs between Kyn and DMSO (control) in day 14 expanded NK cells. Donor-matched control or Kyn expanded NK cells were used for RNA-seq. The results show expression of genes that change 1.5-fold (P < .05). (B) Venn diagram showing the number of the DEGs genes and AHR targets genes in NK cells expanded with Kyn. (C) IPA analysis showing the top 10 pathways. Gene ontology was performed using the list of differentially expressed AHR target genes from day 14 NK cells expanded with Kyn. (D) Gene Set Enrichment Analysis (GSEA) analysis showing an enrichment of glucose metabolic (top) and NRF2 (bottom) pathways in NK cells expanded with Kyn.
AHR regulates CD56 expression in NK cells
Bioinformatic analysis revealed the presence of XRE sites on promoters of several genes that are involved in the regulation of NK-cell function. ChIP-seq analysis was performed on D14 FC21-expanded NK cells, because we identified this time point as having the highest AHR expression (Figure 1B). ChIP-seq analysis showed that most peaks were within ±5 kb of the transcriptional start sites (TSS) around the gene promoters. Importantly, no binding was observed in the total input sample, suggesting specificity of the AHR ChIP antibody (Figure 7A-B). Analysis of ChIP-seq data using HOMER revealed an enrichment of the known AHR motif GCGTGC/A (Figure 7C). Furthermore, to validate the specificity of ChIP seq, we confirmed AHR recruitment to the promoters of the known AHR target genes CYP1A1 and AHRR (Figure 7D-E). Consistent with CD56 gene expression alterations identified by flow cytometry and RNA-seq, analysis of the NCAM1 promoter showed presence of XRE binding sites, and ChIP-seq results confirmed AHR binding to the proximal sites of the gene promoter (Figure 7F-G). We also observed that SR1 treatment decreases KIT expression in NK cells. Analysis of ChIP-seq also showed AHR binding to KIT promoter in FC21-expanded NK cells (Figure 7H-I). Together, we conclude that AHR is involved in the transcriptional regulation of CD56 and KIT genes in NK cells.
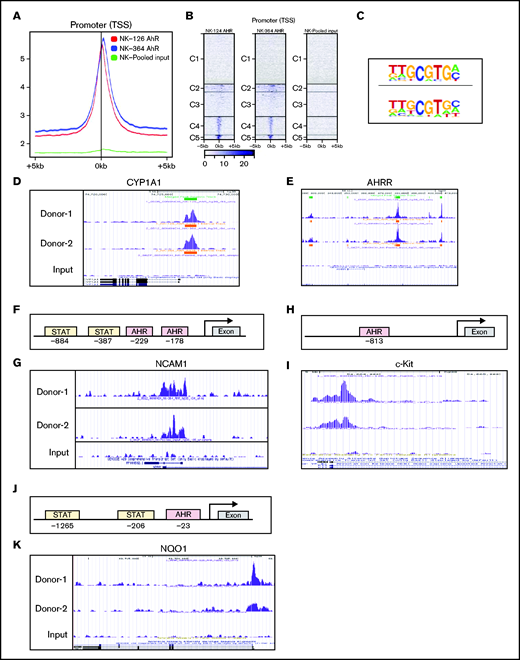
AHR regulates NCAM1 and NQO1 expression. (A) Distributions of peaks across the TSS of gene promoters. ChIP-seq was performed using anti-AHR antibody on FC21-expanded NK cells from 2 donors on day 14. The reads were aligned to the human genome (hg38). (B) Heatmap showing the distribution of peaks across the gene promoter within 5 kb of TSS. The peaks are clustered into 5 regions indicated as C1 to C5. (C) De novo motifs were identified using the Human Organ-specific Molecular Electronic Repository (HOMER) package using default parameters and input sequences comprising ±100 bp from the center of the top 1000 peaks. The highest-ranking motif from each sample is shown. (D-E) ChIP-seq data showing recruitment of AHR to the proximal regions of gene promoters in day 14 FC21-expanded NK cells. Peaks were visualized using the University of California, Santa Cruz (UCSC) genome browser. (D) Cytochrome P450 A1 and (E) AHR repressor. (F) Schematic showing the position of Stat3 and AHR binding sites on the human NCAM1 (CD56) promoter relative to the transcriptional start site and first exon. (G) ChIP-seq data showing the recruitment of AHR to NCAM1 promoter in day 14 FC21-expanded NK cells. (H) Schematic showing the position of AHR binding sites on the human KIT (CD117) promoter relative to the transcriptional start site and first exon. (I) ChIP-seq data showing the recruitment of AHR to the promoter of KIT in day 14 FC21 expanded NK cells. (J) Schematic showing the position of Stat3 and AHR sites on the gene NADPH quinone oxidoreductase (NQO1) relative to TSS. (K) Recruitment of AHR to the NQO1 gene promoter in D14-expanded NK cells.
AHR regulates NCAM1 and NQO1 expression. (A) Distributions of peaks across the TSS of gene promoters. ChIP-seq was performed using anti-AHR antibody on FC21-expanded NK cells from 2 donors on day 14. The reads were aligned to the human genome (hg38). (B) Heatmap showing the distribution of peaks across the gene promoter within 5 kb of TSS. The peaks are clustered into 5 regions indicated as C1 to C5. (C) De novo motifs were identified using the Human Organ-specific Molecular Electronic Repository (HOMER) package using default parameters and input sequences comprising ±100 bp from the center of the top 1000 peaks. The highest-ranking motif from each sample is shown. (D-E) ChIP-seq data showing recruitment of AHR to the proximal regions of gene promoters in day 14 FC21-expanded NK cells. Peaks were visualized using the University of California, Santa Cruz (UCSC) genome browser. (D) Cytochrome P450 A1 and (E) AHR repressor. (F) Schematic showing the position of Stat3 and AHR binding sites on the human NCAM1 (CD56) promoter relative to the transcriptional start site and first exon. (G) ChIP-seq data showing the recruitment of AHR to NCAM1 promoter in day 14 FC21-expanded NK cells. (H) Schematic showing the position of AHR binding sites on the human KIT (CD117) promoter relative to the transcriptional start site and first exon. (I) ChIP-seq data showing the recruitment of AHR to the promoter of KIT in day 14 FC21 expanded NK cells. (J) Schematic showing the position of Stat3 and AHR sites on the gene NADPH quinone oxidoreductase (NQO1) relative to TSS. (K) Recruitment of AHR to the NQO1 gene promoter in D14-expanded NK cells.
AHR activation attenuates NK-cell function
To better understand the underlying mechanism(s) of how AHR activation suppresses the lytic function of NK cells, IPA was applied to the DEGs from NK cells treated with Kyn to identify the major pathways impacted. NAD(P)H quinone dehydrogenase-1 (NQO1) and thioredoxin (TXN) were among the most upregulated genes in Kyn-treated NK cells. Furthermore, CHIP-seq analysis of the TXN and NQO1 showed loading of AHR to their promoters (Figure 7J-K; supplemental Figure 13). Antioxidant enzymes such as NQO1 and TXN play a major role in mitigating the toxic effect of free radicals. Similarly, there was also significant binding of AHR to promoters of genes involved in PPP (eg, 6-phosphogluconate dehydrogenase [PGD]), glutathione synthesis (eg, glutamate-cysteine ligase [GCLC]), and iron metabolism (eg, ferritin light chain [FTL]) (supplemental Figure 13).
Next, to determine the clinical relevance of our results, we analyzed patient gene expression using the Oncomine database. We found a direct correlation between elevated expression of IDO-1/TDO-2 and AHR target genes CYP1B1, NQO1, and TXN in 3 independent lymphoma datasets (supplemental Figure 14). Together, these results suggest the activation of AHR signaling by its agonists induce oxidative stress that perturbs cellular metabolism, which may result in NK-cell dysfunction.
Discussion
The development of human NK cells is a complex process, and AHR has been implicated in playing a dual role regulating NK-cell differentiation and function, although the repertoire of genes directly regulated by AHR in NK cells is largely undefined. Here, we assessed gene expression and AHR chromatin binding assays in combination with AHR agonists and antagonists to define the genes directly regulated by AHR through binding to regulatory sites on gene promoters. We found AHR regulates gene sets that highly associated with multiple signaling pathways, metabolic pathways, and oxidative stress response. In addition, AHR directly and positively regulates CD56 expression such that inhibition/loss of AHR signaling promotes the generation of NK cells with a CD56dim phenotype.
AHR inhibition promotes the development of CD56dim NK cells
Human peripheral blood NK cells are broadly divided into CD56bright and CD56dim subsets.24,31 NK cells have been postulated to undergo a linear pattern of development with CD56bright NK cells, becoming CD56dim NK cells in the secondary lymphoid tissue.22,32 Studies show that CD56bright NK cells appear first in the blood after bone marrow transplantation, followed by an accumulation of CD56dim NK cells.25 The present study confirms previous observations that NK-cell expansion with feeder cells expressing IL-21 and 4-1BBL results in CD56bright NK cells but also demonstrate that blocking of AHR signaling abrogates the upregulation of CD56 in this system. The presence of AHR ligands in the media is evident from the upregulation of AHR and its target genes CYP1B1 and AHRR, which is blocked by the addition of the AHR antagonist SR-1. Our results show that inhibition of AHR reduces CD56 expression resulting in NK cells with a CD56dim phenotype. Similarly, the presence of AHR ligands in cell culture media has been shown to promote generation of Th17 cells in vitro, and AHR antagonists have been shown to promote the expansion of hematopoietic stem cells (HSCs).33,34
Moreover, a recent study from Angelos et al35 showed that SR-1 promotes the development of NK cells from early HSC progenitors, providing further evidence regarding the role of AHR in NK-cell development. Here, we identified KIT (CD117) as a gene that is highly regulated by AHR, observing a >50-fold reduction in the expression of KIT after treatment with SR1. KIT is a transmembrane protein with tyrosine kinase activity and is expressed on normal bone marrow cells.36 Stem cell factor is a ligand for the KIT receptor and plays a major role in the development of HSCs.37 CD56bright cells have been shown to express KIT and proliferate in response to IL-2 and stem cell factor stimulation. NK cells lose KIT expression as they mature to stage V CD56dim cells.38
Our analysis of the NCAM1 (CD56) promoter shows Stat3 and AHR regulatory elements are in close proximity, and the ChIP-seq data confirmed that AHR directly regulates CD56 expression at the transcriptional level by binding to the promoter. However, CD56 expression is not altered during the first week of expansion. IL-21 stimulation leads to increased Stat3 phosphorylation during NK-cell expansion, so binding of Stat3 to the NCAM1 promoter may be an early event, which opens the chromatin, facilitating the binding of AHR to XRE sites that then enhance CD56 expression during the second week of expansion. AHR has been shown to cooperate with Stat3 in other systems, such as in regulation of Aiolos (IKZF3) during early stages of Th17 cell differentiation.39 Oncostatin M has been shown to regulate AHR expression in a Stat3-dependent manner in HepG2 cells.40 Our data support the possibility that the decrease in AHR signaling as immature NK cells emigrate from bone marrow to peripheral blood may be responsible for the phenotypic maturation from CD56bright to CD56dim, consistent with previous observations of higher expression of AHR in CD56bright NK cells compared with CD56dim cells.41 This idea is also supported by previous observations that inhibition of AHR promotes the differentiation of stage 3 human tonsillar innate lymphoid cell 3 into NK cells.32 Based on our findings, we propose a model that AHR regulates NK cells development at 2 stages: first regulating the expression of KIT during early stem cell differentiation toward NK-cell precursors and later cooperating with Stat3 to control CD56 expression as the NK cells acquire a more mature phenotype.
Mechanism of NK-cell suppression by AHR agonist
Subversion of the antitumor function of NK cells by cancer cells is an important process in tumor progression and metastasis.21 Endogenous AHR ligands such as Kyn and KA products of altered Trp metabolism are implicated in immune suppression and evasion.12 However, the mechanism by which AHR agonist suppress the function of NK cells remains largely unknown. Here, we confirm that NK cells treated with an AHR agonist lead to AHR signaling and suppressed lytic function of NK cells. Interestingly, treatment of NK cells with Kyn/KA had no impact on proliferation or induced apoptosis of NK cells. RNA-seq analysis of agonist-treated NK cells revealed that AHR activation alters the expression of genes that are associated with oxidative stress and cellular metabolism.
Tumor cells and myeloid-derived suppressor cells (MDSCs) are principal sources of the Trp-metabolizing enzymes IDO and TDO in the tumor microenvironment (TME).42,43 IDO and TDO suppress immune cell function through depletion of Trp and generation of Trp metabolites, but the mechanism by which these metabolites suppress immune function is unclear. AHR ligands such as TCDD have been shown to promote the production of reactive oxygen species (ROS) by uncoupling electron transfer in microsomes isolated from liver extracts.44 In addition, there is evidence that elevated levels of Trp metabolites resulting from IDO expression cause cellular damage associated with increased levels of intracellular ROS in many pathologic conditions.45
The regulation of redox homeostasis is fundamental to maintaining normal cellular functions and ensuring cell survival. Moreover, there is an intimate connection between cellular metabolism and oxidative stress. Free radicals that are byproducts of mitochondrial respiration and cellular metabolism can severely compromise the function of cells by damaging DNA and protein. Oxidative stress occurs because of an imbalance between generation and elimination of ROS. Activated T cells undergoing clonal expansion dramatically raise their bioenergetic needs, increasing their glucose and glutamine utilization.46,47 This, in turn, increases the generation of ROS, which triggers an antioxidative glutathione (GSH) response to prevent cellular damage, suggesting that antioxidant enzymes like GSH are essential for effector T-cell functions.48 Similarly, there is now evidence that impaired cellular metabolism attenuates NK-cell function in chronic diseases and cancer.49,50 Excessive ROS production is linked to NK-cell dysfunction in patients with metastatic breast cancer.51 Moreover, Kyn-mediated oxidative stress can lead to defects in memory CD4 T cells during HIV-1 infection.52 Similarly, reactive nitrogen species can affect the function of cells; we previously reported that the production of nitric oxide by MDSCs leads to the nitration of key signaling proteins suppressing NK-cell functions in tumors.21
Thus, immune cells need to regulate antioxidant enzymes to protect them from oxidant-induced injury. Activated NK cells have been shown to resist oxidant-induced cell death by increasing the expression of antioxidant enzymes like TXN.53,54 Here, our ChIP data suggest that AHR can potentially control the expression of genes involved in the regulation of antioxidant enzymes, PPP, and iron transport by binding to XRE sites on gene promoters. Antioxidant enzymes such as NQO1 and TXN play a key role in mitigating the toxic effect of free radicals, including ROS. The PPP runs in parallel to glycolysis, oxidizing glucose to generate large quantities of NADPH, a critical cofactor in reducing glutathione disulfide into the antioxidant glutathione.55 In addition, iron is an important component in the regulation of metabolic homeostasis, and ferritin heavy chain (FTH) downregulation has been shown to increase the susceptibility of cancer cells to NK-cell recognition.56
IDO and TDO overexpression is associated with poor survival outcome in the number of malignancies including lymphomas.14,15 Altered Trp metabolism, which leads to the production of suppressive molecules like Kyn, has been linked to immune dysfunction.6-8 Based on our findings, we propose that AHR ligands (Kyn/KA) may induce a stress response that perturbs cellular homeostasis, attenuating the lytic function of NK cells. However, more studies are required to rigorously test this concept.
NK cell–based therapies hold great promise, but high levels of suppressive molecules like Kyn can dampen their response. The recent failure of IDO inhibitors suggest that new strategies are required to overcome immune suppression. This study provides a strong rationale for generating NK cells that lack AHR to overcome immune suppression imposed by AHR ligands in the TME. In summary, we provide evidence that AHR functions as a key transcriptional factor that plays a pivotal role in the development and function of human NK cells.
Acknowledgments
The authors thank members of the Institute for Genomic Medicine (IGM) at Nationwide Children's Hospital (NCH) for help with A seq analysis.
This work is supported by National Institutes of Health/National Cancer Institute grant U54-CA232561 to D.A.L.
Authorship
Contribution: P.T., J.E.M., A.T., A.R.C., J.A.F., E.E., and N.C. performed experiments and collected and analyzed the data; P.T. and D.A.L. designed the experiments and wrote and edited the manuscript; and J.R.F. and E.R.M. performed RNA-sequencing and analyzed the data.
Conflict-of-interest disclosure: D.A.L. reports patents, ownership interest in Courier Therapeutics, and ownership interest, research funding, royalties, consulting fees, and advisory board membership with Kiadis Pharma unrelated to this work. P.T., J.E.M., A.T., and N.C. received licensing fees for intellectual property from Kiadis Pharma unrelated to this work. J.A.F. has licensing agreements and received licensing fees from Kiadis and EMD Millipore unrelated to this work. The remaining authors declare no competing financial interests.
Correspondence: Dean A. Lee, Cellular & Cancer Immunotherapy Program, Center for Childhood Cancer & Blood Diseases, WA-4112 Abigail Wexner Research Institute, Nationwide Children’s Hospital, 700 Children's Dr, Columbus, OH 43205; e-mail: dean.lee@nationwidechildrens.org.

