

Key Points
The PVI score can help distinguish between ITP and nonimmune thrombocytopenia.
Patients with thrombocytopenia and a high PVI score had a high likelihood of having the diagnosis of ITP.

Abstract
Fluctuations in platelet count levels over time may help distinguish immune thrombocytopenia (ITP) from other causes of thrombocytopenia. We derived the platelet variability index (PVI) to capture both the fluctuations in platelet count measurements and the severity of the thrombocytopenia over time. Raw PVI values, ranging from negative (less severe thrombocytopenia and/or low fluctuations) to positive (more severe thrombocytopenia and/or high fluctuations) were converted to an ordinal PVI score, from 0 to 6. We evaluated the performance characteristics of the PVI score for consecutive adults with thrombocytopenia from the McMaster ITP Registry. We defined patients with definite ITP as those who achieved a platelet count response after treatment with intravenous immune globulin or high-dose corticosteroids and possible ITP as those who never received ITP treatment or did not respond to treatment. Of 841 patients with thrombocytopenia, 104 had definite ITP, 398 had possible ITP, and 339 had non-ITP thrombocytopenia. For patients with definite ITP, the median PVI score was 5 [interquartile range (IQR) 5, 6] for patients with possible ITP, the median PVI score was 3 (1, 5); and for patients with non-ITP thrombocytopenia, the median PVI score was 0 (0, 2). A high PVI score correlated with the diagnosis of definite ITP even when calculated at the patient’s initial assessment, before any treatment had been administered. Platelet count fluctuations alone contributed to the specificity of the overall PVI score. The PVI score may help clinicians diagnose ITP among patients who present with thrombocytopenia for evaluation.
Introduction
Immune thrombocytopenia (ITP) is an autoimmune blood disorder characterized by a low platelet count and an increased risk of bleeding.1,2 In adults, ITP tends to be a chronic disease with a prevalence of 12.1 (95% confidence interval [CI], 11.1-13.0) per 100 000 adults.3 Establishing ITP as the cause of the thrombocytopenia can be challenging because there is no reliable biomarker that can differentiate ITP from non-immune thrombocytopenic disorders such as splenomegaly, or inherited thrombocytopenias; thus, ITP remains a diagnosis of exclusion, which often leads to misdiagnosis in clinical practice.4
The defining characteristic of ITP is a platelet count below 100 × 109/L, and the severity of the thrombocytopenia is an indicator of the severity of the disease.5 From a cohort of patients with ITP, we observed that the platelet count levels tended to fluctuate throughout a patient’s disease course even without treatment.6,7 Fluctuations in platelet count level may be less evident in patients with non-immune thrombocytopenic disorders.8,9 Similarly, in healthy individuals, platelet count levels typically remain stable over time.10 Thus, we hypothesized that platelet count fluctuations, or platelet variability over time may be an indicator of the ITP diagnosis.
The development of a measure that can capture platelet variability was based on the concept of statistical volatility that is used to describe the degree of variation in financial markets as measured by the standard deviation of the logarithmic of the raw financial returns.11,12 Based on those principles, we derived a metric called the platelet variability index (PVI) to capture both the fluctuations in platelet count measurements over time and the severity of the thrombocytopenia. In this report, we describe the derivation of the PVI and its diagnostic application to a cohort of patients referred to a hematologist for evalutation of thrombocytopenia.
Methods
Adult patients (>18 years) who were enrolled in the McMaster ITP registry between January 2010 and January 2020 with at least 1 platelet count measurement available were included in this cohort study. The registry enrolled consecutive patients from a specialty hematology clinic at McMaster University who were referred for investigation of thrombocytopenia because of a platelet count <150 × 109/L.4,13 Patients were followed every 6 to 12 months until discharge from the clinic or death, and all patients provided consent for their data to be used in emerging research. This study was approved by the Hamilton Integrated Research Ethics Board.
The diagnosis of ITP was established based on the accepted criterion of a platelet count <100 × 109/L with no apparent cause14 and confirmed by 2 hematologists (D.M.A. and J.G.K.) working in the clinic. For this study, we defined the subgroup of patients with definite ITP as those with a documented platelet count response after treatment with high-dose IV immune globulin (IVIG) or high-dose corticosteroids.15 We defined a platelet count response as doubling of baseline and achievement of a platelet count ≥30 × 109/L per accepted criteria.16 Patients with possible ITP had never received treatment or did not achieve a platelet count response after treatment. Patients with non-ITP had nonimmune thrombocytopenia attributed to other conditions known to result in a low platelet count because of reduced platelet production or platelet sequestration, including myelodysplastic syndrome, liver disease, splenomegaly, or familial thrombocytopenia.17
Derivation of the PVI
We devised a statistical measure that combined platelet fluctuations over time and the severity of the thrombocytopenia into a composite index called the PVI. We used root sum squares18 to capture the variations in platelet count levels and variations in the changes between consecutive platelet count levels over time. Because platelet count fluctuation is influenced by the lowest platelet count value (eg, the lower the platelet count, the higher the possible fluctuation), we also included severity of the thrombocytopenia in the PVI measure. We used a general exponential function19 with a base parameter between 0 and 1 to the power of the lowest platelet count value to describe the thrombocytopenia severity over time. Hence, as the value of the lowest platelet count level decreased, the value of the general exponential function increased, indicating a higher level of thrombocytopenia severity. The optimal base parameter in the general exponential function for the population under investigation was determined by testing a sequence of base parameters from 0 to 1 in increments of 0.05, and selecting the base parameter that yielded the best separation in the area under the curve (AUC) between ITP and non-ITP patients. For this study, we calculated that 236 patients would allow us to detect a 10% difference between the AUC under the null hypothesis (AUC0 = 75%) and the alternative hypothesis (AUC1 = 85%) using a 2-sided z-test at 2.5% significant level and 80% power.20 Using that sample, we determined that the optimal base parameter for the general exponential function component of the PVI was 0.8.
Although the PVI can be calculated for any patient with at least 1 platelet count value, 3 or more platelet count values for any given patient were needed to measure platelet count fluctuations; thus, when fewer than 3 platelet count values were available, the PVI reflected only the thrombocytopenia severity; and when 3 or more platelet count values were available, the PVI captured both platelet count fluctuation and severity of the thrombocytopenia. The PVI can remain constant or increase over time (but cannot decrease) as new platelet count values are accumulated. The mathematical derivation of the PVI is shown in Appendix A of the supplemental material. An example of how the PVI is calculated over time with accumulating platelet count measurements in a patient with thrombocytopenia is provided in Figure 1.
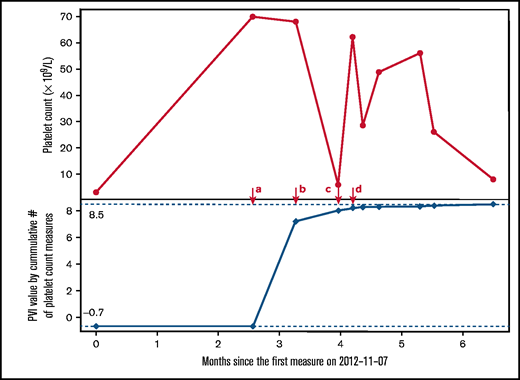
Illustrative example of the platelet variability index (PVI) over time in a patient referred for investigation of thrombocytopenia. At timepoint a, 2 platelet count values were available ( 3 × 10⁹/L and 70 × 109/L) and the lowest platelet count value was 3 × 10⁹/L; thus, the PVI was calculated by log(0.83) = -0.7. At timepoint b, the third platelet count (67 × 109/L) was added, which allowed for the measurement of platelet count fluctuation to be included into the overall PVI calculation, measured as log(0.83 × 2630.2) = 7.2. At timepoint c, the fourth platelet count was added (7 × 10⁹/L) and the fluctuation component increased; thus, PVI at this timepoint was log(0.83 × 5892.9) = 8.0, translating to a PVI score of 5 (high likelihood of definite ITP). After timepoint d, the lowest platelet count did not change and further changes in platelet count fluctuations were relatively small; hence, the PVI value remained stable.
Illustrative example of the platelet variability index (PVI) over time in a patient referred for investigation of thrombocytopenia. At timepoint a, 2 platelet count values were available ( 3 × 10⁹/L and 70 × 109/L) and the lowest platelet count value was 3 × 10⁹/L; thus, the PVI was calculated by log(0.83) = -0.7. At timepoint b, the third platelet count (67 × 109/L) was added, which allowed for the measurement of platelet count fluctuation to be included into the overall PVI calculation, measured as log(0.83 × 2630.2) = 7.2. At timepoint c, the fourth platelet count was added (7 × 10⁹/L) and the fluctuation component increased; thus, PVI at this timepoint was log(0.83 × 5892.9) = 8.0, translating to a PVI score of 5 (high likelihood of definite ITP). After timepoint d, the lowest platelet count did not change and further changes in platelet count fluctuations were relatively small; hence, the PVI value remained stable.
The PVI score
PVI is a continuous variable that ranges from a negative value (less severe thrombocytopenia and/or low fluctuations) to a positive value (more severe thrombocytopenia and/or high fluctuations). The PVI value was converted into a 7-point ordinal score for simplicity, similar to other grading systems.21 The interval of each score level was determined based on the best discriminative ability using AUC for the definite ITP diagnosis.22 Because the distribution of PVI was skewed (supplemental Figure 1), the PVI intervals that provided the best discriminative power for the diagnosis of ITP were (−∞, −10) = PVI score of 0, (−10, −5) = 1, (−5, 0) = 2, (0, 5) = 3, (5, 8) = 4, (8, 12) = 5, and (12, +∞) = 6. In general, a higher PVI score indicated larger fluctuations and greater severity of thrombocytopenia over time. We calculated the PVI scores for patients with definite ITP, possible ITP, and non-ITP diagnoses.
Statistical methods
Continuous variables were reported as means and standard deviations or median and interquartile range (IQR). Categorical variables were reported as frequencies and proportions. We compared the distributions of the PVI values among patients with ITP and non-ITP. For the full cohort, we modeled the association between PVI and the ITP diagnosis using a logistic regression model and calculated sensitivity, specificity, predictive values, and AUC with corresponding 95% CIs.23 We determined the stratum-specific likelihood ratio for each PVI score with 95% CIs24 to distinguish between patients with definite ITP, possible ITP, and non-ITP. We conducted a conditional logistic regression model to evaluate the effect of the PVI score among patients with similar numbers of platelet count measurements available (<3, 3-10, and >10 platelet counts). All analyses and modeling were performed using the R language for statistical computing.25
Results
Patient characteristics
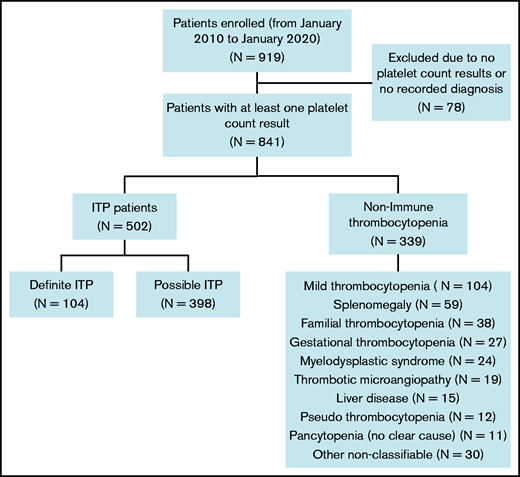
Of 919 patients with thrombocytopenia from the McMaster ITP Registry, 841 (91.5%) with at least 1 platelet count result available and a documented diagnosis were included in the analysis (Figure 2). Of those, 502 (59.7%) had ITP, including 104 (20.7%) with definite ITP and 398 (79.3%) with possible ITP. Patients with non-ITP thrombocytopenia (n = 339) had the following diagnoses: mild thrombocytopenia only (platelet counts between 100 and 150 × 109/L; n = 104); splenomegaly (n = 59); familial thrombocytopenia (n = 38); gestational thrombocytopenia (n = 27); myelodysplastic syndrome (n = 24); thrombotic microangiopathy (n = 19); liver disease (n = 15); pseudothrombocytopenia (n = 12); pancytopenia with no evident cause (n = 11); and other (n = 30).
Median age at enrollment was 54.5 years (IQR 36.0, 68.0) for patients with ITP (n = 502) and 54.0 years (37.0, 67.0) for patients with non-ITP (Table 1). Median platelet count nadir was 16 × 109/L (IQR 3, 46) and 78 × 109/L (IQR 43.5, 113), respectively. For patients with ITP, median disease duration was 5.6 years (IQR 1.9, 11.1) from diagnosis to the end of follow-up, and 375 patients (74.7%) had received prior ITP treatments. The median number of platelet count measurements per patient was 17 (IQR 7, 42) for patients with ITP and 8 (IQR 4, 21) for patients with non-ITP.
Demographics of patients with ITP and non-ITP thrombocytopenia syndromes
| ITP | Non-ITP | |||
|---|---|---|---|---|
| Definite ITP subgroup | Possible ITP subgroup | Total | n= 339 | |
| (n = 104) | (n = 398) | (n = 502) | ||
| Age at enrollment, y; median (IQR) | 52.5 (34.8, 67.0) | 55.0 (36.0, 68.8) | 54.5 (36.0, 68.0) | 54.0 (37.0, 67.0) |
| Female, n (%) | 64 (61.5) | 231 (58.0) | 295 (58.8) | 172 (50.7) |
| Received previous ITP treatment, n (%) | 104 (100.0) | 271 (68.1) | 375 (74.7) | 75 (22.1) |
| Follow-up, y; median (IQR) | 9.8 (5.3, 13.0) | 4.2 (1.5, 10.1) | 5.6 (1.9, 11.1) | 3.7 (1.3, 8.4) |
| Nadir platelet count (median, IQR) ×109/L | 3 (1, 10) | 23 (5, 58) | 16 (3, 46) | 78 (44, 113) |
| Platelets <20 × 109/L ever, n (%) | 62 (59.6) | 148 (37.2) | 210 (41.8) | 25 (7.4) |
| Number of platelet count measures per patient | 54.0 (30.0, 85.3) | 12.0 (5.0, 28.8) | 17.0 (7.0, 41.8) | 8.0 (4.0, 21.0) |
Definite ITP was defined as patients with ITP who had a documented response to intravenous immune globulin, prednisone, or dexamethasone. A treatment response was defined as doubling of the baseline platelet count and having at least 1 measure of platelet counts above 50 × 109/L within 4 weeks after treatment.
PVI
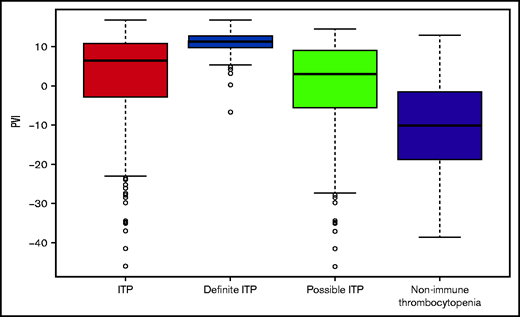
The PVI index was calculated for each patient using all available platelet counts (Table 2). The median PVI was significantly higher for patients with ITP (6.4; IQR −2.9, 10.7) compared with patients with non-ITP (−10.5; IQR −18.8, −1.6; P < .001), which translated to a median PVI score of 4 vs 0, respectively (Figure 3). For the diagnosis of ITP, the PVI had a sensitivity of 70.3% (95% CI, 66.3-74.3) and specificity of 77.6% (73.1-82.0), positive predictive value was 82.3% (78.7-85.9), negative predictive value was 63.8% (59.2-68.5), and AUC of 80.0% (77.0-83.0). For the diagnosis of definite ITP, the sensitivity of the PVI was 98.1% (95% CI, 95.4-100), and specificity was 86.1% (82.5-89.8) (Table 3). The positive predictive value was 68.5% (61.0-75.9), negative predictive value of 99.3% (98.4-100), and AUC of 96.8% (95.3-98.2).
PVI by disease category
| At initial assessment | At final assessment | |||
|---|---|---|---|---|
| Diagnosis | PVI | PVI score | PVI | PVI score |
| (Continuous; median, IQR) | (0-6; median, IQR) | (Continuous; median, IQR) | (0-6; median, IQR) | |
| ITP (entire cohort) | 0.5 (−8.1, 8.9) | 3 (1, 5) | 6.4 (−2.9, 10.7) | 4 (2, 5) |
| Definite ITP | 8.9 (5.8, 11.0) | 5 (4, 5) | 11.1 (9.7, 12.7) | 5 (5, 6) |
| Possible ITP | −1.1 (−10.3, 7.3) | 2 (0, 4) | 3.0 (−5.6, 9.0) | 3 (1, 5) |
| Non-immune TCP | −14.3 (−21.7, −4.9) | 0 (0, 2) | −10.5 (−18.8, −1.6) | 0 (0, 2) |
| Splenomegaly | −14.1 (−18.9, −5.6) | 0 (0, 1.5) | −9.8 (−16.6, −2.6) | 1 (0, 2) |
| Liver disease | −8.5 (−10.2, 1.5) | 1 (0, 3) | −0.9 (−4.7, 2.1) | 2 (2, 3) |
| Familial TCP | −11.7 (−17.4, −4.5) | 0 (0, 2) | −7.0 (−12.0, −2.0) | 1 (0, 2) |
| MDS | -1.5 (−11.0, 2.1) | 2 (0.8, 3) | 1.7 (−1.9, 4.4) | 3 (2, 3) |
PVI scores and associated PVI values: 0 (–∞, –10); 1 (–10, –5); 2 (−5, 0); 3, (0, 5); 4 (5, 8); 5 (8, 12); 6 (12, +∞). Brackets are inclusive of the value limit.
MDS, myelodysplastic syndrome; TCP, thrombocytopenia.
Operating characteristics of the PVI for patients with definite ITP
| Operating characteristics | PVI | PVI score |
|---|---|---|
| (Continuous variable) | (Ordinal score 0-6) | |
| Sensitivity (95% CI) | 98.1% (95.4-100) | 93.3% (88.5-98.1) |
| Specificity (95% CI) | 86.1% (82.5-89.8) | 89.4% (86.1-92.7) |
| Positive predictive value (95% CI) | 68.5% (61.0-75.9) | 72.9% (65.4-80.5) |
| Negative predictive value (95% CI) | 99.3% (98.4-100) | 97.7% (96.1-99.4) |
| AUC (95% CI) | 96.8% (95.3-98.2) | 96.2% (94.5-97.7) |
PVI score
For each stepwise increase in PVI score, we observed a corresponding increase in the proportion of patients with definite ITP (Table 4). The PVI score had a sensitivity of 93.3% (95% CI, 88.5-98.1) and a specificity of 89.4% (86.1-92.7) for the diagnosis of definite ITP. The positive predictive value was 72.9% (95% CI, 65.4-80.5), negative predictive value was 97.7% (96.1-99.4), and the AUC was 96.2% (94.5-97.7). A similar increase in the proportion of patients with possible ITP was observed with increasing PVI scores (Table 4). Illustrative examples of the platelet count levels over time and the associated PVI scores for patients with ITP and non-ITP diagnoses are shown in Figure 4.
Stratum-specific likelihood ratios of the PVI score for patients with definite and possible ITP
| Definite ITP | |||||
|---|---|---|---|---|---|
| PVI score | PVI interval | Definite ITP | Non-ITP | Proportion with definite ITP | Stratum-specific likelihood ratios (95% CI) |
| (n = 104) | (n = 339) | ||||
| 0 | PVI ≤ −10 | 0 | 172 | 0/172 (0.0%) | LR− = 0 (0-0) |
| 1 | −10 < PVI ≤−5 | 1 | 45 | 1/46 (2.2%) | SSLR+ = 0.07 (0.01-0.36) |
| 2 | −5 < PVI ≤ 0 | 0 | 47 | 0/47 (0.0%) | SSLR+ = 0 (0-0) |
| 3 | 0 < PVI ≤ 5 | 6 | 39 | 6/45 (13.3%) | SSLR+ = 0.5 (0.23-1.12) |
| 4 | 5 < PVI ≤ 8 | 8 | 14 | 8/22 (36.4%) | SSLR+ = 1.86 (0.82-4.22) |
| 5 | 8 < PVI ≤ 12 | 52 | 20 | 52/72 (72.2%) | SSLR+ = 8.47 (5.34-13.44) |
| 6 | PVI > 12 | 37 | 2 | 37/39 (94.9%) | SSLR+ = 60.3 (17.08-212.88) |
| Possible ITP | |||||
|---|---|---|---|---|---|
| PVI score | PVI interval | Possible ITP | Non-ITP | Proportion with possible ITP | Stratum-specific likelihood ratios (95% CI) |
| (n = 398) | (n = 339) | ||||
| 0 | PVI ≤ −10 | 57 | 172 | 57/229 (24.9%) | LR− = 0.28 (0.22-0.37) |
| 1 | −10 < PVI ≤−5 | 44 | 45 | 44/89 (49.4%) | SSLR+ = 0.83 (0.57-1.23) |
| 2 | −5 < PVI ≤ 0 | 62 | 47 | 62/109 (56.9%) | SSLR+ = 1.12 (0.79-1.59) |
| 3 | 0 < PVI ≤ 5 | 60 | 39 | 60/99 (60.6%) | SSLR+ = 1.31 (0.9-1.9) |
| 4 | 5 < PVI ≤ 8 | 51 | 14 | 51/65 (78.5%) | SSLR+ = 3.1 (1.76-5.46) |
| 5 | 8 < PVI ≤ 12 | 87 | 20 | 87/107 (81.3%) | SSLR+ = 3.71 (2.34-5.86) |
| 6 | PVI > 12 | 37 | 2 | 37/39 (94.9%) | SSLR+ = 15.76 (4.42-56.22) |
LR−, likelihood ratio for a negative result; SSLR+, stratum-specific likelihood ratio for a positive result within the stratum indicated.
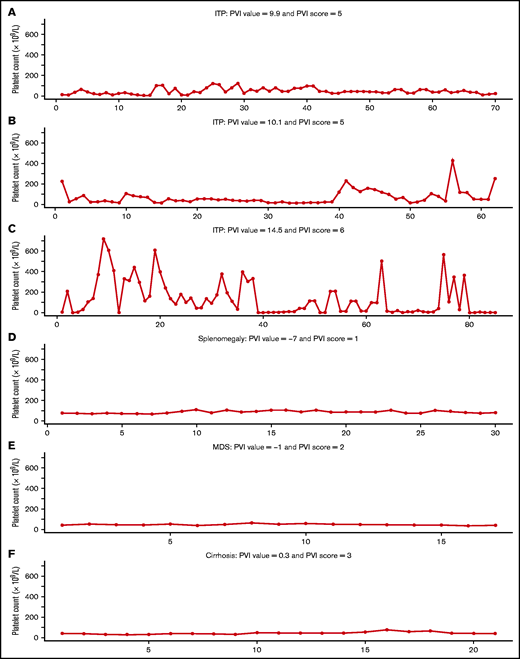
PVI score for 6 patients with thrombocytopenia because of ITP (A-C) and non-ITP thrombocytopenia (D-F).
PVI score for 6 patients with thrombocytopenia because of ITP (A-C) and non-ITP thrombocytopenia (D-F).
PVI score at initial assessment
We determined the PVI score for patients on the day of enrollment into the registry to simulate a new hematology referral for a patient referred for evaluation of thrombocytopenia. Of the 837 evaluable patients at the time of enrollment, 542 (64.8%) had never received ITP treatment. The median initial PVI score was 5 (IQR 4,5) for patients who were ultimately diagnosed with definite ITP (n = 104; 12.4%), 2 (0,4) for patients with possible ITP (n = 397; 47.4%), and 0 (0,2) for patients with non-ITP thrombocytopenia (n = 336; 40.1%). The PVI score was similar for patients with primary ITP and secondary ITP (median score 3 [1-5]); for example, among the 12 patients with drug-induced ITP, the median PVI score was 4 (2,5) at initial assessment. At the time of initial assessment, the PVI score had a sensitivity of 97.1% (95% CI, 93.9-100), specificity of 74.1% (69.4-78.8), positive predictive value of 53.7% (46.6-60.9), negative predictive value of 98.8% (97.5-100), and AUC of 91.8% (88.9-94.7) for the diagnosis of definite ITP (Table 2). Of the 837 evaluable patients at the time of enrollment, 609 (71.9%) had 3 or more platelet counts; thus, the PVI value was a function of both the thrombocytopenia severity and platelet count fluctuations.
We evaluated the initial PVI score for the subgroup of patients who had never received treatment (n = 542). Of those, 14 (2.5%) were ultimately diagnosed with definite ITP; 238 (43.9%) were diagnosed with possible ITP and 290 (53.5%) had non-ITP thrombocytopenia. Initial PVI scores for each of these groups were 3 (2,5), 1 (0,2), and 0 (0,1), respectively. Among this cohort, the PVI score had a sensitivity of 92.9% (95% CI, 66.1-99.8), a specificity of 83.1% (78.3-87.2), a positive predictive value of 21.0% (16.5-26.3), a negative predictive value of 99.6% (97.3-99.9), and an AUC of 89.4% (80.6-98.3) for the diagnosis of definite ITP at the time of enrollment. After controlling for the number of platelet count measurements, the PVI score had a sensitivity of 85.7% (95% CI, 67.4-100), a specificity of 86.6% (82.6-90.5), a positive predictive value of 23.5% (11.9-35.2), a negative predictive value of 99.2% (98.1-100), and an AUC of 91.2% (85.0-97.4) for the diagnosis of definite ITP.
Contribution of platelet count fluctuation to the overall PVI score
To determine the contribution of each of the components of the PVI (platelet count fluctuation and severity of thrombocytopenia), we evaluated the diagnostic performance of platelet count fluctuation alone, thrombocytopenia severity alone or both combined into the overall PVI. The sensitivities of each component for the diagnosis of definite ITP (compared with non-ITP) were: fluctuation alone, 97.1% (95% CI, 93.9-100); severity alone, 92.3% (95% CI, 87.2-97.4); and overall PVI, 98.1% (95% CI, 95.4-100). Specificities were 83.2% (79.2-87.2), 87.3% (83.8-90.9), and 86.1% (82.5-89.8), respectively.
To demonstrate the contribution of platelet fluctuations to the overall PVI score, we calculate the PVI score for patients with moderately reduced platelet count nadirs (between 30 and 60 × 109/L). In this subgroup of 149 patients, the median PVI score was 3 (IQR 3, 3) for patients who were ultimately diagnosed with definite ITP (n = 5; 3.4%), 2 (2,3) for patients with possible ITP (n = 83; 55.7%), and 2 (2,3) for patients with non-ITP (n = 61; 40.9%). Among this cohort with similar platelet count nadirs, the overall PVI had a sensitivity of 80% (95% CI, 44.9-100), specificity of 95.1% (89.7-100), positive predictive value of 57.1% (20.5-93.8), negative predictive value of 98.3% (95.0-100), and AUC of 91.1% (77.2-100) for the diagnosis of definite ITP.
Number of platelet count measurements needed for the PVI
To determine the optimal number of platelet count measurements required to calculate the PVI, we examined the AUC and 95% CI for patients with definite ITP using varying numbers of platelet count values per patient (supplemental Figure 2). The AUC increased from 67% with 1 platelet count measurement to 80% with 3 platelet count measurements. With 8 or more platelet count measurements, the lower bound of the 95% CI for AUC was >85% for definite ITP.
Discussion
In this study, we describe a novel metric to characterize patients with thrombocytopenic disorders. The PVI (reported as a continuous scale) or PVI score (reported as an ordinal scale) reflects the degree of platelet fluctuations over time and the severity of the thrombocytopenia. We showed that the PVI score can provide additional information to help clinicians arrive at a diagnosis of ITP. Higher PVI scores correlated with the diagnosis ITP, especially among patients who had demonstrated a platelet count response following ITP treatments (definite ITP). In that group, the sensitivity and specificity of the PVI score for the diagnosis of definite ITP was 93.3% and 89.4%. Even when the PVI score was determined at the time of initial evaluation and before any treatment had been given (64.8% patients were treatment-naïve patients at the time of enrollment), the PVI score had a sensitivity and specificity of 97.1% and 74.1% for the diagnosis of definite ITP. The PVI score was also helpful in differentiating ITP vs non-ITP thrombocytopenia with high specificity in the group of patients with moderately reduced platelet count levels (30-60 × 109/L), which is commonly the group in which the diagnosis is most uncertain; however, sensitivity was only 80%. The PVI measure consists of 2 components: the degree of platelet count fluctuation and the severity of the thrombocytopenia. We showed that both components contributed to the performance of the overall PVI score.
Other biomarkers have been investigated to distinguish ITP from other causes of thrombocytopenia. Platelet autoantibodies targeting platelet glycoprotein (GP) receptors have been studied extensively over the past several decades. In a systematic review of prospective studies that tested for antibodies directly bound to the platelet surface, the sensitivity of platelet autoantibodies, either anti-GPIIbIIIa or anti-GPIbIX, for the diagnosis of ITP was 53% and 90%, respectively.26 In a recent evaluation of platelet antibody testing in which the analysis was restricted to patients who fulfilled established clinical14 and testing criteria,27 sensitivity and specificity of platelet antibody testing was 90% and 78%, respectively. This high sensitivity was not consistent across other studies.26 Furthermore, platelet antibody testing using recommended methods is not widely available and has not been adopted into clinical practice.
Immature platelet fraction was recently evaluated in a retrospective study of 272 children. In that study, a high immature platelet fraction (>8.45%) discriminated between ITP and other causes of thrombocytopenia, with a sensitivity of 80.4% and specificity of 79.9%.28 Similar findings have been reported in adults.29,30 Platelet activation has also been compared between groups of patients with thrombocytopenic syndromes. In a study of platelet aggregometry adjusted for platelet count, patients with ITP had increased expression of bound fibrinogen and CD63 following activation, compared with patients who had thrombocytopenia in the context of cancer.31 The performance characteristics of the PVI was similar or better than these other biomarkers and could be assessed simply based on routine platelet count values, which are typically available at the time of a new hematology referral. Furthermore, the PVI is a dynamic measure whose accuracy improves as more platelet count values accumulate over time. It is likely that other variables will be needed in conjunction with the PVI to develop a robust clinical prediction model.
The cause of platelet count instability in patients with ITP is likely related to immune dysregulation caused by autoantibodies, cellular cytotoxicity, complement, or other immunological pressures causing premature platelet destruction or impaired platelet production.2,32-34 Rapid platelet count changes have been observed in patients with ITP in the setting of infection, vaccinations, or other immune stimuli.35 Conversely, patients with thrombocytopenia from nonimmune causes tend to have stable platelet count levels, and the thrombocytopenia is related to a new equilibrium in circulating platelet numbers that balance platelet removal, sequestration, and reduced platelet production. For example, platelet count levels in patients with cirrhosis are lower than normal because of increased sequestration in an enlarged spleen and/or decreased production due to reduced levels of endogenous thrombopoietin.8,9
We used patients with definite ITP as the gold standard for this validation study. These patients demonstrated a platelet count response to ITP-specific treatments and were identified as having ITP based on the best available information after consensus of 2 experienced hematologists. This criterion has previously been used in a blinded agreement study15 and endorsed in a recent international consensus report.36 Platelet antibody tests were not used to categorize “definite” ITP because the low sensitivity26 and the poor correlation with IVIG response.37 Although a response to treatment is a useful marker to identify patients with ITP, it can only be used retrospectively and thus is not a useful criterion for the clinician evaluating a new patient with thrombocytopenia. In this study, we showed that the PVI score can serve as a surrogate for treatment response and help differentiate ITP from non-ITP patients based on historical platelet count values. For the PVI score to provide information on platelet fluctuation, at least 3 and ideally 8 platelet count measurements are needed. In this study, the vast majority of patients had 3 or more platelet counts at the time of enrollment into the registry, corresponding to the time of initial hematology assessment. Thus, for most patients presenting to a hematologist for the evaluation of thrombocytopenia, the PVI score is a feasible metric that reflects both the thrombocytopenia severity and platelet count fluctuation.
Strengths of this study are the immediate clinical need for a simple diagnostic tool that can be readily applied in practice. The concept of the PVI was based on observations and mathematical principles that have been used and widely tested in financial markets, where fluctuations are common. Limitations of the PVI is that it does not account for the time horizon over which the platelet count measurements were collected. The PVI would not be useful at differentiating ITP from cyclical thrombocytopenia, although, this rare thrombocytopenic syndrome may also have an immune mechanism.38 This study was done in an academic practice setting, and may not be generalizable to community clinics . Although the derivation of the PVI involved advanced mathematical functions, these can be programmed into a user-friendly application that is readily accessible.
In conclusion, this study highlights the concept of platelet count fluctuation as a feature that may distinguish ITP from other causes of thrombocytopenia. We described the derivation of the PVI score and how it may be applied in clinical practice. Further studies using the PVI score in conjunction with other patient variables is warranted to improve the diagnosis of ITP.
Acknowledgments
This study was funded by the Canadian Institute for Health Research (Funding Reference Number 165811)
Authorship
Contribution: N.L. and D.M.A. designed research, performed research, contributed vital new analytical tools, analyzed data, and wrote the paper; and N.M.H., I.N., and J.G.K. performed research, analyzed data, and critically edited the final version of the paper.
Conflict-of-interest disclosure: The authors declare no competing financial interests.
Correspondence: Donald M. Arnold, McMaster University, HSC 3V-50, 1280 Main St West, Hamilton, ON, Canada L8N 4K1; e-mail: arnold@mcmaster.ca.

