

Key Points
The activation status of NK cell subsets is affected by viral load and immune context.
Licensed NK cells dominate the antiviral response in mice after hematopoietic stem cell transplant.

Abstract
Natural killer (NK) cells are involved in innate defense against viral infection and cancer. NK cells can be divided into subsets based on the ability of different receptors to bind to major histocompatibility (MHC) class 1 molecules, resulting in differential responses upon activation in a process called “licensing” or “arming.” NK cells expressing receptors that bind self-MHC are considered licensed due to an augmented effector lytic function capability compared with unlicensed subsets. However, we demonstrated that unlicensed NK subsets instead positively regulate the adaptive T-cell response during viral infections that are related to localization and cytokine production. In this study, the differential effects of the two types of NK subsets were contingent on the environment in viral infection and hematopoietic stem cell transplantation (HSCT) models. Infection of mice with high-dose (HD) murine cytomegalovirus (MCMC) led to a loss of licensing-associated differences, as compared with mice with low-dose (LD) infection: the unlicensed NK subset no longer localized in lymph nodes (LNs), but instead remained at the site of infection. Similarly, the patterns observed during HD infection paralleled the phenotypes of both human and mouse NK cells in an HSCT setting where NK cells exhibit an activated phenotype. However, in contrast to the effects of subset depletion in T-cell replete models, the licensed NK cell subsets still dominated antiviral responses after HSCT. Overall, our results highlight the intricate tuning of NK cells and how it affects overall immune responses with regard to licensing patterns and their dependency on the level of stimulation and activation status.
Introduction
Natural killer (NK) cells are innate lymphocytes that participate in viral and cancer immune responses.1,2 As their name implies, they are classically associated with their cytotoxic effector function and are able to lyse (kill) virally infected or neoplastic target cells in a major histocompatibility (MHC)-unrestricted manner and without prior sensitization.1,2 More recently, we have begun to appreciate NK cells for their roles outside of just killing and even outside of viral infection and cancer.3-5 They produce a multitude of cytokines that can promote or dampen an immune response.6 Importantly, they have been found to both positively and negatively regulate the adaptive immune response.7,8 Waggoner et al showed that NK cells can target activated antigen-specific T cells after viral infection and limit their response.7 Interestingly, they also found that the consequence of this regulation on viral outcome could be attuned to the level of virus initially used to infect the mice.
NK cell function is governed by both inhibitory and activating receptors expressed on the cell surface.9 These receptors bind a variety of ligands, with the inhibitory receptors binding largely to MHC-class 1 molecules or MHC-class 1–like molecules. Therefore, for example, in a situation where a virally infected cell downregulates MHC expression to avoid T-cell recognition, it is primed for NK-cell recognition.10,11 There are several different inhibitory receptors, with the Ly49 family (mouse) and KIR family (human) being the best characterized, along with NKG2A, which is present in both species.12,13 These receptors are also stochastically expressed, and each has a varying affinity for the different haplotypes of MHC-class 1. The stochastic expression pattern of these receptors can therefore lead to a situation where an NK cell does not have an inhibitory receptor that binds to self–MHC-class 1 molecules. NK cells that do not receive the same inhibitory signals related to lack of receptors that bind to self-MHC develop in a less responsive state with regard to effector functions, which leads to the licensing hypothesis whereby NK cells with receptors that bind to self–MHC-class 1 are licensed and considered fully functional, whereas the NK cells without the receptor for binding to MHC-class 1 are termed unlicensed and are considered hyporesponsive compared with their licensed counterparts.14 The focus of our NK studies has been on these subsets, particularly on the different effector roles licensed and unlicensed NK cells may fulfill during a viral infection. There has been some work to identify the differential role of NK cell subsets during viral infection,8,15,16 but it remains unclear whether these findings can extend to multiple viral infection or cancer settings.
How different levels of activation may augment the differences between licensed and unlicensed NK cells also remains unclear, as strong activation can lead to enhanced function of unlicensed NK cells and alters surface Ly49 receptor expression. In our study, we sought to expand on our prior study in which we identified unlicensed NK cells as essential for indirectly promoting antigen-specific T-cell responses and to assess whether this effector role could be changed by using a higher dose of virus to infect the mice.8 We hypothesized that a higher dose of virus would lead to greater activation of unlicensed NK cells and a diminished difference between the contributions of these NK cell subsets to MCMV infection. We indeed found evidence to support our hypothesis, with high-dose (HD) infection leading to a loss of unlicensed NK cell influx into the lymph nodes (LNs) and an increase in overall NK cell activation and influx into the liver. In addition, depletion of licensed vs unlicensed NK cells led to no discernable effect on antigen-specific T-cell expansion or viral clearance in HD-infected mice. We also assessed low-dose (LD) infection in mice after a hematopoietic stem cell transplant (HSCT), because we had previously found the licensed NK cells to be more necessary for viral clearance than unlicensed cells in this model.17 Interestingly, despite using a lower dose of virus to induce infection, the NK cells in these mice behaved like NK cells from non-HSCT HD-infected mice. Overall, these results highlight how the environment can dictate the functional roles of licensed and unlicensed NK cells, with a strong stimulus leading to loss of licensing-associated differences.
Methods
Mice
Female C57BL/6 (H2b) mice that were 6 to 12 weeks old were purchased from Jackson Laboratory (Bar Harbor, ME). All mice were housed in American Association for Accreditation of Laboratory Animal Care–approved, specific-pathogen–free facilities with free access to food and water. All animal studies and protocols were approved by the UC Davis Institutional Animal Care and Use Committee (IACUC).
Viruses
The MCMV Smith strain was obtained from American Type Culture Collection (Manassas, VA) and maintained by repeated salivary gland passage. For LD MCMV studies, 2 × 10³ plaque-forming units (PFU) was administered intraperitoneally (IP) in 0.2 mL of RPMI (Gibco Laboratories, Grand Island, NY). For HD MCMV studies, 2 × 10⁴ PFU was administered IP in 0.2 mL of RPMI (Gibco Laboratories). Two days before infection, depletion was performed IP with 300 µg purified anti-Ly49G2 (4D11), anti-Ly49A (YE1/32), anti-Ly49C/I (5E6), or rat IgG in 0.2 mL of phosphate-buffered saline (PBS).
Syngeneic HSCT
Bone marrow cells (BMCs) were extracted from femurs, tibias, and vertebrae of donors by using a mortar and pestle. Donors had been treated with 300 μg of anti-NK1.1 monoclonal antibody (mAb; PK136 in 0.2 mL PBS) IP 2 days before HSCT, to remove donor NK cells. Single-cell suspensions of the harvested BMCs were then prepared and depleted of T cells by using an mAb against Thy1.2 (30H12) and rabbit complement. Recipients were exposed to a lethal dose of 950 to 1050 cGy of γ-irradiation from a 137Cs source. Directly after the irradiation, recipient mice were injected IV via the tail vein with the prepared syngeneic BMCs (5 × 10⁶ BMCs in 0.2 mL of PBS) from age- and sex-matched mice. Recovering NK cell populations were donor derived, based on the early time points after HSCT when the experiments were conducted. MCMV infection (2 × 10³ PFU) was performed at post-HSCT day 8, and flow immunophenotypes were analyzed at postinfection day 7 (day 15 after transplant).
Cell preparation and flow cytometry
Mice were euthanized at different time points after infection (as described in figure legends). Single-cell suspensions were prepared from the harvested livers, spleen, or LNs (brachial, axillary, and inguinal) in PBS with 1% fetal bovine serum. The cells were then incubated with Fc block 2.4G2 mAb or clone 93 to block nonspecific binding and stained with various combinations of fluorochrome-conjugated mAbs. Isotype-matched rat/mouse IgG mAbs were used as negative staining controls. Intracellular staining was performed with the Cytofix/Cytoperm Fixation/Permeabilization kit (BD, San Jose, CA). Stained cells were analyzed on an LSR Fortessa (BD) flow cytometer. Data analysis was performed with FlowJo software (Tree Star, Ashland, OR). Percentages and the total number of cells were determined for the different phenotypic markers and cell types studied.
Mouse antibodies
The following fluorochrome-conjugated mAbs were purchased from BioLegend (San Diego, CA): Pacific Blue-anti-CD45 (30-F11), anti-CD90.2 (Thy1.2; 30-H12), Alexa Fluor 647-anti-NK1.1 (PK136), biotin anti-Ly49H (3D10), cyanine 5-cytidine 3'5'bisphospate PCPCy5-strepavadin, phycoerythrin (PE)-Cy7-anti-CD3 (145-2C11), PE-anti-Ly49A (YE1/48.10.6), BV785-anti-CD3 (17A2), BV711-anti-CD4 (GK1.5), BV711-anti-CD4 (RM4-5), BV605-anti-CD8a (53-6.7), anti-CD11c (N418), and APC-anti-CD122 (TM-β1); from Becton Dickson (BD) Pharmingen: fluorescein isothiocyanate anti-Ly49G2 (4D11), anti-Ly49G2 (Cwy3), anti-CD8a (53-6.7), anti-NKG2A (20d5), PE-anti-Ly49C/I (5E6), anti-Ly49I (YLI-90), rIgG, anti-Ly49A (A1), and CD32+CD16 antibody (2.4G2) to block FCgII/III receptor–mediated nonspecific binding; and from eBioscience (San Diego, CA): anti-MHC class 2 (M5/114.15.2), and anti-CD4 (L3T4), PE-eFluor610-anti-NK1.1 (PK136), and PerCP-eFluor710-anti-Ly49G2 (4D11).
MCMV tetramer was provided by the NIH Tetramer Core Facility (Emory University, Atlanta, GA); MCMV MHC class I tetramer: H-2Db MHC allele with M45: 985-993 epitope conjugated with PE or AF488 fluorophore.
Viral titer determination
Quantification of MCMV using real-time polymerase chain reaction (PCR) was performed as previously described.18 In brief, for MCMV quantification, DNA was extracted from livers with the DNeasy Tissue Kit (Qiagen, Valencia, CA), and the MCMV IE1 gene was amplified with the HotStarTaq Master Mix Kit (Qiagen) and forward and reverse primers. Plasmid was purified and quantified, and serial 10-fold dilutions of the IE1-containing plasmid (concentrations ranged from 2 copies to 2 × 10⁹ copies) were amplified with the forward and reverse primers and a fluorogenic probe. A standard curve was constructed by plotting the cycle threshold value against the log of the target template molecules obtained from the plasmid, followed by a sum-of-least-squares regression analysis. Target copy numbers in the tissue samples were then calculated with the equation obtained by the least-squares regression analysis. Results were expressed as IE1 gene copies per 100 mg of tissue.
Cytometric bead array to measure serum cytokines
Serum cytokines interleukin-6 (IL-6), tumor necrosis factor (TNF), and interferon-γ (IFNγ) were quantified with reagents from BD Biosciences, including the Mouse/Rat Soluble Protein Master Buffer kit, according to the manufacturer’s instructions. In brief, serum samples were diluted 1:4 with the included assay diluent and mixed with capture beads specific for TNF and IL-6 and IFNγ. The PE detection reagent was added, and the samples were analyzed on a Fortessa Flow Cytometer. The resulting median fluorescence intensity (MFI) was used to calculate the cytokine levels in the serum as quantified in picograms per milliliter based on the standard curve. Values that did not fall into the range of the standard curve were entered as 0. The limit of detection for the IL-6, TNF, and IFNγ flex set kits was 1.4, 2.8, and 0.5 pg/mL, respectively.
Human haploidentical HSCT
Between November 2013 and May 2017, patients with hematologic malignancies were prospectively enrolled in a clinical study of T-cell–replete haploidentical HSCT with nonmyeloablative conditioning and HD posttransplant cyclophosphamide, as described previously.19,20 Blood samples were obtained from patients at days 28 to 40. Peripheral blood mononuclear cells (PBMCs) were cryopreserved after isolation from whole blood by using density gradient centrifugation (Lymphocyte Separation Medium; Corning Life Sciences) and red blood cell lysis. Samples were stored at −80°C until analysis by flow cytometry. The viability of the thawed cells ranged from 59% to 95%, and activation markers were examined on live cells. All patients and donors provided informed consent before enrollment, and the human HSCT study was approved by the Ethics Review Board of the Nantes University Hospital. The collection of whole blood from healthy donors to use as control samples was approved by the Institutional Review Board at the University of California, Davis (Protocol 2 18 204-9).
Flow cytometry anti-human antibodies
Cells were washed with PBS, incubated with Human TruStain Fc Receptor Blocking Solution (BioLegend, 422302), and stained with the following fluorochrome-conjugated monoclonal antibodies: CD3-FITC (clone HIT3a), CD56-PE (clone HCD56), PD-1-APC (clone EH12.2H7), CD69-BV711 (clone FN50), Ki-67-PE-Cy7, and CD45-BV510 (clone HI30; all from BioLegend) and (clone 20Raj1, eBioscience). Live/dead staining was performed with Fixable Viability Dye 780 (eBioscience).
Statistical analysis
Statistical significance of results was determined by using a 2-tailed Student t-test and a 1- or 2-way analysis of variance (ANOVA) with Tukey post hoc test, when appropriate (Prism software; GraphPad, San Diego, CA). Results were considered statistically significant when P < .05.
Results
HD MCMV infection leads to increased inflammation and NK activation
Prior work by our laboratory established different effector roles of licensed and unlicensed NK cells after primary acute MCMV infection (2 × 10³ PFU) in mice, with the licensed subsets serving as the dominant antiviral subset at the site of infection and the unlicensed populations trafficking to LNs to directly support dendritic cell activation and subsequent antiviral T-cell responses through differential cytokine production.8 Interestingly, in vitro dissection of the cytokine licensing pattern of the mouse NK cells was observed only when using resting, isolated, and nonactivated or ex vivo–expanded NK subsets, suggesting that the functions of licensing can be overridden with activation. NK cells can be divided into subsets with different effector roles during viral infection, including both antiviral and immunoregulatory roles.8 We therefore wanted to assess whether this paradigm occurs in vivo in the context of viral infection, by comparing NK effects with HD (2 × 10⁴ PFU) vs LD (2 × 10³ PFU) MCMV primary infection. A higher dose of viral inoculum led to a statistically significant increase in viral titers at day 7 compared with LD infection (Figure 1A). Strikingly, this significant increase in viral burden correlated with a significant increase in serum inflammatory cytokines compared with both naive uninfected and LD-infected mice (Figure 1B-D).
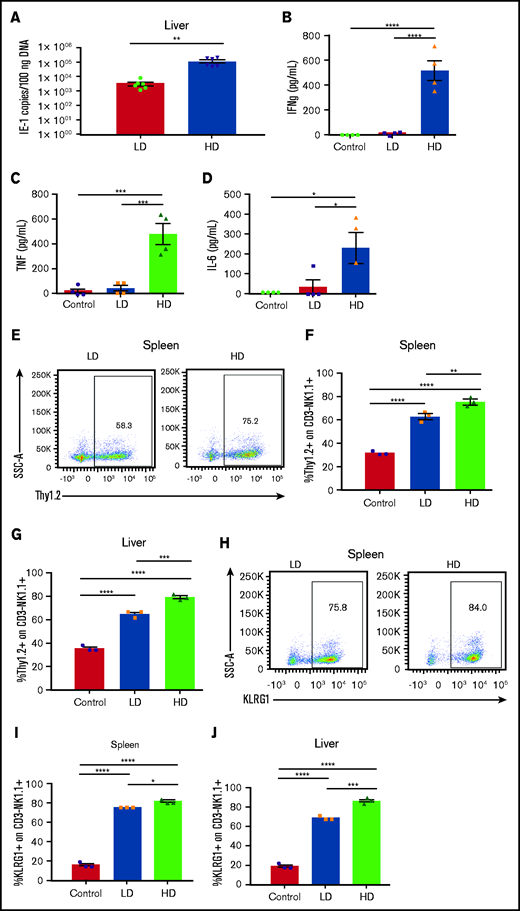
Viral load modulates NK cell activation and phenotype after acute MCMV infection. (A) Viral loads in livers of C57BL/6 mice at day 6 after LD (2 × 10³ PFU) or HD (2 × 10⁴ PFU) MCMV infection determined by quantitative PCR of the IE1 gene copy number per 100 ng of DNA. (B-D) Serum proinflammatory cytokines on day 6 after LD and HD MCMV infection. (E) Representative dot plots of Thy1.2 expression on NK cells on postinfection day 6, quantified in the spleen (F) and liver (G). (H) Representative dot plots of KLRG1 expression on NK cells on postinfection day 6, quantified in the spleen (I) and liver (J). (K) Representative staining of Ly49H+ NK cells in the spleen (L) and liver (M) on post-MCMV infection day 6. Means ± standard error of the mean are shown for 3 or 4 mice per group, representative of 2 experiments. *P < .05; **P < .01; ***P < .001; ****P < .0001, by Student t test or 1-way ANOVA with Tukey post hoc test.
Viral load modulates NK cell activation and phenotype after acute MCMV infection. (A) Viral loads in livers of C57BL/6 mice at day 6 after LD (2 × 10³ PFU) or HD (2 × 10⁴ PFU) MCMV infection determined by quantitative PCR of the IE1 gene copy number per 100 ng of DNA. (B-D) Serum proinflammatory cytokines on day 6 after LD and HD MCMV infection. (E) Representative dot plots of Thy1.2 expression on NK cells on postinfection day 6, quantified in the spleen (F) and liver (G). (H) Representative dot plots of KLRG1 expression on NK cells on postinfection day 6, quantified in the spleen (I) and liver (J). (K) Representative staining of Ly49H+ NK cells in the spleen (L) and liver (M) on post-MCMV infection day 6. Means ± standard error of the mean are shown for 3 or 4 mice per group, representative of 2 experiments. *P < .05; **P < .01; ***P < .001; ****P < .0001, by Student t test or 1-way ANOVA with Tukey post hoc test.
Next, NK cell phenotypes were assessed in the spleen and liver, 2 of the primary target organs of MCMV. Expression of Thy1.2, a marker of NK activation,21–23 was increased significantly with infection, but HD infection led to the largest increase in expression of Thy1.2 in both the spleen and liver (Figure 1E-G). This significant increase in NK activation in the spleen and liver with HD infection is again indicative of increased inflammatory conditions in the HD-infected mice and increased NK cell activation, as the liver is the primary site of viral infection, before spreading to the spleen and the rest of the body.24–26 Consistent with this finding, expression of KLRG1, another marker of NK activation and terminal differentiation,27,28 was significantly elevated with infection, but to a larger extent with HD vs LD infection (Figure 1H-J). Further supporting the idea of increased NK activation after HD infection, LD-infected mice were found to have minimal expansion of Ly49H+ NK cells in the spleen and liver, whereas HD-infected mice had robust Ly49H+ NK expansion after infection (Figure 1K-M). Ly49H is an activating receptor expressed on NK cells in C57BL/6 and related mice, and its ligand, m157, is an MCMV glycoprotein expressed on MCMV-infected cells.29–32 Ly49H engagement leads to clonal expansion of Ly49H-expressing NK cells, which provides B6 strain mice with enhanced resistance to MCMV.30,31 That the LD-infected mice had minimal Ly49H expansion after infection compared with the HD mice indicates that Ly49H is essential in controlling acute MCMV infection.
HD MCMV infection leads to changes in NK subset localization patterns
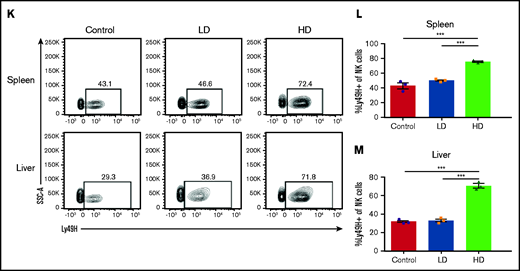
NK cells, although predominant in hematopoietic organs, can be found in multiple tissues throughout the body, having both tissue-resident and circulating populations, although, in contrast to human NK cells, mouse NK cells are rarely present in LNs.17,33,34 Viral infection induces inflammatory cascades, resulting in trafficking of different cell populations to and from the site of insult and affecting regional LN involvement. We have previously observed that in C57BL/6 (H2b) strain mice, the licensed NK subset (Ly49C/I) accumulated in the MCMV target organs (ie, liver and spleen), whereas the unlicensed (Ly49A or G2) subset was preferentially located in the LNs.8 Comparison of LD and HD MCMV infection demonstrated that, during LD infection, this differential pattern of NK cell subset localization based on licensing occurred in both the LN and liver by day 5 of infection (Figure 2A-B). However, HD infection led to changes in these localization patterns, with minimal NK cells trafficking to LNs after infection (Figure 2A) and a massive influx of NK cells into the liver (Figure 2B). In LD infection and consistent with our prior findings, the LN NK cells were made up primarily of unlicensed NK cells, whereas the liver was made up primarily of licensed NK cells (Figure 2C-E; supplemental Figure 1). In contrast, after HD infection, this preferential homing of the unlicensed NK cells to the LNs shifted significantly in the liver, with a large increase in unlicensed NK cells. This increase led to >50% of the NK cells in the liver being unlicensed after HD infection (Figure 2E). The unlicensed population (Ly49C/I−) is a heterogeneous population in regard to Ly49G2 and Ly49A expression (supplemental Figure 2A-B). Interestingly, most of this population lacks expression of all 3 Ly49s at baseline, and infection induces an expansion of Ly49G2-expressing NK cells in the liver, but not the LNs.
HD infection leads to loss of differential NK subset localization patterns. Time course of the absolute number of NK cells (CD3-NK1.1+) in the LNs (A) and liver (B), of C57BL/6 at different post-MCMV infection time points. Control (day 0) mice were mock infected by receiving 0.2 mL of RPMI IP, whereas LD-infected mice were infected with 2 × 10³ PFU MCMV in 0.2 mL of RPMI IP, or HD-infected mice were infected with 2 × 10⁴ PFU MCMV in 0.2 mL of RPMI IP. (C) Gating strategy for splenic unlicensed and licensed NK cells. Licensed: CD3-NK1.1+ cells expressing Ly49C/I; unlicensed: CD3-NK1.1+ cells that do not express Ly49C/I. Absolute number of licensed and unlicensed NK cell subsets in the LNs (D) or liver (E), of C57BL/6 mice on post-MCMV infection day (dpi) 5. Means ± standard error of the mean are shown for 3 or 4 mice per group, representative of 2 experiments. *P < .05; **P < .01; ***P < .001, ns, nonsignificant, by 1- or 2-way ANOVA with Tukey post hoc test.
HD infection leads to loss of differential NK subset localization patterns. Time course of the absolute number of NK cells (CD3-NK1.1+) in the LNs (A) and liver (B), of C57BL/6 at different post-MCMV infection time points. Control (day 0) mice were mock infected by receiving 0.2 mL of RPMI IP, whereas LD-infected mice were infected with 2 × 10³ PFU MCMV in 0.2 mL of RPMI IP, or HD-infected mice were infected with 2 × 10⁴ PFU MCMV in 0.2 mL of RPMI IP. (C) Gating strategy for splenic unlicensed and licensed NK cells. Licensed: CD3-NK1.1+ cells expressing Ly49C/I; unlicensed: CD3-NK1.1+ cells that do not express Ly49C/I. Absolute number of licensed and unlicensed NK cell subsets in the LNs (D) or liver (E), of C57BL/6 mice on post-MCMV infection day (dpi) 5. Means ± standard error of the mean are shown for 3 or 4 mice per group, representative of 2 experiments. *P < .05; **P < .01; ***P < .001, ns, nonsignificant, by 1- or 2-way ANOVA with Tukey post hoc test.
Interestingly, in an examination of the expansion of licensed vs unlicensed Ly49H-expressing NK cells in the liver, licensed NK cells displayed a consistent frequency of Ly49H expression in uninfected vs LD- and HD-infected mice (supplemental Figure 2C). The unlicensed NK cells, however, increased Ly49H expression in a dose-dependent manner, with a significant increase in the frequency of Ly49H-expressing unlicensed NK cells in HD-infected mice compared with uninfected controls. These data suggest that HD infection causes a loss of differential NK subset localization patterns, with both licensed and unlicensed cells localizing together in the MCMV target organ (liver) vs the unlicensed NK subsets localizing in the LNs. Furthermore, unlicensed Ly49H-expressing NK cells are the primary subset that expands in response to MCMV infection.
HD infection leads to a loss of NK-cell licensing effects
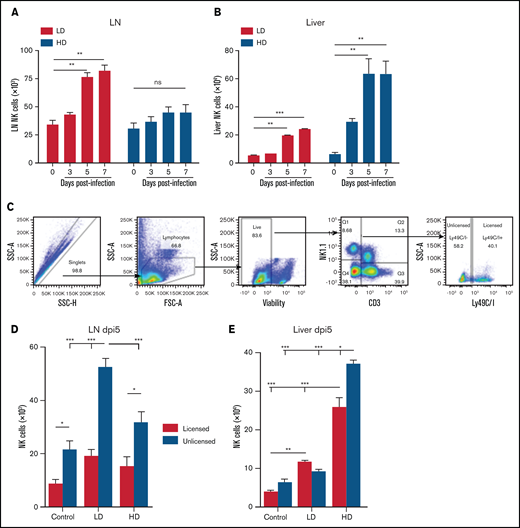
Prior work by our laboratory has established different effector roles of licensed and unlicensed NK cells after viral infection, with the licensed cells serving as the dominant antiviral subset at the site of infection and the unlicensed cells trafficking to LNs to directly support dendritic cell activation and subsequent antigen-specific T-cell responses.8 Using monoclonal antibodies to deplete the licensed or unlicensed NK cells, we assessed the effect on viral outcome (supplemental Figure 3). We tested whether these effector roles could be shifted with a different dose of virus, in light of the findings in a prior publication of differential roles for NK cells that were dependent on the dose of virus used for infection.7 We therefore injected wild-type (WT) C57BL/6 mice with HD MCMV (2 × 10⁴ PFU) and compared the results with the LD of virus used in the initial publication (2 × 10³ PFU). We depleted the mice of their licensed (anti-Ly49C/I) or unlicensed (anti-Ly49G2 or anti-Ly49A) NK cells 2 days before infection and monitored various aspects of their anti-MCMV immune response (Figure 3A). Consistent with prior results of an LD of virus, mice depleted of their unlicensed NK cells had decreased antigen-specific CD8 T cells in the liver (Figure 3B-C), which correlated with defective viral clearance in the liver at day 7 after infection (Figure 3E). Interestingly, in mice infected with an HD of virus, no differences were noted in antigen-specific T-cell expansion or viral clearance between licensed and unlicensed NK-cell–depleted groups (Figure 3B,D,F). The viral load and number of antigen-specific T cells in all HD-infected groups were well above the levels detected in the LD-infected mice, indicative of elevated inflammation in the HD mice. Tetramer and viral titer data for LD and HD infection were plotted in a scatter diagram, and Pearson correlation coefficients were determined for each (supplemental Figure 4A-B). LD infection was found to have a higher degree of correlation (R2= 0.51) with higher tetramer indicating a lower viral load when compared with HD infection (R2= 0.0986) .We also examined antigen-specific CD8 T-cell expansion in the spleen and LN, but did not observe the same subset-specific patterns noted in the liver with LD infection (supplemental Figure 5A-B). Overall, these results suggest that HD infection skews the roles of licensed vs unlicensed NK cell subsets, minimizing the contribution of unlicensed NK cells to adaptive immunity.
Loss of unlicensed NK subset regulation of adaptive immunity with high viral load. (A) NK cell subset depletion and MCMV challenge. (B) Representative flow staining of M45-tetramer on liver CD3+CD8+ T cells at post-MCMV infection day 7 in control (uninfected) or LD- or HD-infected C57BL/6 mice. Absolute number of M45+CD8+ tetramer T cells in the liver at day 7 post-LD (C) or -HD (D) MCMV infection. Viral load on postinfection day 7 of LD (E) or HD (F) MCMV after NK-cell subset depletion. Means ± standard error of the mean are shown for 3 or 4 mice per group, representative of 2 experiments. One-way ANOVA with Tukey post hoc test, to compare groups. *P < .05; **P < .01; ***P < .001, by 1-way ANOVA with Tukey post hoc test.
Loss of unlicensed NK subset regulation of adaptive immunity with high viral load. (A) NK cell subset depletion and MCMV challenge. (B) Representative flow staining of M45-tetramer on liver CD3+CD8+ T cells at post-MCMV infection day 7 in control (uninfected) or LD- or HD-infected C57BL/6 mice. Absolute number of M45+CD8+ tetramer T cells in the liver at day 7 post-LD (C) or -HD (D) MCMV infection. Viral load on postinfection day 7 of LD (E) or HD (F) MCMV after NK-cell subset depletion. Means ± standard error of the mean are shown for 3 or 4 mice per group, representative of 2 experiments. One-way ANOVA with Tukey post hoc test, to compare groups. *P < .05; **P < .01; ***P < .001, by 1-way ANOVA with Tukey post hoc test.
NK cells during HSCT exhibit an activated phenotype
We were then interested in investigating the impact the HSCT environment can have on NK-cell subset phenotypes and responses. NK cells are among the first lymphocyte populations to reconstitute after HSCT and represent a critical component of the immune system during this immunocompromised period. CMV reactivation remains a complication after HSCT, and the role of donor NK cell subsets in protecting during CMV reactivation remains poorly understood. To this end, we used a syngeneic transplantation system in which WT C57BL/6 bone marrow is transplanted into lethally irradiated WT C57BL/6 recipients. We have previously found NK-cell Ly49 expression to be skewed toward increased Ly49G2 expression (particularly in the high MFI subset) after HSCT.21 We were therefore not surprised to see an increased frequency in the spleen of Ly49G2-expressing NK cells when compared with NK cells from naive non-HSCT mice (Figure 4A), as well as a significant increase in the MFI of Ly49G2 (Figure 4B-C), consistent with what we had seen previously. In addition to this increase in Ly49G2 expression, we noted significant increases in the NK activation markers KLRG1 (Figure 4D), consistent with that after infection (Figure 1). Not surprisingly, NK cells after HSCT also have increased expression of Ki67 (Figure 4E), suggesting that the activated phenotype noted post-HSCT could be related to increased proliferation. Overall, these data highlight how NK cells are activated after HSCT compared with naive control NK cells.
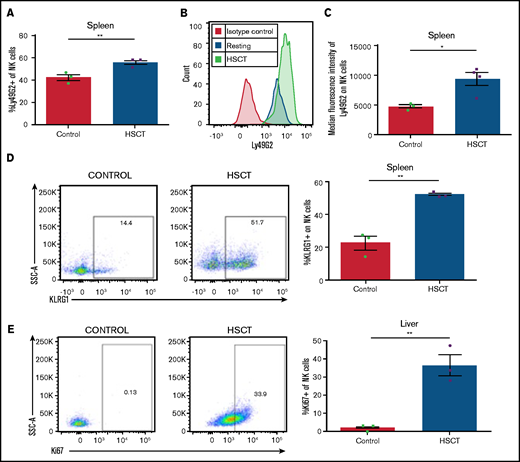
Reconstituting NK cells display an activated phenotype after HSCT. (A) Frequency of Ly49G2+ NK cells at post-HSCT day 13. (B) Representative histogram of Ly49G2 staining on NK cells after HSCT vs resting. (C) MFI of Ly49G2 on splenic NK cells from HSCT mice at post-HSCT day 13. (D) Representative dot plots of KLRG1 on NK cells in resting and HSCT mice (post-HSCT day 13), quantified in a bar graph. (E) Representative dot plots of Ki67 on NK cells quantified in resting and HSCT mice (post-HSCT day 13). Means ± standard error of the mean are shown for 3 or 4 mice per group representative of 2 experiments. *P < .05; **P < .01 , by 1-way ANOVA with Tukey post hoc test.
Reconstituting NK cells display an activated phenotype after HSCT. (A) Frequency of Ly49G2+ NK cells at post-HSCT day 13. (B) Representative histogram of Ly49G2 staining on NK cells after HSCT vs resting. (C) MFI of Ly49G2 on splenic NK cells from HSCT mice at post-HSCT day 13. (D) Representative dot plots of KLRG1 on NK cells in resting and HSCT mice (post-HSCT day 13), quantified in a bar graph. (E) Representative dot plots of Ki67 on NK cells quantified in resting and HSCT mice (post-HSCT day 13). Means ± standard error of the mean are shown for 3 or 4 mice per group representative of 2 experiments. *P < .05; **P < .01 , by 1-way ANOVA with Tukey post hoc test.
NK cells and T cells from patients after HSCT exhibited an activated phenotype
Lymphocytes must proliferate to reconstitute the immune system after HSCT, and we examined markers that were differentially expressed during this critical period (post-HSCT days 28-40). Importantly, analysis was performed long enough after transplantation that the residual effects of the conditioning regimen on cell reconstitution were negligible. One of 4 patients had CMV reactivation, and 2 of 4 patients developed graft-versus-host disease (GVHD). PBMCs from patients who received T-cell–replete haploidentical allogeneic HSCT after reduced-intensity conditioning were analyzed for activation markers19 (Figure 5A). The post-HSCT lymphopenia was characterized by a reduced frequency of T cells (Figure 5B). NK and T cells were highly activated after HSCT, as observed by increased CD69 frequency (Figure 5C). Most of the T cells concomitantly expressed the inhibitory marker PD-1, indicative of recent T-cell receptor signaling and/or exhaustion (Figure 5D). NK cells were not found to express PD-1 in either healthy control PBMCs or PBMCs from patients after HSCT35 (Figure 5D). Both NK and T cells proliferated actively after HSCT, as evidenced by the expression of Ki67 (Figure 5E). Interestingly, the patient who displayed CMV reactivation had the highest expression of Ki67. Stratifying patients based on development of GVHD did not show any differences in the activation markers analyzed (data not shown).
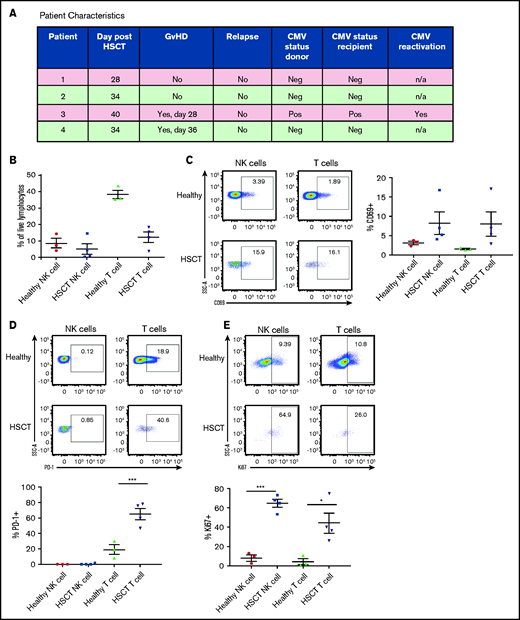
Human NK cells exhibit an activated phenotype in patients after HSCT. (A) Characteristics of patients who received T-cell–replete haploidentical allogeneic HSCT after a reduced-intensity conditioning. (B) Proportion of NK and T cells within total live PBMCs from healthy donors vs patients after HSCT. (C) Frequency of CD69 on NK- and T-cell PBMCs from healthy donors vs patients after HSCT. (D) Frequency of PD-1 on NK- and T-cell PBMCs from healthy donors vs patients after HSCT. (E) Frequency of Ki67 on NK- and T-cell PBMCs from healthy donors vs patients after HSCT. Means ± standard error of the mean are shown for 3 healthy donors and 4 HSCT donors. *P < .05; ***P < .001, by 1-way ANOVA with Tukey post hoc test.
Human NK cells exhibit an activated phenotype in patients after HSCT. (A) Characteristics of patients who received T-cell–replete haploidentical allogeneic HSCT after a reduced-intensity conditioning. (B) Proportion of NK and T cells within total live PBMCs from healthy donors vs patients after HSCT. (C) Frequency of CD69 on NK- and T-cell PBMCs from healthy donors vs patients after HSCT. (D) Frequency of PD-1 on NK- and T-cell PBMCs from healthy donors vs patients after HSCT. (E) Frequency of Ki67 on NK- and T-cell PBMCs from healthy donors vs patients after HSCT. Means ± standard error of the mean are shown for 3 healthy donors and 4 HSCT donors. *P < .05; ***P < .001, by 1-way ANOVA with Tukey post hoc test.
NK activation after HSCT is exacerbated by MCMV infection
Reactivation of CMV is a complication arising from the immunosuppressive state after HSCT.36 It was therefore of interest to ascertain the impact of the virus on NK cells, given that they were the first lymphocytes to recover licensing and function after HSCT. To determine the impact, we used the syngeneic HSCT model used in Figure 4, with mice being infected with MCMV at post-HSCT day 8. Previous work from our laboratory has found an HD (2 × 10⁴ PFU) of MCMV leads to >50% lethality in mice after HSCT (data not shown). We therefore used the LD to assess the effects of infection in these mice. After undergoing syngeneic HSCT, the mice were infected with MCMV at 7 days, at which time myeloid recovery occurred and NK cell repopulation began (Figure 6A). We first measured inflammatory cytokine levels in the serum and found significant increases in IFNγ, TNF, and IL-6 in infected HSCT mice, with minimal increases in cytokine levels in LD-infected, resting (non-HSCT) mice or control, noninfected mice (Figure 6B-D). These increases were similar to those noted in Figure 1 with HD MCMV infection. We next assessed the expression of KLRG1 on liver NK cells and found significant increases in the frequency of KLRG1-expressing NK cells with infection, but virtually 100% of NK cells from infected HSCT-recipient animals expressed KLRG1 (Figure 6E). This enhanced NK activation with infection after HSCT was even more pronounced in the MFI of KLRG1, which had a more than fourfold increase in KLRG1 expression compared with the infected resting animals which had a twofold increase (Figure 6F). Ly49H expansion in the liver was also significantly elevated in infected HSCT animals compared with resting mice (Figure 6G). Collectively, these data suggest that NK cells in the HSCT setting are activated, similar to NK cells after HD infection in resting mice.
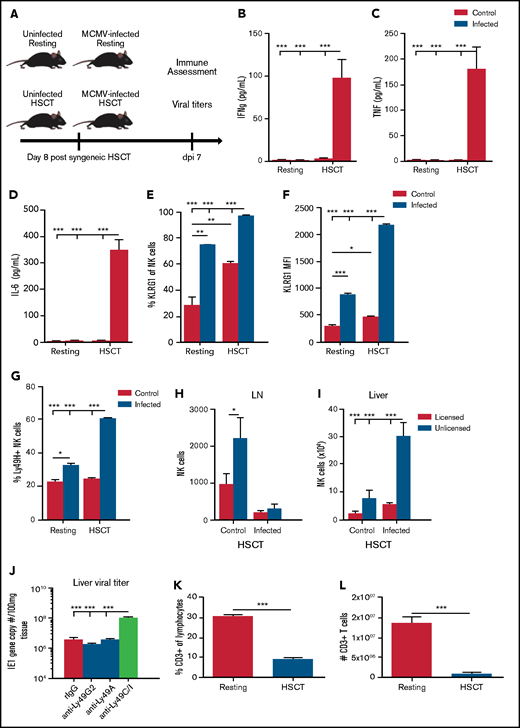
MCMV infection and inflammation is exacerbated in the HSCT environment. (A) Comparison of resting and HSCT mice, with and without MCMV infection (2 × 10³ PFU MCMV). The HSCT mice were challenged on post-HSCT day 8. (B-D) Serum proinflammatory cytokines in resting or HSCT mice, with and without MCMV challenge on post-infection day 7. Expression of KLRG1 (E) and KLRG1 (F) MFI on resting and HSCT NK cells at post-infection day 7. (G) Frequency of Ly49H-expressing NK cells in the liver of infected resting and HSCT mice at post-infection day 7. (H) Absolute number of licensed and unlicensed NK-cell subsets in the LN or (I) liver of C57BL/6 mice on post-MCMV infection day 7 in HSCT mice. (J) Viral loads in livers of C57BL/6 HSCT mice at post-LD MCMV infection day 7 determined by qPCR of the IE1 gene copy number per 100 mg of tissue. Frequency (K) and absolute number (L) of splenic CD3+ T cells in resting vs post-HSCT day 15 mice. Means ± standard error of the mean are shown for 3 or 4 mice per group representative of 2 experiments. *P < .05; **P < .01; ***P < .001, by 1-way ANOVA with Tukey post hoc test.
MCMV infection and inflammation is exacerbated in the HSCT environment. (A) Comparison of resting and HSCT mice, with and without MCMV infection (2 × 10³ PFU MCMV). The HSCT mice were challenged on post-HSCT day 8. (B-D) Serum proinflammatory cytokines in resting or HSCT mice, with and without MCMV challenge on post-infection day 7. Expression of KLRG1 (E) and KLRG1 (F) MFI on resting and HSCT NK cells at post-infection day 7. (G) Frequency of Ly49H-expressing NK cells in the liver of infected resting and HSCT mice at post-infection day 7. (H) Absolute number of licensed and unlicensed NK-cell subsets in the LN or (I) liver of C57BL/6 mice on post-MCMV infection day 7 in HSCT mice. (J) Viral loads in livers of C57BL/6 HSCT mice at post-LD MCMV infection day 7 determined by qPCR of the IE1 gene copy number per 100 mg of tissue. Frequency (K) and absolute number (L) of splenic CD3+ T cells in resting vs post-HSCT day 15 mice. Means ± standard error of the mean are shown for 3 or 4 mice per group representative of 2 experiments. *P < .05; **P < .01; ***P < .001, by 1-way ANOVA with Tukey post hoc test.
We assessed the impact on NK subset localization patterns after HSCT. We saw a large population of NK cells in the LNs of HSCT animals that virtually disappeared after infection (Figure 6H), consistent with what we saw with HD infection in resting mice (Figure 2D). This decrease in LN NK cells correlates with a significant increase in NK cells in the liver after infection (Figure 6I), again consistent with HD infection in resting mice. As mentioned previously, Ly49G2 can be used as a marker of NK activation after HSCT. Interestingly, although there was a marked increase in the number of unlicensed NK cells in the liver after HSCT and MCMV infection (Figure 6I), depletion of unlicensed NK cells (either Ly49G2 or Ly49A subsets) did not alter viral clearance (Figure 6J), consistent with what we have previously shown, suggesting that, although there is a greater expansion of the Ly49G2 subset of unlicensed NK cells after HSCT, they may not be directly involved in mediating antiviral functions in this setting. Surprisingly, there were still effects on viral load when the licensed NK cell subset (Ly49C/I) was depleted after HSCT (Figure 6J), suggesting that, although they are present in a much lower number in the liver, they remain critical for viral clearance and maintain predominantly an effector role in this setting. When looking at expansion of Ly49H-expressing licensed and unlicensed NK cells, counter to what was noted in non-HSCT mice where unlicensed NK cells showed most of the expansion (supplemental Figure 2C), both licensed and unlicensed cells had a significant expansion of Ly49H-expressing NK cells (supplemental Figure 6).
A limited antiviral role for unlicensed NK cells immediately after HSCT, even though activated, indicates that in the absence of T cells as with early post-HSCT, the effector activities of the licensed subset still offer greater protection compared with those of the unlicensed subset. In non-HSCT mice, T-cell activation could have compensated such that no differential effects were observed. Severe T-cell deficiency, as observed early after HSCT (Figure 6K-L), indicates a diminished role for the unlicensed subset in promoting adaptive immunity after HSCT, whereas the licensed population still retained superior effector functions and responded to MCMV through Ly49H to an even higher degree after HSCT. These results highlight how the reconstituting environment after HSCT alters the dynamics of NK effector roles and the impact of licensing.
Discussion
In this current study, we found a pronounced difference in the role of licensed and unlicensed NK cells during MCMV infection, depending on the dose of virus used to infect. Under LD conditions, unlicensed NK cells trafficked to the LNs to support antigen-specific T-cell responses. Under HD conditions, this LN localization was lost, and instead, both subsets of NK cells localized at the site of viral infection in the liver to support immediate antiviral immune responses. This finding suggests that the role of NK cell subsets is context specific, given that a higher viral load required more immediate response than a lower challenge did. There was a hierarchy in which NK- and T-cell antiviral responses were directly tied to the level of viral load. Lower viral loads failed to induce a strong antiviral response; therefore, unlicensed NK-cell help in promoting antigen-specific T-cell responses was the dominant NK subset response during infection. High viral load induced a strong inflammatory response, resulting in strong activation of NK and T cells. This strong activation of both licensed and unlicensed NK cells was needed at the site of infection, as the higher viral load presented a more immediate danger. The higher viral load also bypassed the need for unlicensed NK cell help by simply allowing for more antigen availability for T-cell activation. In addition, any further promotion of antigen-specific T-cell responses could result in unnecessary T-cell–mediated pathology. NK cells have previously been shown to regulate antigen specific T-cell responses through direct cytolysis after chronic viral infection, which can limit pathology at higher viral loads.7 This effect of limiting T-cell responses can come at the cost of persistent viral infection, however.37 Licensed NK cells are likely to have a default cytolytic antiviral phenotype and mediate this effect in most settings. The unlicensed population, on the other hand, is likely to be more attuned to the inflammatory environment. In this way, unlicensed NK cells act as a rheostat, deciding early on during infection whether to traffic to lymphoid tissues and promote adaptive immunity or mediate a more direct antiviral response alongside their licensed counterparts. In addition, we found that this loss of licensing effect correlated with an increase in NK cell activation and Ly49H expansion after HD infection, consistent with prior studies showing that Ly49H is important for heightened NK activation and proliferation after MCMV infection.38 NKG2C+ NK cells have been found to expand in patients with CMV and represent a MCMV-specific receptor similar to Ly49H in mice.39 Further study is needed to understand whether Ly49H signaling and expression can directly promote loss of licensing phenotypic differences in mice and whether these same effects could be extended to NKG2C+ human NK cells.
Tissue-specific cell populations are gaining more and more appreciation in the study of immune responses.40 NK cells are classically thought of as a circulatory population, but tissue-specific NK populations have been identified, with the liver being one of the most extensively studied.41 NK cells are not often found in LNs, and we previously showed that the unlicensed NK cells found in LNs after LD infection specifically trafficked there and were not an expanded LN NK population.8 More study is needed to understand whether tissue-specific and circulatory unlicensed NK populations behave the same in response to LD vs HD infection. A viral infection model with a tissue-specific site of infection, such as influenza, would be a better model for investigating this question, as MCMV induces a systemic response, with most tissues showing signs of viral replication.
Interestingly, under HSCT conditions, we also observed that LD infection led to an NK-cell phenotype similar to that found in HD non-HSCT conditions. There was a lack of unlicensed localization in LNs, as well as a significant increase in Ly49H expansion compared with non-HSCT conditions. That is not to say that LD infection after HSCT is exactly like what was found in non-HSCT HD infection. Unlike HD infection, depletion of licensed NK cells led to significant defects in viral clearance and survival in the HSCT mice, whereas with HD infection in non-HSCT mice, we found no effect on viral clearance by depletion of any subset of cells. That unlicensed depletion does not negatively affect viral clearance in these mice is surprising, as we have previously shown that Ly49G2-expressing NK cells represent most of the NK cell population soon after HSCT.21 We would not expect unlicensed NK cells to promote antigen-specific T cells because of the lymphopenic environment early during HSCT, but instead to become hyperactivated and behave like licensed NK cells. Clearly the licensed NK cells retain some enhanced effector function over the unlicensed NK cells, even under strong activating conditions. The loss of licensing effect could be specifically tied to a loss of subset specific trafficking and localization, because these effects were consistent between resting and HSCT settings. More studies are needed to phenotype chemokine and other trafficking receptor differences between licensed and unlicensed NK cells, in different inflammatory conditions. In addition, although the difference was not statistically significant, Ly49A depletion in these HSCT mice led to a small increase in survival relative to control mice (data not shown).
Human HSCT NK cells displayed an activated phenotype similar to that noted in our murine HSCT experiments. Although our murine experiments were not in an allogeneic setting like those of the patients, a previous murine study noted increased NK cell activation after allogeneic transplant.23 We therefore hypothesize that the increased inflammation present during allogeneic transplant may further drive activation of NK cells and an increased licensed phenotype among unlicensed NK cells. NK cells represent one of the earliest forms of antiviral defense after transplantation, and CMV reactivation remains a common complication in these patients. One patient from our cohort displayed reactivation of latent CMV infection and displayed the highest proliferation among NK and T cells. Interestingly, no other markers of NK activation stratified in parallel with CMV reactivation in this cohort. The outbred nature of patients makes studying NK cell licensing difficult, because of the heterogeneity of MHC and KIR expression. Further studies are needed with a larger cohort stratified based on CMV reactivation, to better understand how CMV reactivation may augment NK cell recovery and activation after HSCT. We would expect it to further increase NK cell activation, with the licensed NKG2C+ NK cells providing most of the early antiviral immunity after HSCT.
Therefore, the HSCT environment represents yet another dynamic setting where NK subset effector roles can shift. More study is needed to address what unlicensed NK cells contribute to viral responses early after HSCT (during development) and whether this is detrimental to immune responses, as they clearly represent the bulk of the NK-cell population. It is also important to determine at which point in immune reconstitution, as T cells recover, the unlicensed NK-cell population starts to mediate the dominant effects and exhibit the differential localization patterns observed in control non-HSCT–infected mice. Questions also remain regarding whether the enhanced effector function of unlicensed cells observed during strong stimulation may lead to situations where self-tolerance is not maintained and whether these scenarios could be detrimental to the host, potentially inducing autoimmunity. Collectively, these results highlight how NK-cell subset responses are highly attuned to the environment and the state of the immune system.
Acknowledgments
The authors thank past and current members of the Murphy laboratory and Jonathan Van Dyke for helpful discussions.
This work was supported in part by National Institutes of Health, National Heart, Lung, and Blood Institute grant R01HL140921 (W.J.M.) and in part by funds from the UCD Comprehensive Cancer Center and the UCD Flow Cytometry Shared Resource Laboratory, with funding from National Cancer Institute grant P30CA093373 (Cancer Center) and National Center for Research Resources grant S10RR026825 (Fortessa Cytometer). We would like to thank the NIH tetramer core facility at Emory University for providing the tetramers utilized in the studies.
Authorship
Contributions: E.G.A., C.D., R.J.C., S.J.J., A.E.Z., and W.J.M. designed the experiments; E.G.A., C.D., S.J.J., A.E.Z., R.J.C., I.B., M.A., J.S.M., B.R.B., and W.J.M. developed the project; E.G.A., C.D., S.J.J., C.P.C., L.V.V., L.T.K., and K.M.S., performed the experiments; P.C., C.R., S.J.J., and R.J.C. provided the clinical samples; E.G.A., C.D., S.J.J., C.P.C. L.V.V., L.T.K., I.B., and K.M.S. collected the data: E.G.A., C.D., S.J.J., R.J.C., and W.J.M. analyzed the data; E.G.A., C.D., and W.J.M. prepared the figures; E.G.A., C.D., and W.J.M. wrote the manuscript; and W.J.M obtained the funding.
Conflict-of-interest disclosure: The authors declare no competing financial interests.
Correspondence: William J. Murphy, Departments of Dermatology and Internal Medicine, UC Davis School of Medicine, University of California, Davis, 2921 Stockton Blvd, IRC Bldg, Rm1614, Sacramento, CA 95817; e-mail: wmjmurphy@ucdavis.edu.

