

Key Points
NGS of the T-cell receptor identifies dominant clonotypes in most patients with untreated PTCL, which can be tracked in peripheral blood.
Marked clonotypic heterogeneity of the TCR, which may underpin treatment resistance, is present within individual patients with PTCL.

Abstract
Peripheral T-cell lymphomas (PTCLs) have marked biologic and clinical heterogeneity, which confounds treatment decisions. Advances in circulating tumor DNA (ctDNA) assays using next-generation sequencing (NGS) have improved the detection of molecular relapse and driver mutations in diffuse large B-cell lymphoma and show the potential utility of ctDNA across lymphomas. We investigated NGS-based monitoring of T-cell receptor (TCR) sequences in patients with PTCL undergoing frontline treatment. Of 45 patients, 34 (76%) had tumor-specific clonotypes of the TCRβ or TCRγ genes identified, which included 18 (86%) from baseline tissue and 16 (67%) from baseline serum. Twenty-five (74%) patients had both TCRβ and TCRγ clonotypes, 23 (68%) had more than 1 TCRγ clonotype, and 4 (9%) had multiple TCRβ or TCRγ clonotypes, demonstrating significant intrapatient clonotypic heterogeneity. Among 24 patients with available serial serum samples during treatment, 9 (38%) cleared ctDNA after 2 cycles of therapy, and 11 (46%) had detectable ctDNA at the end of treatment. Patients with detectable ctDNA after therapy showed a trend toward worse survival. Notably, 2 patients with persistently detectable ctDNA after therapy remained in remission with 10 years of follow-up. Clonotypic heterogeneity in tumors and persistence, despite long-term remission, suggests variability in oncological potential. This trial was registered at www.clinicaltrials.gov as #NCT00001337.
Introduction
Peripheral T-cell lymphom as (PTCLs) are among the most biologically and clinically heterogeneous lymphomas.1 Although frontline therapy cures approximately 75% of patients with anaplastic lymphoma kinase-positive anaplastic large-cell lymphoma (ALK+ ALCL), fewer than 20% of patients with PTCL subtypes other than ALCL achieve long-term remission.2-4 While autologous stem cell transplantation (ASCT) is commonly used as consolidation after first remission in ALK− PTCL,5 its necessity is unproven.6-9 Furthermore, patient selection is largely empirical, highlighting the need for molecular tools for risk-adapted patient selection. Analyses of a mono- or oligoclonal T-cell population, including flow cytometry for TCRVβ and TCRβ constant region 1,10,11 multiplex polymerase chain reaction (PCR) for TCRβ and TCRγ rearrangments,12 and next-generation sequencing (NGS) of TCR complementarity-determining region 3 (CDR3)13,14 can diagnose and provide prognostic information in PTCL but require circulating lymphoma cells, which limits broad applicability.
Circulating tumor DNA (ctDNA) represents a minimally invasive and tumor-specific biomarker that is being explored in a variety of lymphomas to study disease biology and to aid in clinical decision making.15–19 In diffuse large B-cell lymphoma (DLBCL), rearranged immunoglobulin receptor genes can be detected, quantified, and tracked with high-throughput sequencing assays in the peripheral blood.15,16 In one study, a tumor-specific clonotype was identified in the serum of 126 (64%) of 198 patients with DLBCL, quantitatively correlated with disease burden, and detected molecular relapse a median of 3.5 months before computed tomographic (CT) scans.15 Another study confirmed these findings and demonstrated that the cell-free compartment in blood is superior for analysis of ctDNA in DLBCL.16 We hypothesized that sequencing of the CDR3 region of TCRβ and TCRγ genes from cell-free DNA in serum would identify and quantify tumor-specific clonotypes in PTCL and allow for a minimally invasive assessment of therapy effectiveness, as well as provide a surveillance tool after therapy. Using a high-throughput DNA sequencing method targeting immunoglobulin receptor sequences, we assessed the predictive and prognostic ability of ctDNA in uniformly treated patients with PTCL who were undergoing frontline therapy.
Methods
Study design and patients
We analyzed ctDNA in patients with previously untreated PTCL who were subsequently treated with a clinical protocol involving dose-adjusted etoposide, prednisone, vincristine, cyclophosphamide, and doxorubicin (DA-EPOCH) from May 1993 through December 2015. Previously, we had reported on the performance of immunoglobin receptor gene sequences as ctDNA in patients with subtypes of DLBCL treated with this protocol.15 Eligibility for this correlative analysis was restricted to patients with nodal and extranodal PTCL subtypes, according to the World Health Organization’s diagnostic criteria (Table 1).20 Additional key eligibility criteria included age ≥12 years, no previous treatment, and adequate major organ function, unless disease related, along with other criteria (supplemental Material). Patients with HIV, active symptomatic ischemic heart disease, and a history of systemic neoplasms within 5 years of treatment were excluded. Eligibility assessment included history and physical examination; standard laboratory tests; contrast CT scans of the neck, chest, abdomen, and pelvis; and lumbar puncture, if clinically indicated.
Baseline patient characteristics
| Characteristic | Study patients | Clinical progressors | Clinical nonprogressors | P |
|---|---|---|---|---|
| (n = 34) | (n = 20) | (n = 14) | (2-tailed) | |
| Age, y | ||||
| Median | 50 | 53.5 | 36 | .151 |
| Range | 19-81 | 20-81 | 19-72 | — |
| Male sex, n (%) | 18 (53) | 10 (50) | 8 (57) | .74 |
| Histology, n (%) | ||||
| ALCL | 11 (32) | 3 (15) | 8 (57) | .02 |
| ALK+ | 7 (21) | 3 (15) | 4 (29) | — |
| ALK− | 3 (9) | 0 (0) | 3 (21) | — |
| Unknown ALK status | 1 (3) | 0 (0) | 1 (7) | — |
| PTCL-NOS | 10 (29) | 8 (40) | 2 (14) | .14 |
| AITL | 5 (15) | 4 (20) | 1 (7) | .38 |
| HSTCL | 5 (15) | 3 (15) | 2 (14) | .99 |
| PCGDTCL | 1 (3) | 0 (0) | 1 (7) | — |
| EATL | 1 (3) | 1 (5) | 0 (0) | — |
| SPLTCL | 1 (3) | 1 (5) | 0 (0) | — |
| Ann Arbor stage III-IV, n (%) | 32 (94) | 19 (95) | 13 (97) | .99 |
| IPI score, n (%) | ||||
| Low risk (0-1) | 5 (15) | 2 (10) | 3 (21) | .62 |
| Low-intermediate risk (2) | 7 (21) | 4 (20) | 3 (21) | .99 |
| Intermediate-high risk (3) | 13 (38) | 7 (35) | 6 (43) | .73 |
| High risk (4-5) | 9 (26) | 7 (35) | 2 (14) | .25 |
| Elevated LDH, n (%) | 25 (74) | 18 (90) | 7 (50) | .02 |
Bold P-values indicate significant results.
EATL, enteropathy-associated T-cell lymphoma; HSTCL, hepatosplenic T-cell lymphoma; PCGDTCL, primary cutaneous gamma-delta T-cell lymphoma; SPLTCL, subcutaneous panniculitislike T-cell lymphoma.
The protocol was conducted in accordance with the principles of the Declaration of Helsinki. The treatment study was approved by the National Cancer Institute’s institutional review board and all patients signed informed consents. For the deidentified analysis of ctDNA, we obtained an exemption from institutional review board approval.
Treatment and monitoring
All patients received up to 8 cycles of DA-EPOCH every 21 days, as previously described.21 The protocol permitted no consolidation with ASCT or radiation therapy. The clinical outcomes for a subset of patients with PTCL with systemic ALCL have been published.3
Tumor response was assessed per the revised response criteria for malignant lymphoma and based on CT scans performed after cycles 4 and 6, as well as positron-emission tomography scans performed after cycle 6.22,23 After therapy, surveillance clinic visits every 3 to 4 months for the first 2 years and every 6 to 12 months during years 2 through 5 included paired serum samples and CT scans. After 5 years, annual surveillance visits included clinical assessments without CT scans.
Correlative tissue sample collection and analysis
Diagnostic biopsies were stored as formalin-fixed, paraffin-embedded (FFPE) tissue. The protocol included prespecified collection and banking of research serum samples before therapy, before each cycle of chemotherapy, at the end of induction, and at each surveillance visit. At each time point, 10 mL of blood was drawn into a red-top serum-separator tube, centrifuged, divided into 1-mL aliquots in Eppendorf tubes, and stored at no lower than −20°C. Research blood samples were drawn only at the time of protocol-specified visits. DNA from pretreatment serum samples and FFPE biopsy specimens, when available, was analyzed for dominant TCR clonotypes, as previously described.24 For patients without baseline FFPE samples, only pretreatment serum samples were used for clonotype detection.
TCR clonotypic sequences
Using high-throughput amplification and sequencing of the CDR3 of the TCRβ/TCRγ genes, distinct TCR clonotypes were identified and quantified within each sample, and their relative frequency was calculated. The amount of each rearrangement was determined with a synthetic TCR repertoire that controls for PCR bias and quantifies the number of rearrangements within a sample, as previously described.25 Dominant TCR clonotypes were presumed to be tumor specific if they comprised >3% of like sequences, were in >0.2% of nucleated cells (FFPE), had >40 observations, and had <5 clonotypes within a 10-fold frequency, based on cellular clonotype detection in other T-cell malignancies.24,26 These were cataloged and tracked in subsequent samples. For cell-based samples (FFPE) the unit of quantification was the number of lymphoma cells quantified through TCRβ/TCRγ molecules (equivalent to 1 tumor cell) per 106 diploid genomes (equivalent to 106 cells). Identification and quantification were performed on all serum samples of patients with an identified TCRβ/TCRγ sequence, and the number of tumor-associated rearrangements was expressed per milliliter of serum input into the assay. The assay is capable of detecting 1 lymphoma ctDNA molecule within a sample. Interim monitoring was performed on all samples collected at the start of each cycle. Surveillance monitoring was performed on serial samples from the end of treatment (EoT) until disease progression and included only patients who achieved a complete response (CR). When there were multiple dominant clonotypes, the one with the most clonotypes per milliliter was used in all quantitative analyses. All analyses of ctDNA were performed by clinicians blinded to clinical outcomes.
Statistical analysis
Median follow-up included time from the on-study date to death or last follow-up. Event-free survival (EFS) was calculated from the date of treatment initiation to date of progression, alternative therapy for active lymphoma, death, or date of last follow-up, and overall survival (OS) was calculated from the date of study enrollment to date of death or date of last follow-up, according to the Kaplan-Meier method. We used the log-rank test, χ2 test, and Spearman’s rank correlation coefficient, as appropriate. We calculated the sensitivity, specificity, positive predictive value (PPV), and negative predictive value (NPV) of ctDNA at 2 different time points (after 2 cycles and at EoT), as a test of early progression, by dichotomizing ctDNA measurements as “present” or “absent” and using clinical events vs no progression as the reference standard.
Results
Patients and baseline tissue samples
Of the 54 patients with PTCL screened, 45 (83%) had baseline FFPE and/or baseline serum that could be tracked as tumor-specific clonotypes (Figure 1). Of those, 21 (47%) had FFPE samples available, including 16 (36%) with both baseline FFPE and serum available. Twenty-four (53%) patients had only baseline serum available for calibration. Eighteen (86%) of the 21 patients with FFPE samples available and 16 (67%) of the 24 patients with only baseline serum available had at least 1 dominant TCR rearrangement identified for tracking. Overall, 34 (76%) patients with available baseline samples had a tumor-specific clonotype identified for monitoring, and they comprised the study cohort. After a median follow-up of 3.0 years (range, 0.1-15.4), 20 (59%) patients clinically progressed or required alternative therapy for active lymphoma, and 14 (41%) remained free of clinical progression (Table 1). The study population included multiple subtypes of PTCL with the most common being ALK+ and ALK− ALCL (32%) and peripheral T-cell lymphoma, not otherwise specified (PTCL-NOS; 29%). As expected, clinical nonprogressors were more likely to have the ALCL subtype (P = .02) and to present with a normal serum lactate dehydrogenase (LDH; P = .02) (Table 1). Almost all patients (94%) had advanced stage and the majority (64%) had either an intermediate-high- or high-risk International Prognostic Index (IPI) score.
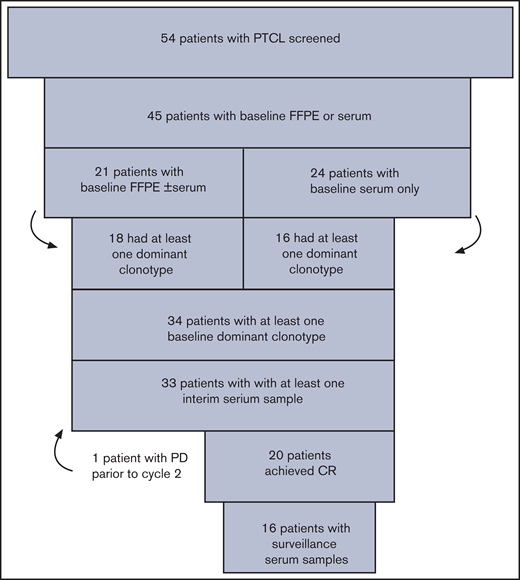
Patients and calibration. Fifty-four patients with untreated PTCL enrolled in the treatment study and were screened to determine whether baseline FFPE and/or serum samples were available. Thirty-four patients had a dominant T-cell receptor rearrangement identified from FFPE or serum samples, and they comprised the study cohort for the correlative analysis of circulating tumor DNA.
Patients and calibration. Fifty-four patients with untreated PTCL enrolled in the treatment study and were screened to determine whether baseline FFPE and/or serum samples were available. Thirty-four patients had a dominant T-cell receptor rearrangement identified from FFPE or serum samples, and they comprised the study cohort for the correlative analysis of circulating tumor DNA.
Clonotypic heterogeneity
Significant clonotypic heterogeneity was observed in both FFPE and serum. In 18 patients with dominant TCR clonotypes identified from baseline FFPE samples, 15 (83%) also had TCR clonotypes identified from the serum (Figure 2A). Interestingly, 13 dominant TCR clonotypes in 7 patients were exclusively detected in the serum, but not in the FFPE samples. Across individual patients, a median of 3 (range, 1-8) dominant TCR clonotypes were identified, including both tissue sources, and 17 (94%) patients had dominant clonotypes of both TCRγ and TCRβ. The lone exception was a patient who had a singular dominant TCRγ clonotype identified in FFPE tissue (Figure 2A). In 16 patients who had TCR clonotypes detected exclusively from baseline serum, a median of 2 (range, 1-3) dominant TCR clonotypes were identified, and all 16 patients had at least 1 dominant TCRγ clonotype identified, whereas 9 (56%) had a dominant TCRβ clonotype identified (Figure 2B). Across all 34 patients and both tissue sources, a total of 63 dominant TCR clonotypes were identified, including 24 (38%) identified exclusively in FFPE samples, 13 (21%) identified exclusively from serum, and 26 (41%) identified from both tissue sources (Figure 2C). All 34 (100%) patients had at least 1 dominant TCRγ clonotype, and 25 (74%) had at least 1 dominant TCRβ clonotype identified for tracking throughout therapy (Figure 2A-B). The number of dominant TCR clonotypes was also variable across PTCL subtypes. Patients with hepatosplenic T-cell lymphoma had fewer dominant TCR clonotypes detected (median, 2; range, 1-2) compared with patients with ALCL (median, 3; range, 2-5; P = .006) or PTCL-not otherwise specified (PTCL-NOS; median, 3; range, 1-8; P = .06; Figure 2D).
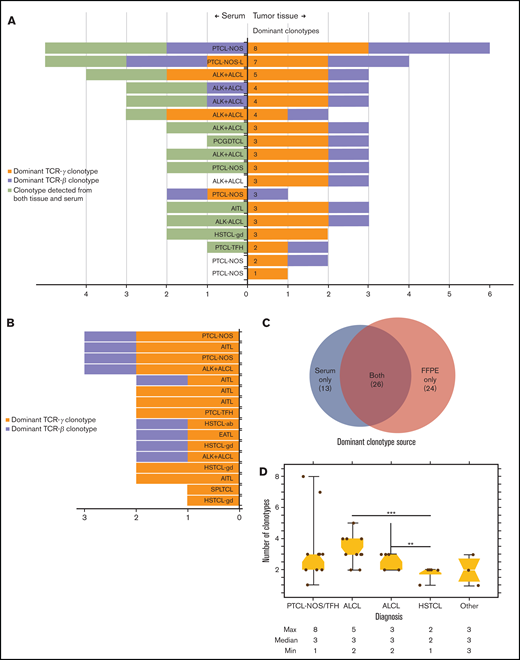
Identification of dominant T-cell receptor clonotypes from stored tissue biopsy specimens. (A) The number of dominant clonotypes of TCRγ (mustard) and TCRβ (lavender) identified in both baseline FFPE and serum samples from 18 patients who had at least 1 dominant TCR clonotype identified from baseline FFPE tissue. Of the 18, 16 had matched serum samples, with a dominant clonotype detected in 15. Thirteen dominant TCR clonotypes (lime green) across 7 of those 15 patients were identified in serum that were not identified in FFPE samples. (B) The number of dominant TCRγ (mustard) and TCRβ (lavender) clonotypes detected in baseline serum in 16 patients without available baseline FFPE samples. (C) Tissue source of all dominant TCR clonotypes detected exclusively in FFPE and serum samples, as well as those detected in both tissue sources. (D) The median number and range of clonotypes identified in baseline tissue samples across histologic subtypes of PTCL. ALK− ALCL, ALK− negative ALCL; EATL, enteropathy associated T-cell lymphoma; HSTCL-gd, hepatosplenic T-cell lymphoma gamma delta; PCGDTCL, primary cutaneous gamma delta T-cell lymphoma; PTCL-NOS-L, lymphoepithelioid cell variant of PTCL-NOS; PTCL-TFH, PTCL-T-follicular helper phenotype; SPLTCL, subcutaneous panniculitislike T-cell lymphoma.
Identification of dominant T-cell receptor clonotypes from stored tissue biopsy specimens. (A) The number of dominant clonotypes of TCRγ (mustard) and TCRβ (lavender) identified in both baseline FFPE and serum samples from 18 patients who had at least 1 dominant TCR clonotype identified from baseline FFPE tissue. Of the 18, 16 had matched serum samples, with a dominant clonotype detected in 15. Thirteen dominant TCR clonotypes (lime green) across 7 of those 15 patients were identified in serum that were not identified in FFPE samples. (B) The number of dominant TCRγ (mustard) and TCRβ (lavender) clonotypes detected in baseline serum in 16 patients without available baseline FFPE samples. (C) Tissue source of all dominant TCR clonotypes detected exclusively in FFPE and serum samples, as well as those detected in both tissue sources. (D) The median number and range of clonotypes identified in baseline tissue samples across histologic subtypes of PTCL. ALK− ALCL, ALK− negative ALCL; EATL, enteropathy associated T-cell lymphoma; HSTCL-gd, hepatosplenic T-cell lymphoma gamma delta; PCGDTCL, primary cutaneous gamma delta T-cell lymphoma; PTCL-NOS-L, lymphoepithelioid cell variant of PTCL-NOS; PTCL-TFH, PTCL-T-follicular helper phenotype; SPLTCL, subcutaneous panniculitislike T-cell lymphoma.
Baseline circulating tumor DNA levels and clinical outcomes
With a median follow-up of 3.0 years (range, 0.1-15.4), the median EFS and OS of the study patients was 3.5 years (95% CI, 0.3-12.6) and 11.5 years (95% CI, 2.5 years to not reached [NR]), respectively (supplemental Figure 1A-B). Patients with ALCL had a significantly longer EFS compared with other PTCL subtypes (median [95%CI], 15.1 [0.57-NR] vs 0.65 [0.17-2.8] years; P = .01), respectively, but no difference in OS (median, 11.5 [2.5-NR] vs 7.0 [0.5-NR] years; P = .17; supplemental Figure 2A-B). Of 40 patients with a pretreatment serum sample available, 28 (70%) had quantitative baseline ctDNA levels that only modestly correlated with the IPI score (ρ = 0.47; P = .13; Figure 3A) and serum LDH (ρ = 0.42; P = .02; Figure 3B). Using the median baseline ctDNA level of 265.38 clonotypes per milliliter as a cutoff, we compared the clinical outcomes of patients with high vs low baseline ctDNA levels and found no significant differences in EFS (median [95% CI], 7.7 [0.4-NR] vs 2.8 [0.05-NR] years; P = .30) or OS (median, NR [1.2-NR] vs 7.0 [0.08-NR] years; P = .19), respectively (Figure 4). We also found no significant differences in non-ALCL patients with high vs low quantitative levels of baseline ctDNA in EFS (median [95%CI], 0.5 [0.1-NR] vs 0.7 [0.05-NR] years; P = .7) or OS (median, NR [0.2-NR] vs 7.0 [0.08-NR] years; P = .42), respectively (supplemental Figure 3A-B).
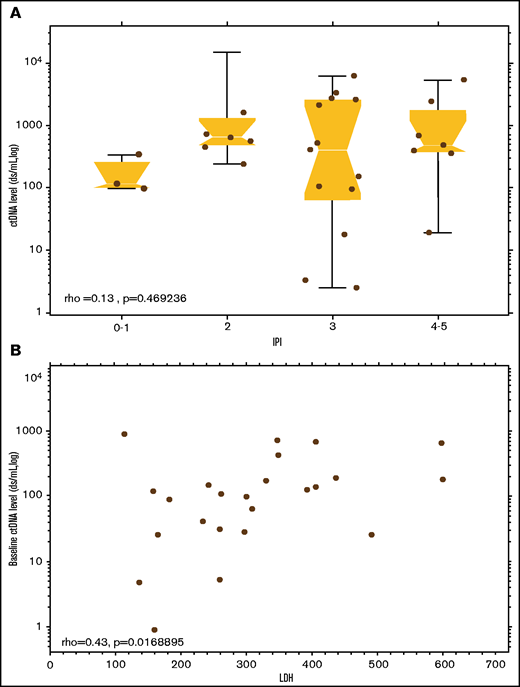
Correlation of ctDNA values with other prognostic parameters. (A) Baseline levels of ctDNA) across IPI categories. (B) Baseline levels of ctDNA correlated with pretreatment serum LDH. ρ, Spearman’s rank correlation coefficient.
Correlation of ctDNA values with other prognostic parameters. (A) Baseline levels of ctDNA) across IPI categories. (B) Baseline levels of ctDNA correlated with pretreatment serum LDH. ρ, Spearman’s rank correlation coefficient.
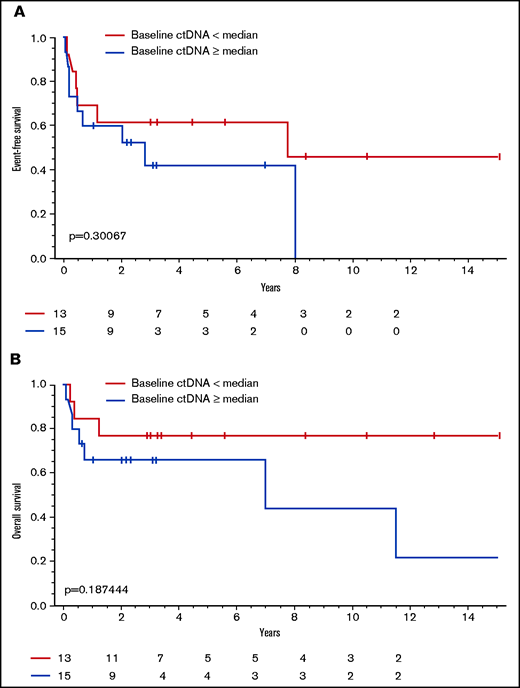
Association between dichotomized ctDNA level and survival. (A) EFS in patients with baseline levels of ctDNA above the median level compared with patients with levels below the median. (B) OS in patients with baseline levels of ctDNA above the median level compared with patients with levels below the median.
Association between dichotomized ctDNA level and survival. (A) EFS in patients with baseline levels of ctDNA above the median level compared with patients with levels below the median. (B) OS in patients with baseline levels of ctDNA above the median level compared with patients with levels below the median.
Circulating tumor DNA kinetics during treatment
We next investigated whether clearance of ctDNA as minimal residual disease (MRD) during therapy was associated with improved clinical outcomes in 33 patients with at least 1 serum sample collected during therapy (Figure 5A). Quantitative analysis of paired samples revealed a median 2.6-log decrease in ctDNA level after the first 2 cycles of treatment. After 2 cycles of therapy, 15 of 24 (63%) patients had persistently measurable levels of ctDNA (Figure 5A). Early clearance of ctDNA after cycle 2 was not associated with a statistically significant improvement in EFS (median [95% CI], 8.4 [0.1-NR] vs 2.0 [0.1-NR] years; P = .32) or OS (median, 8.4 [0.3-NR] vs 7.0 [0.5-NR] years; P = .44; Figure 5B-C). Similarly, in non-ALCL patients, early clearance of ctDNA after cycle 2 was not associated with a significant improvement in EFS (median [95% CI], 5.6 [0.1-NR] vs 1.1 [0.1-NR] years; P = .51) or OS (median [95% CI], 5.6 [0.4-NR] vs 7.0 [0.2-NR] years; P = .61; supplemental Figure 4A-B). Six (40%) patients with measurable ctDNA levels after cycle 2 finished treatment and were without clinical progression with at least 2 years of follow-up. The sensitivity, specificity, PPV, and NPV of ctDNA after 2 cycles of therapy to predict treatment failure was 75%, 50%, 60%, and 67%, respectively.
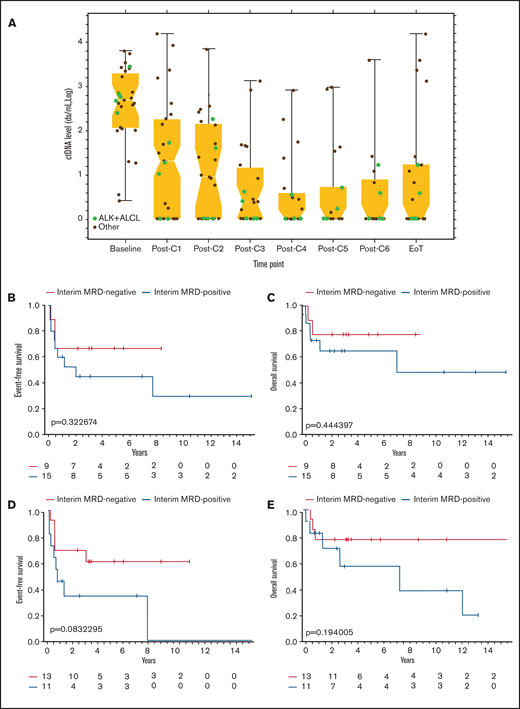
ctDNA kinetics during therapy and clinical outcomes (A) The median and range of quantitative ctDNA levels after each cycle of therapy until treatment is complete. Levels of ctDNA in patients with ALK+ ALCL are depicted with green dots, and levels in other histologic subtypes of PTCL are depicted with black dots. (B) EFS based on presence or absence of ctDNA as a marker of MRD, drawn before day 1 of cycle 3. (C) OS based on the presence or absence of ctDNA as a marker of MRD drawn before day 1 of cycle 3. (D) EFS based on the presence or absence of ctDNA as a marker of MRD at the EoT. (E) OS based on presence or absence of ctDNA as a marker of MRD at EoT. C, cycle.
ctDNA kinetics during therapy and clinical outcomes (A) The median and range of quantitative ctDNA levels after each cycle of therapy until treatment is complete. Levels of ctDNA in patients with ALK+ ALCL are depicted with green dots, and levels in other histologic subtypes of PTCL are depicted with black dots. (B) EFS based on presence or absence of ctDNA as a marker of MRD, drawn before day 1 of cycle 3. (C) OS based on the presence or absence of ctDNA as a marker of MRD drawn before day 1 of cycle 3. (D) EFS based on the presence or absence of ctDNA as a marker of MRD at the EoT. (E) OS based on presence or absence of ctDNA as a marker of MRD at EoT. C, cycle.
We also investigated whether persistence of ctDNA as MRD at EoT was associated with poor clinical outcomes. Overall, 13 (54%) patients cleared ctDNA after therapy, whereas 11 (46%) had persistently measurable levels of ctDNA at EoT (Figure 5A). Of the 11 patients with measurable ctDNA after therapy, 6 (55%) had persistent disease on imaging scans, whereas 5 (45%) achieved CR. Of the 5 patients who achieved CR but had persistent ctDNA, 4 had extranodal sites of disease at presentation, with a paraspinal mass in 1 and pleural and/or pericardial effusions in the other 3. These patients later relapsed at a median of 8 months (3 months to 7 years) after EoT. The fifth patient in CR and with persistent ctDNA had stage III ALK+ ALCL with nodal involvement and was without evidence of clinical relapse at 1-year follow-up. In 13 patients who were MRD− at EoT, 5 (38%) were considered to have residual disease after therapy by imaging criteria. Patients who cleared ctDNA at EoT had a trend toward improved EFS (median [95% CI], NR [0.4 to NR] vs 0.7 [0.05-7.7] years; P = .08) and OS (median, NR [0.7-NR] vs 7.0 [0.3-NR] years; P = .19) compared with patients with persistent levels of ctDNA after therapy (Figure 5D-E). In non-ALCL patients, clearance of ctDNA at EoT was not associated with an improved EFS (median [95% CI], 2.8 [0.1-NR] vs 0.7 [0.05-7.7] years; P = .34) or OS (median, NR [0.4-NR] vs 7.0 [0.2-NR] years; P = .52), compared with patients with persistent levels of ctDNA (supplemental Figure 5A-B). Sensitivity, specificity, positive PPV, and NPV of ctDNA at EoT were 59%, 86%, 89%, and 52%, respectively.
Circulating tumor DNA as surveillance after therapy
Last, we investigated ctDNA as a surveillance tool to identify the early molecular relapse that precedes clinical detection. Sixteen (80%) of 20 patients who achieved a CR after therapy had at least 1 posttreatment serum sample available for surveillance ctDNA analysis. Eight (50%) of those patients relapsed, and 8 (50%) had no evidence of clinical relapse. Clinical relapses occurred at a median of 22.5 months (range, 3-92) after EoT, and a median of 4 serum samples (range, 1–24) were collected before clinical detection of relapse (Figure 6A). In 6 (75%) of the progressors, ctDNA was positive before the detection of clinical relapse, with a median lead time of 12.5 months (range, 0.1-82.4), and 5 (63%) patients had multiple time points with measurable ctDNA before clinical relapse (Figure 6A). In the 2 patients who did not have measurable ctDNA before relapse, patient 190 relapsed 8 years after initial therapy, and we were unable to confirm a clonal relationship to the original tumor. Patient 291 relapsed at the site of initial disease shortly after completing frontline therapy. The patterns of ctDNA kinetics before clinical relapse were variable, with 2 representative examples shown in Figure 6B. Patient 9, who had PTCL-NOS, did not progress clinically for 8 years after therapy and demonstrated fluctuating levels of ctDNA throughout surveillance before clinical progression. In contrast, patient 198, who had the PTCL-T follicular helper phenotype,relapsed 30 months after therapy and demonstrated a gradual pattern of slowly increasing levels of ctDNA throughout surveillance before clinical progression. Patients who did not progress were followed up for a median of 46.3 months (range, 12.5-181.3) after therapy and had a median of 10 serum samples (range, 5-17) collected (Figure 7A). Four (50%) of those patients had persistently negative ctDNA levels throughout surveillance. Two (25%) patients had a solitary time point that was positive for ctDNA at very low levels that was not associated with relapse and had no detectable ctDNA in subsequent serum samples. Patients 1 and 15 had detectable ctDNA at multiple time points during surveillance that was not associated with clinical relapse, but the patterns of ctDNA kinetics were distinctly different (Figure 7B). Patient 1 had moderately elevated levels of all 3 dominant TCR clonotypes that persisted throughout surveillance, with only minimal fluctuation, whereas patient 15 had multiple time points with low positive ctDNA and multiple time points without detectable ctDNA.
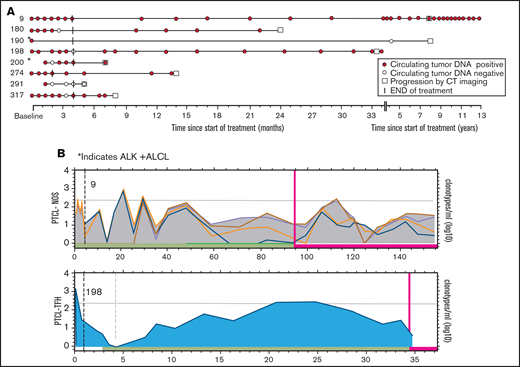
ctDNA as surveillance monitoring in clinical progressors. The results of ctDNA detected in stored serum samples collected after therapy compared with conventional monitoring for clinical relapse with periodic clinic visits and regular CT scans. (A) Serum samples collected after therapy in 8 patients who achieved CR, underwent surveillance, and then clinically progressed. The assigned patient numbers are to the left. Histology: patient 9, PTCL-NOS; patients 180, 291, and 317, AITL; patients 190 and 200, ALK+ ALCL; and patients 198 and 274, PTCL-TFH. (B) The pattern of fluctuation of quantitative ctDNA levels of patients 9 and 198 with persistently detectable ctDNA before clinical relapse. The x-axis represents time since the on-study date in months and is different for each graph. The y-axis represents the log10 of the quantity of each dominant clonotype (in clonotypes per milliliter). Each colored line represents a different clonotype. The horizontal gray line represents the median level of baseline ctDNA. The dashed vertical line represents EoT, the red vertical line represents time of progression . The green horizontal bar represents time in clinical remission, and the red horizontal bar represents time after progression.
ctDNA as surveillance monitoring in clinical progressors. The results of ctDNA detected in stored serum samples collected after therapy compared with conventional monitoring for clinical relapse with periodic clinic visits and regular CT scans. (A) Serum samples collected after therapy in 8 patients who achieved CR, underwent surveillance, and then clinically progressed. The assigned patient numbers are to the left. Histology: patient 9, PTCL-NOS; patients 180, 291, and 317, AITL; patients 190 and 200, ALK+ ALCL; and patients 198 and 274, PTCL-TFH. (B) The pattern of fluctuation of quantitative ctDNA levels of patients 9 and 198 with persistently detectable ctDNA before clinical relapse. The x-axis represents time since the on-study date in months and is different for each graph. The y-axis represents the log10 of the quantity of each dominant clonotype (in clonotypes per milliliter). Each colored line represents a different clonotype. The horizontal gray line represents the median level of baseline ctDNA. The dashed vertical line represents EoT, the red vertical line represents time of progression . The green horizontal bar represents time in clinical remission, and the red horizontal bar represents time after progression.
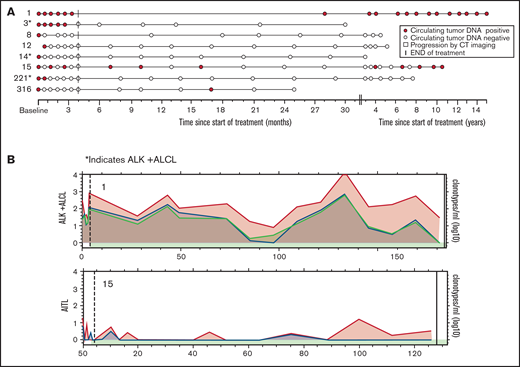
Role of ctDNA in surveillance monitoring in nonprogressors. (A) Serum samples collected after therapy in 8 patients who achieved a complete response and underwent surveillance but did not progress clinically. The assigned patient numbers are on the left. Histology: patients 1, 8, and 316, ALK− ALCL; patients 3, 14, and 221, ALK+ALCL; patient 12, PTCL-NOS; and patient 15, AITL. (B) The pattern of fluctuation of quantitative ctDNA levels of patients 1 and 15 with multiple time points of detectable ctDNA after therapy but no overt clinical relapse. The x-axis represents time since the on-study date in months and is different for each graph. The y-axis represents the log10 of the quantity of each dominant clonotype (in clonotypes per milliliter). Each colored line represents a different clonotype. The horizontal gray line represents the median level of baseline ctDNA. The dashed vertical line represents EoT, the red vertical line represents time of progression, and the black vertical line represents end of follow-up. The green horizontal bar represents time in clinical remission.
Role of ctDNA in surveillance monitoring in nonprogressors. (A) Serum samples collected after therapy in 8 patients who achieved a complete response and underwent surveillance but did not progress clinically. The assigned patient numbers are on the left. Histology: patients 1, 8, and 316, ALK− ALCL; patients 3, 14, and 221, ALK+ALCL; patient 12, PTCL-NOS; and patient 15, AITL. (B) The pattern of fluctuation of quantitative ctDNA levels of patients 1 and 15 with multiple time points of detectable ctDNA after therapy but no overt clinical relapse. The x-axis represents time since the on-study date in months and is different for each graph. The y-axis represents the log10 of the quantity of each dominant clonotype (in clonotypes per milliliter). Each colored line represents a different clonotype. The horizontal gray line represents the median level of baseline ctDNA. The dashed vertical line represents EoT, the red vertical line represents time of progression, and the black vertical line represents end of follow-up. The green horizontal bar represents time in clinical remission.
Discussion
To the best of our knowledge, this is the first study to use NGS of the T-cell receptor in cell-free DNA to identify dominant sequences for qualitative and quantitative assessment of ctDNA within a clinical trial for PTCL. Circulating tumor DNA has already shown clinical utility in B-cell lymphoid malignancies, in which it correlated with disease burden and can be used to track MRD during and after treartment.15,16,18 More precise measures of disease burden and response to therapy is of great importance in PTCL, as CR after frontline therapy is an inadequate indicator of long-term remission.27–29
Using high-throughput CDR3 amplification and sequencing, we detected dominant TCR sequences in most (76%) patients with untreated PTCL and tracked them in the serum throughout therapy and beyond. We observed significant heterogeneity among CDR3 sequences, with a total of 50 dominant clonotypes in the 18 patients who had both FFPE and baseline serum samples available for analysis. Mature T cells may undergo up to 8 rearrangements with a resultant 8 clonotypes; because of allelic deletion and exclusion, only 2 are functionally expressed in each type of cell.30–32 The diversity of CDR3 observed with ctDNA was similar to that described by whole-exome and RNA sequencing of cellular TCR in patients with PTCL-NOS,33 cutaneous T-cell lymphoma,34,35 or adult T-cell leukemia/lymphoma.36 In our study, most patients had up to 2 dominant TCRβ and TCRγ clonotypes detected, consistent with the presence of a single malignant clone. However, 4 patients, 2 with PTCL-NOS and 2 with ALCL, had 3 or more dominant TCRγ clonotypes detected, indicating the presence of multiple (sub)clones. At least some of these clonotypes may have arisen from nonmalignant cells involved in an immune reactive process, and not from the actual tumor.
Two hypotheses may explain this clonotypic heterogeneity. The malignant transformation that occurs before TCR rearrangement could result in subclones with divergent TCRγ and TCRβ, as has been suggested in adult T-cell leukemia/lymphoma37 and cutaneous T-cell lymphoma.34 Conversely, an inflammatory milieu, similar to the one described in conjunction with chronic Staphylococcus aureus infection in patients with mycosis fungoides, could give rise to several T-cell subclones, one of which could undergo malignant transformation.35 The lack of a greater clonotypic heterogeneity within our analysis, along with persistent clonotypes in patients with durable clinical remission, favor the latter hypothesis, although definitive conclusions require further studies.
Heterogeneity was not limited to clonotypes. Our patients’ diagnoses ranged from ALK+ ALCL, with a reported 5-year OS of 70%, to PTCL-NOS and angioimmunoblastic T-cell lymphoma (AITL), with a 5-year OS of 32%, and hepatosplenic T-cell lymphoma with a 5-year OS of 7%.1 This heterogeneity may in part account for the lack of difference in EFS or OS when we compared patients with baseline ctDNA levels that were higher and lower than the median. Similarly, we were unable to detect differences in survival between patients who cleared ctDNA after 2 cycles or at EoT, therapy compared with those with persistent levels of ctDNA, but this observation was greatly limited by the small number of patients in our series. Strikingly, 4 of 8 patients with PTCL who were in remission had posttreatment surveillance samples available for at least 1 ctDNA+ time point, and 2 of those 4 had surveillance samples that showed persistently ctDNA+ durable clinical remissions. These outcomes are in contrast to the data in DLBCL, where only 2 of 90 patients who were in remission and had low ctDNA+surveillance samples at 1 time point each and were negative when those time points were reanalyzed.15
In our study, the sensitivity, specificity, PPV, and NPV of interim and surveillance ctDNA as early biomarkers of relapse in PTCL were lower than those reported in patients with DLBCL who received similar treatment and whose samples were collected and analyzed in a similar manner.15 These test characteristics may not fully capture the potential utility of ctDNA clonotype detection and quantification. For example, diagnosis and restaging of patients with extranodal disease is particularly challenging to assess by conventional imaging, and the suspected sites of disease involvement may not be amenable to biopsy. In our study, 4 of 5 patients without disease on CT scans after therapy but with detectable ctDNA had extranodal disease at presentation, and all 4 ultimately relapsed. Conversely, 5 of 13 patients who were MRD− at EoT had residual disease by imaging, which indicates the limitations of ctDNA detection when a conservative algorithm is used to determine tumor-specific clonotypes. The use of ctDNA to identify patients with persistent extranodal disease that is undetected by imaging needs further evaluation.
Assays for ctDNA can also be used as a “liquid biopsy” to genotype lymphoid malignancies. Targeted exome sequencing of cell-free DNA was used for genotypic profiling of 25 patients with AITL or PTCL-NOS.38 This analysis focused on recurrent RHOA mutations, which were detectable in 16 (64%) patients; only 5 had serial samples available, and none were collected during first-line treatment. A limitation of this approach, however, is that a significant number of PTCL cases have few if any genomic alterations detectable even by whole-genome sequencing panels.39,40 Another limitation of liquid biopsies in PTCL is the potential to identify mutations that are not related to lymphoma pathogenesis. TET2 and DNMT3A mutations, common in AITL, are a hallmark of clonal hematopoiesis and may be detectable in ctDNA from patients without residual lymphoma. In contrast, TCR gene rearrangement is one of the defining characteristics of all mature T-cell malignancies, with tumor tissue TCRγ rearrangement detectable in 90% of patients.41 When 1-step and multiplex PCR assays were used for qualitative detection of TCRγ rearrangements in FFPE samples, the detection rate was 79%,12,42 compared with 86% of patients in our study with baseline FFPE samples in whom a clonotype was detected in both FFPE and serum.
Other strengths of our study include the uniformity of treatment that the patients received and the prespecified collection of correlative samples. However, the small study sample size and pathological heterogeneity prevent a complete evaluation of the utility of baseline, interim, and EoT ctDNA as a prognostic and predictive biomarker in PTCL and may not allow for true statistical differences to be seen. With that in mind, the positive and negative predictive values in this analysis were markedly lower than those in patients with DLBCL, where high-throughput amplification and sequencing of the immunoglobulin gene segments were used for ctDNA detection.15
In summary, high-throughput sequencing of the TCR detected dominant and likely tumor-specific clonotypes in most of the patients with PTCL and successfully tracked those clonotypes throughout therapy. MRD negativity, defined as clearance of ctDNA after 2 cycles or at EoT, did not significantly predict clinical outcomes, but the results should be interpreted with caution, given the small study sample size. Notably, persistence of TCR clonotypes after therapy was not universally associated with clinical relapse. However, for patients in whom clonotype persistence indicated MRD, median lead time from clonotype detection to progression was 12.5 months. The biologic explanation of the persistence of clonotypic TCR sequences after therapy in patients who achieve a durable complete response is unknown and should be the subject of future research. Assays designed to guide therapeutic decisions in PTCL require further optimization.
Acknowledgments
This research was supported in part by the Intramural Research Program of the National Institutes of Health, National Cancer Institute. The study was coordinated and funded by investigators in the Lymphoid Malignancies Branch of the National Cancer Institute, who participated in the study design, patient management, sample collection, data analysis and interpretation, and writing of the manuscript. The correlative study was performed as an academic collaboration with investigators from Adaptive Biotechnologies who participated in data analysis and interpretation and provided input for the manuscript. No medical writer was used. Data were analyzed and interpreted by the corresponding authors and made available to all authors. All authors approved the manuscript and vouch for the completeness and accuracy of the data and the fidelity of the trial to the protocol.
Authorship
Contribution: C.M. treated the patients, analyzed the data, and assisted in writing the first version of the manuscript; M.D.M. analyzed the data and wrote the first version of the manuscript; M.R. and R.L. treated the patients, analyzed the data, and reviewed the manuscript; N.L. treated the patients, collected the data, and reviewed the manuscript; A.J. and E.Y. analyzed the data, and reviewed the manuscript; S.P. and E.S.J. performed the pathology, analyzed the data, and reviewed the manuscript; and M.R. and W.H.W. treated the patients, designed the study, analyzed the data, and edited the final manuscript.
Conflict-of-interest disclosure: A.J. and E.Y. are employees of Adaptive Biotechnologies. The remaining authors declare no competing financial interests.
Corresponding author: Mark Roschewski, Lymphoid Malignancies Branch, CCR, NCI, Building 10, Room 4N115, National Institutes of Health, Bethesda, MD 20892; e-mail: mark.roschewski@nih.gov.

