

Key Points
DHODH inhibition synergizes with DNA-demethylating agents in the treatment of MDS.
DHODH inhibition enhances the incorporation of decitabine into DNA in MDS cells.

Abstract
Dihydroorotate dehydrogenase (DHODH) catalyzes a rate-limiting step in de novo pyrimidine nucleotide synthesis. DHODH inhibition has recently been recognized as a potential new approach for treating acute myeloid leukemia (AML) by inducing differentiation. We investigated the efficacy of PTC299, a novel DHODH inhibitor, for myelodysplastic syndrome (MDS). PTC299 inhibited the proliferation of MDS cell lines, and this was rescued by exogenous uridine, which bypasses de novo pyrimidine synthesis. In contrast to AML cells, PTC299 was inefficient at inhibiting growth and inducing the differentiation of MDS cells, but synergized with hypomethylating agents, such as decitabine, to inhibit the growth of MDS cells. This synergistic effect was confirmed in primary MDS samples. As a single agent, PTC299 prolonged the survival of mice in xenograft models using MDS cell lines, and was more potent in combination with decitabine. Mechanistically, a treatment with PTC299 induced intra-S-phase arrest followed by apoptotic cell death. Of interest, PTC299 enhanced the incorporation of decitabine, an analog of cytidine, into DNA by inhibiting pyrimidine production, thereby enhancing the cytotoxic effects of decitabine. RNA-seq data revealed the marked downregulation of MYC target gene sets with PTC299 exposure. Transfection of MDS cell lines with MYC largely attenuated the growth inhibitory effects of PTC299, suggesting MYC as one of the major targets of PTC299. Our results indicate that the DHODH inhibitor PTC299 suppresses the growth of MDS cells and acts in a synergistic manner with decitabine. This combination therapy may be a new therapeutic option for the treatment of MDS.
Introduction
Myelodysplastic syndrome (MDS) is a clonal bone marrow (BM) disorder characterized by ineffective and clonal hematopoiesis accompanied by morphological dysplasia and variable cytopenia. DNA methyltransferase inhibitors azacitidine and decitabine have been used as chemotherapeutic agents for high-risk MDS. They are chemical analogs of cytidine that have direct cytotoxicity and induce DNA hypomethylation by interfering with DNA methyltransferase. Overall survival has been prolonged in patients with MDS and acute myeloid leukemia (AML) transformed from MDS. In spite of these therapies, these diseases become uncontrolled in many cases and survival remains suboptimal. Median overall survival is 24.5 months in high-risk MDS patients treated with azacitidine.1 Allogenic hematopoietic stem cell transplantation is still considered the only potentially curative option, but is accessible to only a small number of patients because of factors such as advanced age, concomitant comorbidities, and donor availability. Therefore, innovative treatment strategies are needed.2
Dihydroorotate dehydrogenase (DHODH) catalyzes a rate-limiting step in de novo pyrimidine nucleotide synthesis, the conversion of DHO to orotate. DHODH inhibition was recently described as a potential new approach for treating AML by inhibiting cell proliferation and inducing cell death and the differentiation of diverse AML subclasses.3 Pyrimidine nucleotides can be generated by de novo synthesis or the salvage pathway in which pyrimidine nucleotides are obtained from the diet. Resting cells typically acquire adequate levels of pyrimidine nucleotides from the salvage pathway. Rapidly proliferating cells, such as leukemia cells, are dependent on the de novo synthesis of pyrimidine nucleotides.4,5 DHODH inhibitors, such as teriflunomide, brequinar, and vidofludimus, have been considered for use in oncology.6-8 PTC299 was initially identified as an inhibitor of the translation of VEGFA messenger RNA using a phenotypic screening platform.9 PTC299 was then subsequently determined to be a potent inhibitor of DHODH as its primary mechanism of action. Inhibition of VEGFA production by PTC299 is a downstream effect of inhibiting de novo pyrimidine synthesis because it can be completely rescued by exogenously added uridine but not by other nucleosides.10 The clinical development of PTC299 as a potential treatment option for AML was recently initiated (US Food and Drug Administration Clinical Trial No. NCT03761069).
In the present study, we examined the efficacy of DHODH inhibition with PTC299 in MDS cell lines, primary MDS cells from patients, and in xenograft MDS models. Our results indicate that PTC299 suppresses the growth of MDS cells in vitro and in vivo. In addition, we found that PTC299 synergizes with decitabine by enhancing its incorporation into DNA through the inhibition of pyrimidine nucleotide production.
Materials and methods
Cell culture and drug treatment
HL-60, THP-1, and SKM-1 cell lines were acquired from ATCC. MDS-L and TF-1 cell lines, which were provided by Dr. Kaoru Tohyama (Kawasaki Medical School, Japan) and Toshio Kitamura (The University of Tokyo), respectively, were authenticated by short tandem repeat profiling using a PowerPlex 16 HS system (Promega). Cells were maintained in RPMI-1640 supplemented with 10% fetal bovine serum (FBS) (Sigma-Aldrich) and 1% penicillin/streptomycin (Gibco). SKM-1 cells were cultured in RPMI supplemented with 20% FBS. MDS-L and TF-1 cells were cultured in the presence of human interleukin-3 (IL-3; 10 ng/mL, BioLegend) and 1 ng/mL of granulocyte-macrophage colony-stimulating factor (GM-CSF; 1 ng/mL, BioLegend), respectively. Stocks of PTC299 (synthesized at PTC Therapeutics) and decitabine (Wako) were prepared in dimethyl sulfoxide (DMSO; Sigma-Aldrich) at concentrations of 3 and 10 mM, respectively. In the growth assays, cells were seeded on 24-well plates in triplicate and treated with graded concentrations of PTC299 and decitabine. Decitabine was added to culture with daily refreshment resulting from the short-half time of this drug. Cells were counted using 0.1% trypan blue dye. MTS viability tests were conducted according to the manufacturer’s instructions (Promega). Synergism was assessed by calculating the proportion of cell growth using CompuSyn software (ComboSyn, Inc).11
Flow cytometric analysis and apoptosis and cell-cycle assays
The expression of CD11b and CD38 by cell lines was assessed using fluorochrome-tagged monoclonal antibodies (BD Biosciences). Apoptosis and the cell cycle were examined using an Annexin-V Apoptosis kit and a 5-bromo-2′-deoxyuridine (BrdU) Flow kit (BD Pharmingen) according to the manufacturer’s instructions. Flow cytometric analyses were performed on BD FACS Celesta (BD Bioscience).
RNA sequencing
Total RNA was isolated from MDS-L and SKM-1 cells treated with DMSO, 30 nM of PTC299, 200 nM of decitabine, and a combination of both agents using the RNeasy Mini Kit (Qiagen). After reverse transcription, the libraries for RNA-sequencing (RNA-seq) were generated from fragmented DNA with 15 cycles of amplification using a Next Ultra DNA Library Prep Kit (New England BioLabs). After the libraries had been quantified using the TapeStation (Agilent), samples were subjected to sequencing with Hiseq1500 (Illumina) and 61 cycles of the sequencing reactions were performed. RNA-seq raw reads (fastq files) were mapped to a human genome. Gene level counts for fragments mapping uniquely to the human genome were extracted from BAM files. Gene expression values were then calculated as reads per kilobase of exon units per million mapped reads using cufflinks (version 2.2.1). A gene set enrichment analysis (GSEA) was performed based on curated gene sets from the Broad Institute’s molecular signatures database MSigDB.
Deposition of data
RNA sequence data were deposited in the DNA Data Bank of Japan (accession number DRA 009271).
Conditional expression of c-MYC
MDS cells were transduced with the all-in-one Tet-on inducible lentiviral vector (Ai-LV) for the expression of c-MYC.12 Transduced cells were purified by cell sorting using green fluorescent protein as a marker. c-MYC expression was induced by the addition of doxycycline.
AkaBLI system
In vivo bioluminescence imaging (BLI) is a noninvasive method for measuring light output produced by the enzyme-catalyzed oxidation reaction of a substrate. The AkaBLI system, composed of AkaLumine-HCl and Akaluc, provides a light source of sufficient strength to penetrate body walls, even in deep tissue areas.13 pcDNA3/Venus-Akaluc was obtained from RIKEN BioResource Research Center (catalog no. RDB15781). The nucleotide sequence of the synthetic construct Akaluc gene for firefly luciferase mutant protein Akaluc is available under the DNA Data Bank of Japan accession no. LC320664. For generation of the CS-CDF-UbC-mScarlet-P2A-Akaluc-PRE lentiviral vector, mScarlet (synthesized by FASMAC Co. Ltd., Japan) and Akaluc CDS were cloned into the CS-CDF-UbCG-PRE lentiviral vector (catalog no. RDB08363, gift from Dr. H. Miyoshi) downstream of the ubiquitin C promoter (UbC) using the AgeI and XhoI restriction sites, replacing the existing green fluorescent protein CDS. The cloning primers were designed to include an in-frame addition of the GSG-P2A self-cleaving peptide sequence between the mScarlet and Akaluc sequences.
Lentiviral production and transduction
Recombinant mScarlet-P2A-Akaluc lentivirus was generated by transient cotransfection of HEK293T cells with CS-CDF-UbC-mScarlet-2A-Akaluc-PRE and the helper plasmids pMD2.G (Addgene #12259) as well as psPAX2 (Addgene #12260) using the polyethylenimine method. Culture supernatants were collected after 96 hours and filtered (22 µm), followed by concentration of the lentivirus particles by centrifugation at 40,000g for 4 hours.
Xenograft studies
All studies involving animals were performed in accordance with the institutional guidelines for the use of laboratory animals and approved by the Review Board for Animal Experiments of the University of Tokyo (approval ID PA18-42). Male NOD.Cg-Prkdcscid Il2rgtm1Sug/ShiJic (NOG) mice were purchased from CLEA Japan Inc (Tokyo, Japan). NOD.Cg-Prkdcscid Il2rgtm1Sug Tg (SRa-IL3, CSF2)7-2/Jic (NOG IL-3/GM-Tg) mice expressing human IL-3 and GM-CSF were purchased from the Central Institute for Experimental Animals (Kawasaki, Japan).14 SKM-1/Akaluc cells (2 × 10⁶ cells), which express the Akaluc gene, were inoculated into NOG mice irradiated at a dose of 0.5 Gy. One week after tumor inoculation, mice were randomly divided into 4 groups (5 mice per group) and treated with the indicated compounds. MDS-L/Akaluc cells (7.5 × 10⁶ cells) were inoculated into female NOG IL-3/GM-TG mice without any preconditioning. One week after tumor inoculation, mice were randomly divided into 3 groups (7 mice per group) and treated with the indicated compounds. One hundred microliters of 5 mM AkaLumine-HCl (Wako) was injected intraperitoneally into mice just before the imaging analysis and mice under isoflurane anesthesia were imaged within 5 to 10 minutes after injection. The following conditions were used for the image acquisition: open for total bioluminescence, exposure time = 30 seconds, binning = 2, field of view = 25 × 25 cm, and f/stop = 1. In vivo photon counting was conducted with an IVIS system using Living Image 2.5 software (Xenogen).15 Mice were monitored until they became moribund, at which time they were sacrificed.
Primary MDS samples
Freshly isolated primary MDS cells were obtained from the BM aspirates or peripheral blood of 6 patients with MDS and 2 patients with MDS/AML. The control BM cells were obtained from 1 patient with early-stage lymphoma without BM invasion. All patients provided written informed consent according to institutional guidelines. The present study was approved by the institutional review board at the University of Tokyo and Chiba University (approval #30-47-B1002 and #844, respectively). BM-mononuclear cells (MNCs) were isolated using LymphoPrep (Cosmo Bio) and CD34+ cells were obtained from BM-MNCs using a CD34 MicroBead kit (Miltenyi Biotec). CD34+ cells were seeded into culture flasks in RPMI medium supplemented with 1% penicillin/streptomycin, 20% FBS, and 10 ng/mL of stem cell factor (SCF), TPO, IL-3, GM-CSF, and FLT3 ligand (BioLegend). The effects of PTC299 and decitabine in combination were evaluated using the MTS viability test (Promega) and colony-forming assay.
Colony-forming assay
Ten thousand CD34+ cells per triplicate were plated in methylcellulose (H4230, Stemcell Technologies) with 10 ng/mL of SCF, TPO, IL-3, GM-CSF, and FLT3 ligand (BioLegend). Colonies were scored at day 7.
Statistical analysis
Data are shown as the mean ± standard deviation (SD) or standard error of the mean. In statistical analyses, P values were derived using unpaired Student t tests for any studies with only 2 groups. Otherwise, comparisons of groups were performed on log-transformed data using a 1-way analysis of variance (ANOVA) test. Survival curves were calculated by the Kaplan-Meier method and compared using the log-rank test. All analyses were made using GraphPad Prism Software.
Results
PTC299 inhibits the proliferation of MDS cell lines
A previous study reported that DHODH inhibition suppressed proliferation and induced the differentiation of AML cell lines.3 We evaluated the efficacy of PTC299, a novel small molecule DHODH inhibitor on AML cell lines (Figure 1A). PTC299 inhibited the proliferation of both HL60 and THP-1 cells (Figure 1B) and induced their differentiation, as evidenced by the upregulation of the differentiation marker CD11b (Figure 1C).
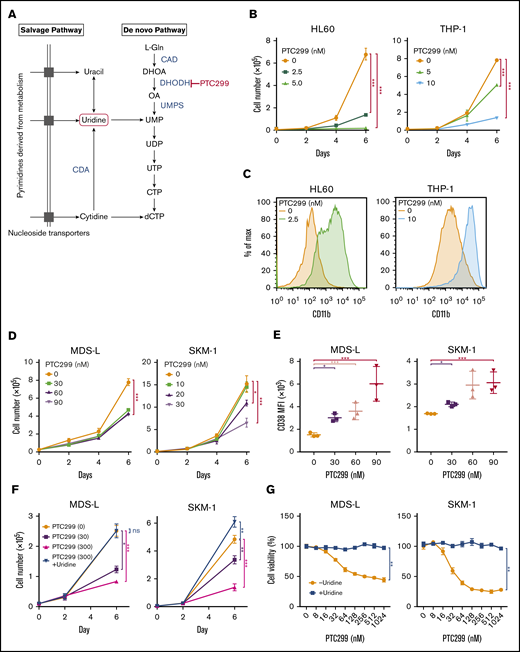
PTC299 inhibits the proliferation of MDS cell lines. (A) Schematic representation of the pyrimidine synthesis pathway. CAD, carbamoyl-phosphate synthetase 2, aspartate transcarbamylase, and dihydroorotase; CDA, cytidine deaminase; UMPS, UMP synthase. (B) Growth of HL-60 and THP-1 AML cells treated with the indicated concentrations of PTC299. The numbers of viable cells are shown as means ± SD (n = 3). ****P < .001 by a 1-way ANOVA. (C) Flow cytometric histograms showing CD11b expression levels on HL-60 and THP-1 cells treated with the indicated concentrations of PTC299 for 7 days. (D) Growth of MDS-L and SKM-1 MDS cells treated with the indicated concentrations of PTC299. The numbers of viable cells are shown as means ± SD (n = 3). *P < .05, ***P < .001 by 1-way ANOVA. (E) Mean fluorescent intensity (MFI) of CD38 on MDS-L and SKM-1 cells treated with the indicated concentrations of PTC299 for 7 days. Data are shown as means ± SD (n = 3). *P < .05, **P < .01, ***P < .001 by 1-way ANOVA. (F) MDS-L and SKM-1 cells were treated with PTC299 in the presence of an excess of uridine (100 μM) for 7 days. The numbers of viable cells are shown as means ± SD (n = 3). *P < .05, **P < .01, ***P < .001; ns, not significant by 1-way ANOVA. (G) MTS assays showing the viability of MDS-L and SKM-1 cells treated with the indicated doses of PTC299 with or without 100 μM uridine on day 7 of culture. Data represent mean ± SD (n = 4). **P < .01 by the Student t test.
PTC299 inhibits the proliferation of MDS cell lines. (A) Schematic representation of the pyrimidine synthesis pathway. CAD, carbamoyl-phosphate synthetase 2, aspartate transcarbamylase, and dihydroorotase; CDA, cytidine deaminase; UMPS, UMP synthase. (B) Growth of HL-60 and THP-1 AML cells treated with the indicated concentrations of PTC299. The numbers of viable cells are shown as means ± SD (n = 3). ****P < .001 by a 1-way ANOVA. (C) Flow cytometric histograms showing CD11b expression levels on HL-60 and THP-1 cells treated with the indicated concentrations of PTC299 for 7 days. (D) Growth of MDS-L and SKM-1 MDS cells treated with the indicated concentrations of PTC299. The numbers of viable cells are shown as means ± SD (n = 3). *P < .05, ***P < .001 by 1-way ANOVA. (E) Mean fluorescent intensity (MFI) of CD38 on MDS-L and SKM-1 cells treated with the indicated concentrations of PTC299 for 7 days. Data are shown as means ± SD (n = 3). *P < .05, **P < .01, ***P < .001 by 1-way ANOVA. (F) MDS-L and SKM-1 cells were treated with PTC299 in the presence of an excess of uridine (100 μM) for 7 days. The numbers of viable cells are shown as means ± SD (n = 3). *P < .05, **P < .01, ***P < .001; ns, not significant by 1-way ANOVA. (G) MTS assays showing the viability of MDS-L and SKM-1 cells treated with the indicated doses of PTC299 with or without 100 μM uridine on day 7 of culture. Data represent mean ± SD (n = 4). **P < .01 by the Student t test.
We then evaluated the effects of PTC299 on MDS cell lines. MDS-L is a subline derived from the human MDS cell line MDS92 established from the BM of an MDS patient.16-18 Unlike the parental MDS92 that contains differentiated dysplastic myeloid cells, MDS-L consists of blastic cells. This cell line has complex karyotypic abnormalities including del(5q) [der(5)(5;19)], monosomy 7, and a point mutation in the NRAS and TP53 genes.19 Although the fully transformed cell line cannot truly represent MDS, MDS-L has been widely used as a model of del(5q) MDS in several studies.20,21 SKM-1 is a cell line derived from a patient with MDS/AML, which has no chromosomal abnormalities, but has point mutations in NRAS and KRAS.22 TF-1 was isolated from a patient with erythroleukemia developed from MDS, which is dependent on GM-CSF for growth.23 MOLM-13 was derived from an MDS/AML patient with a complex karyotype and the MLL-AF9 fusion gene.24 PTC299 inhibited the proliferation of both MDS-L and SKM-1 cells (Figure 1D). However, PTC299 did not induce significant changes in the expression levels of CD11b, which had high basal expression, or morphology (data not shown). PTC299 only induced the dose-dependent upregulation of CD38 levels in MDS cell lines (Figure 1E). We performed a rescue experiment to confirm the specific inhibitory effects of PTC299 on the de novo pyrimidine synthesis pathway (Figure 1A). The growth inhibitory effects of PTC299 were completely prevented by the addition of excess of exogenous uridine, which bypasses the requirement for de novo pyrimidine synthesis by feeding into the salvage pathway, thereby negating the need for DHODH (Figure 1A, F-G). These results indicate that PTC299 potently inhibits the growth of MDS cells, but does not strongly induce their differentiation, and that the effect on growth is DHODH dependent and not because of general cytotoxicity.
PTC299 and DNA-demethylating agents exert synergistic cytotoxic effects
The sensitivity of some of the MDS cell lines, such as MDS-L and SKM-1, to PTC299 was markedly less than AML cells. PTC299 did not reduce the viability of MDS-L cells by more than 50% (Figure 2A). Other cell lines including AML cells were more sensitive to PTC299 as demonstrated by the low concentrations of PTC299 required to inhibit cell viability by 50% (cytotoxic concentration; CC50) (MDS-L, >1000 nM; SKM-1, 62.5 nM; TF-1, 2.0 nM; MOLM-13, 7.9 nM; THP-1, 28.7 nM; HL-60, 8.4 nM) (Figure 2A-B). Among MDS cell lines, MDS-L, which was derived from an MDS (not MDS/AML) patient, was the least sensitive to PTC299, suggesting that MDS cells may be less sensitive to PTC299 than AML cells.16 To enhance the therapeutic benefits of PTC299 on MDS cells, we investigated the possible synergism between PTC299 and decitabine, a first-line therapeutic agent in the treatment of MDS. We treated MDS-L and SKM-1 cells with increasing concentrations of PTC299 (0 to 240 nM) and decitabine (0 to 100 nM) as a single agent or in combination. After 5 days of culture, cells were analyzed by MTS assays. PTC299 and decitabine exerted synergistic cytotoxic effects in MDS-L cells at all concentrations tested, showing a very low combination index, which defines synergism when the calculated number is less than 1 (Figure 2C; supplemental Table 2). Another first-line agent, azacitidine, was effective in combination with PTC299 (Figure 2D). Brequinar, another DHODH inhibitor, also showed a synergistic effect with decitabine (Figure 2E). Apoptosis assays using Annexin V revealed that decitabine significantly, whereas PTC299 modestly, induced apoptosis in these cells (Figure 3A). Cell-cycle assays clearly showed that PTC299 induced intra-S-phase arrest (Figure 3B), similar to other DHODH inhibitors,25,26 whereas decitabine, which is incorporated into DNA in the S-phase, released intra-S-phase arrest by PTC299 when used in combination (Figure 3C).
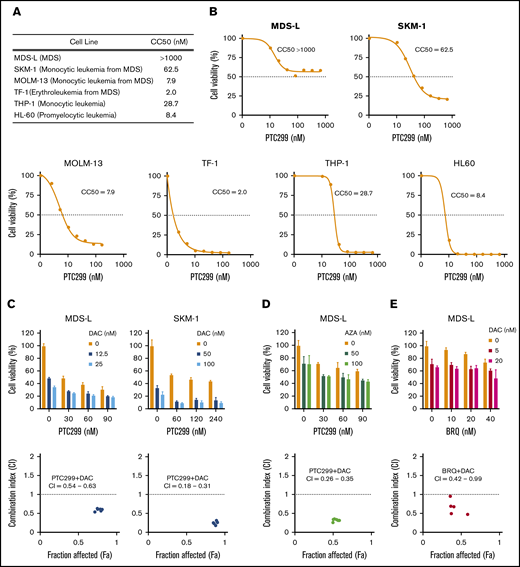
PTC299 and DNA-demethylating agents exert synergistic cytotoxic effects. (A) Summary of CC50 of PTC299 in AML and MDS cell lines. (B) CC50 plots of MDS and AML cells. Cells were treated with the indicated concentrations of PTC299 for 7 days in triplicate. CC50 was defined as the concentration required to reduce cell viability by 50%. Cell viability was determined by MTS assays. (C-E) MTS assays showing the viability of MDS cells treated with the indicated doses of (C) PTC299 and decitabine (DAC), (D) PTC299 and azacitidine (AZA), and (E) PTC299 and brequinar (BRQ) relative to the untreated control. Data are shown as mean ± SD (n = 3). Combination indexes (CI) are shown in the lower panel of each graph.
PTC299 and DNA-demethylating agents exert synergistic cytotoxic effects. (A) Summary of CC50 of PTC299 in AML and MDS cell lines. (B) CC50 plots of MDS and AML cells. Cells were treated with the indicated concentrations of PTC299 for 7 days in triplicate. CC50 was defined as the concentration required to reduce cell viability by 50%. Cell viability was determined by MTS assays. (C-E) MTS assays showing the viability of MDS cells treated with the indicated doses of (C) PTC299 and decitabine (DAC), (D) PTC299 and azacitidine (AZA), and (E) PTC299 and brequinar (BRQ) relative to the untreated control. Data are shown as mean ± SD (n = 3). Combination indexes (CI) are shown in the lower panel of each graph.
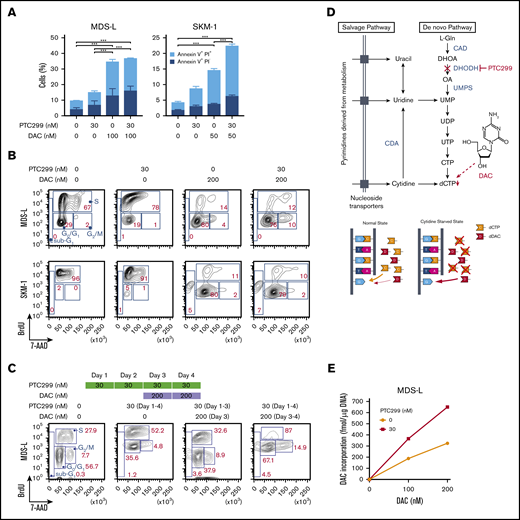
PTC299 enhances effects of decitabine. (A) Apoptosis induced by PTC299 and/or decitabine (DAC). MDS-L and SKM-1 cells were treated with PTC299 and/or DAC for 72 hours, stained with Annexin V and PI, and then analyzed by flow cytometry. Data are shown as mean ± SD (n = 3). *P < .05, **P < .01, ***P < .001 by 1-way ANOVA. (B) Cell-cycle status of MDS-L and SKM-1 cells treated with PTC299 and/or DAC for 72 hours. BrdU was added to the culture 2 hours before the analysis. (C) Cell-cycle status of MDS-L cells treated with PTC299 only for 48 hours followed by combination therapy with DAC. BrdU was added to the culture 2 hours before the analysis. (D) Schematic representation of the pyrimidine synthesis pathway and the target step in which DAC is incorporated into DNA. A proposed model of DAC incorporation into DNA in normal and cytidine starved states is depicted (bottom). (E) DAC incorporation into DNA in MDS-L cells in the presence of PTC299 for 24 hours. MDS-L cells were cultured in the presence of 0, 100, and 200 nM DAC for 24 hours with and without 30 nM PTC299. The amounts of DAC incorporated into DNA were assessed by an LC-MS/MS analysis.
PTC299 enhances effects of decitabine. (A) Apoptosis induced by PTC299 and/or decitabine (DAC). MDS-L and SKM-1 cells were treated with PTC299 and/or DAC for 72 hours, stained with Annexin V and PI, and then analyzed by flow cytometry. Data are shown as mean ± SD (n = 3). *P < .05, **P < .01, ***P < .001 by 1-way ANOVA. (B) Cell-cycle status of MDS-L and SKM-1 cells treated with PTC299 and/or DAC for 72 hours. BrdU was added to the culture 2 hours before the analysis. (C) Cell-cycle status of MDS-L cells treated with PTC299 only for 48 hours followed by combination therapy with DAC. BrdU was added to the culture 2 hours before the analysis. (D) Schematic representation of the pyrimidine synthesis pathway and the target step in which DAC is incorporated into DNA. A proposed model of DAC incorporation into DNA in normal and cytidine starved states is depicted (bottom). (E) DAC incorporation into DNA in MDS-L cells in the presence of PTC299 for 24 hours. MDS-L cells were cultured in the presence of 0, 100, and 200 nM DAC for 24 hours with and without 30 nM PTC299. The amounts of DAC incorporated into DNA were assessed by an LC-MS/MS analysis.
Decitabine is a chemical analog of cytidine that has direct cytotoxicity and induces DNA hypomethylation by interfering with DNA methyltransferase. PTC299 decreases dCTP and dTTP by inhibiting de novo pyrimidine synthesis.6 Cells treated with PTC299 are starved of cytidine. We suspected that, under this condition, cells will incorporate more decitabine, an analog of cytidine, instead of cytidine (Figure 3D). To prove this hypothesis, we cultured MDS-L cells in the presence of 0, 100, and 200 nM decitabine for 24 hours with and without 30 nM PTC299. We then purified DNA from treated cells and conducted a liquid chromatography tandem mass spectometry (LC-MS/MS) analysis on the content of decitabine incorporated into DNA. One-step multienzyme digestion was used to release the DNA-bound drug following the protocol reported by Chilakala et al.26 Enzyme-released decitabine along with other mononucleosides were separated by an Atlantis Silica HILIC Column using high organic mobile phases and quantified by mass spectrometry using the multiple-reaction-monitoring mode. A stable heavy isotope of 2′-deoxycytidine 15N3 was used as an internal standard. As expected, the amounts of decitabine incorporated were increased in a dose-dependent manner and enhanced twofold in the presence of PTC299 (Figure 3E).
PTC299 downregulates c-MYC in MDS cells
To understand the effects of PTC299 on the transcriptome and identify critical target genes, we performed an RNA-seq analysis of MDS-L and SKM-1 cells treated with 30 nM of PTC299 and 200 nM of decitabine as a single agent or in combination, and DMSO-treated control cells. We selected genes up- (≥1.5-fold) and downregulated (≤0.66-fold) in both MDS-L and SKM-1 cells upon the PTC299 treatment, and then performed the Kyoto Encyclopedia of Genes and Genomes pathway enrichment analysis. The pyrimidine metabolism pathway was negatively enriched in the overlapping genes (Figure 4A). GSEA of RNA-seq data revealed that MYC target gene sets were negatively enriched with significance in PTC299- or decitabine-treated cells and cells treated in combination (Figure 4B). PTC299 treatment induced downregulation of MYC target genes, but not global gene expression in both MDS-L and SKM-1 cells (supplemental Figure 1), suggesting that MYC is one of the specific target genes downregulated by PTC299. Reverse transcriptase quantitative polymerase chain reaction confirmed that the expression of c-MYC was downregulated after the treatment with single agents, which was further enhanced by the combination in both cell lines (Figure 4C-D). Similar results were obtained at protein levels (Figure 4E). To understand the impact of c-MYC downregulation on the cytotoxic effects of PTC299 in MDS cells, we conditionally overexpressed c-MYC in MDS-L cells using a Tet-on lentivirus system.12 Exogenous c-MYC largely prevented PTC299-mediated growth suppression of MDS-L cells (Figure 4F), which was accompanied by a decrease in S-phase cells and an increase in G2/M cells (Figure 4G). These results suggest that sustained c-MYC expression conferred resistance to PTC299 on MDS-L cells.
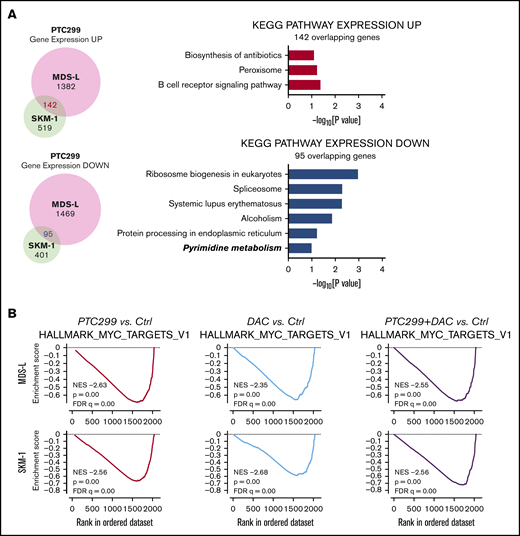
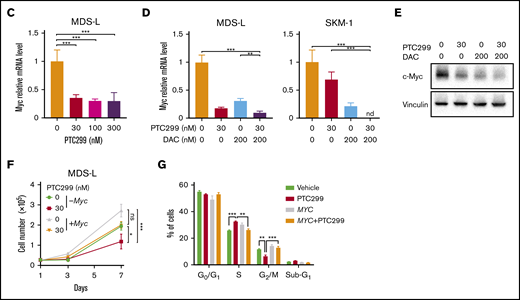
PTC299 downregulates c-MYC in MDS cells. (A) Venn diagram showing the overlap of down- (≤0.66-fold) or upregulated (≥1.5-fold) genes between MDS-L and SKM-1 cells treated with PTC299 relative to the DMSO control (left). Kyoto Encyclopedia of Genes and Genomes pathways enriched in overlapping genes (right) (B) GSEA plots showing the enrichment of MYC target genes in MDS-L (upper) and SKM-1 (lower) cells treated with PTC299 (left), DAC (center), and their combination (right) relative to control (Ctrl) cells. Normalized enrichment scores (NES), nominal P values (NOM), and false discovery rates (FDR) are indicated. (C-D) Quantitative reverse transcriptase-polymerase chain reaction (RT-PCR) analysis of c-MYC in MDS cells treated with the indicated doses of (C) PTC299 and (D) 30 nM PTC299, 200 nM DAC as a single agent or in combination for 48 hours. GAPHD was used to normalize the amount of input RNA. nd, not detected. Data are shown as the mean ± SD (n = 3). (E) Immunoblotting of the extracts from MDS-L cells treated with PTC299 and/or DAC. (F) Growth of MDS-L cells with exogenous c-MYC in the presence of PTC299. MDS-L cells transduced with the Tet-on c-MYC plasmid were cultured in the presence and absence of 30 nM PTC299. c-MYC expression was induced by adding 1 μg/mL doxycycline. (G) The proportions of cells at the indicated phases of cell cycle are shown. MDS-L cells with or without exogenous c-MYC were treated with PTC299 for 72 hours. BrdU was added to the culture 2 hours before the analysis. Data are shown as the mean ± SD (n = 3). *P < .05, **P < .01, ***P < .001; ns, not significant by 1-way ANOVA.
PTC299 downregulates c-MYC in MDS cells. (A) Venn diagram showing the overlap of down- (≤0.66-fold) or upregulated (≥1.5-fold) genes between MDS-L and SKM-1 cells treated with PTC299 relative to the DMSO control (left). Kyoto Encyclopedia of Genes and Genomes pathways enriched in overlapping genes (right) (B) GSEA plots showing the enrichment of MYC target genes in MDS-L (upper) and SKM-1 (lower) cells treated with PTC299 (left), DAC (center), and their combination (right) relative to control (Ctrl) cells. Normalized enrichment scores (NES), nominal P values (NOM), and false discovery rates (FDR) are indicated. (C-D) Quantitative reverse transcriptase-polymerase chain reaction (RT-PCR) analysis of c-MYC in MDS cells treated with the indicated doses of (C) PTC299 and (D) 30 nM PTC299, 200 nM DAC as a single agent or in combination for 48 hours. GAPHD was used to normalize the amount of input RNA. nd, not detected. Data are shown as the mean ± SD (n = 3). (E) Immunoblotting of the extracts from MDS-L cells treated with PTC299 and/or DAC. (F) Growth of MDS-L cells with exogenous c-MYC in the presence of PTC299. MDS-L cells transduced with the Tet-on c-MYC plasmid were cultured in the presence and absence of 30 nM PTC299. c-MYC expression was induced by adding 1 μg/mL doxycycline. (G) The proportions of cells at the indicated phases of cell cycle are shown. MDS-L cells with or without exogenous c-MYC were treated with PTC299 for 72 hours. BrdU was added to the culture 2 hours before the analysis. Data are shown as the mean ± SD (n = 3). *P < .05, **P < .01, ***P < .001; ns, not significant by 1-way ANOVA.
PTC299 and decitabine combination exerts synergistic effects on primary MDS cells
We investigated the efficacy of the combined treatment of PTC299 and decitabine in primary cells derived from 4 MDS patients and an MDS/AML patient. CD34+ hematopoietic stem/progenitor cells were purified from the BM MNCs of MDS patients by a column separation method. CD34+ MDS cells were then cultured in the presence of SCF, TPO, IL-3, GM-CSF, and FLT3 ligand. Cell growth at 48 to 72 hours in culture was examined by MTS assays. Patient characteristics are listed in supplemental Table 1. The growth inhibitory effects of PTC299 and decitabine were further enhanced by the combination in primary MDS cells (Figure 5A). The combination index with ID-04 was 0.32 to 0.79, indicating a synergistic cytotoxic effect of PTC299 and decitabine (Figure 5B). Colony-forming assays also revealed a synergistic effect of PTC299 and decitabine, whereas the combination treatment little affected the colony formation of normal CD34+ BM cells (Figure 5C). The expression of c-MYC was also downregulated in primary MDS cells treated with PTC299 (Figure 5D).
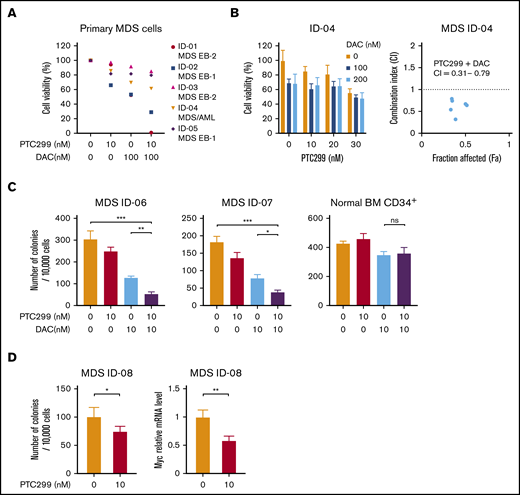
PTC299 and decitabine synergize on primary MDS cells. (A) MTS assays showing the viability of primary MDS cells treated with the indicated doses of PTC299 and/or DAC relative to the untreated control. CD34+ MDS cells were cultured in the presence of SCF, TPO, IL-3, GM-CSF, and FLT3 ligand. Cell growth was examined by MTS assays at 48 to 72 hours in culture. Each diagnosis was shown at the right of patient ID. MDS EB-1, MDS with excess blasts-1; MDS EB-2, MDS with excess blasts-2. (B) MTS assays showing the viability of primary MDS cells derived from ID-4 patient treated with the indicated doses of PTC299 in combination with the indicated doses of DAC relative to the untreated control (left). Combination indexes (CI) are in the right panel. (C) Colony formation by CD34+ MDS and normal BM cells treated with PTC299 and/or DAC in methylcellulose. The number of colonies were counted at day 10 of culture. (D) Colony formation by CD34+ MDS BM cells treated with PTC299 in methylcellulose. The number of colonies were counted at day 10 of culture (left). Quantitative RT-PCR analysis of c-MYC in MDS cells treated with 10 nM PTC299 for 48 hours. GAPHD was used to normalize the amount of input RNA. Data are shown as the mean ± SD. *P < .05, **P < .01, ***P < .001; ns, not significant by 1-way ANOVA.
PTC299 and decitabine synergize on primary MDS cells. (A) MTS assays showing the viability of primary MDS cells treated with the indicated doses of PTC299 and/or DAC relative to the untreated control. CD34+ MDS cells were cultured in the presence of SCF, TPO, IL-3, GM-CSF, and FLT3 ligand. Cell growth was examined by MTS assays at 48 to 72 hours in culture. Each diagnosis was shown at the right of patient ID. MDS EB-1, MDS with excess blasts-1; MDS EB-2, MDS with excess blasts-2. (B) MTS assays showing the viability of primary MDS cells derived from ID-4 patient treated with the indicated doses of PTC299 in combination with the indicated doses of DAC relative to the untreated control (left). Combination indexes (CI) are in the right panel. (C) Colony formation by CD34+ MDS and normal BM cells treated with PTC299 and/or DAC in methylcellulose. The number of colonies were counted at day 10 of culture. (D) Colony formation by CD34+ MDS BM cells treated with PTC299 in methylcellulose. The number of colonies were counted at day 10 of culture (left). Quantitative RT-PCR analysis of c-MYC in MDS cells treated with 10 nM PTC299 for 48 hours. GAPHD was used to normalize the amount of input RNA. Data are shown as the mean ± SD. *P < .05, **P < .01, ***P < .001; ns, not significant by 1-way ANOVA.
PTC299 and decitabine exert synergistic effects in the xenograft MDS model
We assessed the efficacy of PTC299 in xenograft mouse models of MDS. To precisely monitor the tumor burden in mice, we took advantage of the AkaBLI system, composed of AkaLumine-HCl and Akaluc, which improved performance by a factor of 100 to 1000 over the conventional bioluminescence imaging system composed of d-luciferin and firefly luciferase. AkaBLI provided a light source of sufficient strength to penetrate body walls, even in deep tissue areas, thereby allowing the noninvasive visualization of single cells deep inside freely moving animals.13 SKM-1 and MDS-L cells were transduced with the Akaluc gene using lentiviruses and selected by mScarlet expression as a marker. SKM-1/Akaluc (2 × 10⁶) and MDS-L/Akaluc cells (7.5 × 10⁶) were intravenously inoculated into NOG mice irradiated at a dose of 0.5 Gy and NOG mice expressing human IL-3 and GM-CSF (NOG IL-3/GM-TG)14 without any preconditioning, respectively. Recipient mice were then treated with PTC299 and decitabine as a single agent or in combination (Figure 6A,C). The tumor burden was monitored by bioluminescence signals in in vivo imaging assays and bioluminescence signals in mice were detected weekly. SKM-1 cells, which exhibit MDS/AML-like features, rapidly expanded and induced lethal diseases in NOG mice. PTC299 and decitabine both exerted mild inhibitory effects on the growth of SKM-1 cells as single agents, but significantly suppressed their growth in combination, resulting in the significant extension of survival of recipient mice (Figure 6B). In contrast to SKM-1 cells, MDS-L cells, which retain MDS-like features, expand very slowly in NOG IL-3/GM-TG mice. PTC299 and decitabine inhibited the growth of MDS-L cells as single agents, although their effects were not statistically significant (Figure 6C-E; supplemental Figure 2). In contrast, PTC299 and decitabine significantly suppressed the growth of MDS-L cells in combination (Figure 6D-E; supplemental Figure 2). These results clearly indicate that PTC299 enhances the therapeutic efficacy of decitabine against MDS cells. Treatment by single agents or combination did not significantly affect the body weight or blood cell counts of NOG mice (Figure 6F), suggesting that the toxicity of PTC299 and/or decitabine was tolerable.
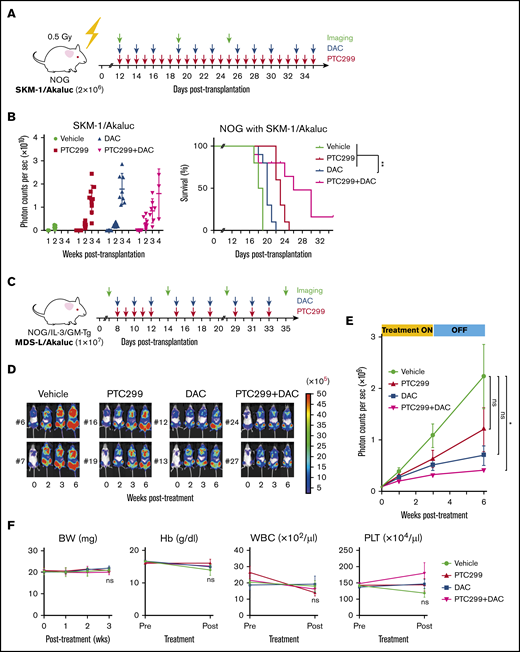
PTC299 and decitabine exert synergistic effects in the xenograft MDS model. (A) Schematic representation of the xenograft MDS model using NOG mice. Bioluminescence signals in NOG mice infused with 2 × 10⁶ SKM-1/Akaluc cells via the tail vein. NOG mice were irradiated at a dose of 0.5 Gy just before transplantation. Starting on day 12 posttransplantation, recipient mice received vehicle once a day (QD) orally every day (n = 5), 10 mg/kg of PTC299 QD orally every day (n = 5), 0.3 mg/kg of DAC intraperitoneally 3 times per week (n = 5), and PTC299 and DAC (n = 5) for 3 weeks. (B) Quantification of photon counts from SKM-1/Akaluc cells in xenograft MDS mice. Bioluminescence signals taken by a photon-counting analyzer, are shown in the left panel. Akaluc activity in treated mice was detected weekly. A Kaplan-Meier survival curve is depicted in the right panel. The data shown were obtained from 2 independent experiments. **P < .01 by the log-rank test. (C) Schematic representation of the xenograft MDS model using NOG IL-3/GM-TG mice. Bioluminescence signals in NOG IL-3/GM-TG mice infused with 7.5 × 10⁶ MDS-L/Akaluc cells via the tail vein. NOG IL-3/GM-TG mice were received transplantation without any preconditioning. Starting on day 8 posttransplantation, recipient mice received vehicle QD or 10 mg/kg of PTC299 QD orally for 5 consecutive days for the first week and followed by 3 days per week for 2 weeks (n = 7), and PTC299 and DAC (n = 7) for 3 weeks. DAC was administered in a dose of 0.3 mg/kg intraperitoneally 3 times per week. (D-E) Quantification of photon counts from MDS-L/Akaluc cells in xenograft MDS mice. Bioluminescence activity in treated mice was detected. (D) Images of bioluminescence signals in representative mice (2 mice each) at different time points during the treatment. € The quantitative photon count in each group. (F) Body weight (BW) and hemoglobin (Hb) levels of mice. Data are shown as the mean ± standard error of the mean. *P < .05; ns, not significant by 1-way ANOVA.
PTC299 and decitabine exert synergistic effects in the xenograft MDS model. (A) Schematic representation of the xenograft MDS model using NOG mice. Bioluminescence signals in NOG mice infused with 2 × 10⁶ SKM-1/Akaluc cells via the tail vein. NOG mice were irradiated at a dose of 0.5 Gy just before transplantation. Starting on day 12 posttransplantation, recipient mice received vehicle once a day (QD) orally every day (n = 5), 10 mg/kg of PTC299 QD orally every day (n = 5), 0.3 mg/kg of DAC intraperitoneally 3 times per week (n = 5), and PTC299 and DAC (n = 5) for 3 weeks. (B) Quantification of photon counts from SKM-1/Akaluc cells in xenograft MDS mice. Bioluminescence signals taken by a photon-counting analyzer, are shown in the left panel. Akaluc activity in treated mice was detected weekly. A Kaplan-Meier survival curve is depicted in the right panel. The data shown were obtained from 2 independent experiments. **P < .01 by the log-rank test. (C) Schematic representation of the xenograft MDS model using NOG IL-3/GM-TG mice. Bioluminescence signals in NOG IL-3/GM-TG mice infused with 7.5 × 10⁶ MDS-L/Akaluc cells via the tail vein. NOG IL-3/GM-TG mice were received transplantation without any preconditioning. Starting on day 8 posttransplantation, recipient mice received vehicle QD or 10 mg/kg of PTC299 QD orally for 5 consecutive days for the first week and followed by 3 days per week for 2 weeks (n = 7), and PTC299 and DAC (n = 7) for 3 weeks. DAC was administered in a dose of 0.3 mg/kg intraperitoneally 3 times per week. (D-E) Quantification of photon counts from MDS-L/Akaluc cells in xenograft MDS mice. Bioluminescence activity in treated mice was detected. (D) Images of bioluminescence signals in representative mice (2 mice each) at different time points during the treatment. € The quantitative photon count in each group. (F) Body weight (BW) and hemoglobin (Hb) levels of mice. Data are shown as the mean ± standard error of the mean. *P < .05; ns, not significant by 1-way ANOVA.
Discussion
In the present study, we investigated the therapeutic efficacy of PTC299, a novel DHODH inhibitor, on MDS cells. We showed that PTC299 exerted antiproliferation effects on MDS cells similar to AML cells. Of note, MDS cell lines that retained the features of MDS before leukemic transformation16 were less sensitive to PTC299 than AML cells in terms of growth inhibition and the induction of differentiation, suggesting that MDS cells are less dependent on the de novo pyrimidine synthesis pathway than AML cells. The expression levels of DHODH in MDS and AML patients are comparable to those in healthy controls (GEO database and Beat AML data viewer [Vizome]). Therefore, the levels of DHODH may not be crucial in terms of efficacy of DHODH inhibitor. However, PTC299 synergized with DNA-demethylating agents in the treatment of MDS cells. Mechanistically, we demonstrated that PTC299 enhanced the incorporation of decitabine in MDS cells by an LC-MS/MS analysis. Cells treated with PTC299 are starved of cytidine, resulting in intra-S-phase arrest. Under this condition, MDS cells may have incorporated more decitabine, an analog of cytidine, instead of cytidine. The incorporation of decitabine was previously shown to be directly related to treatment effect.27 Therefore, the enhancement of decitabine incorporation by DHODH inhibitors represents a novel combination therapy that enhances the cytotoxic effects of decitabine. Decitabine and azacitidine not only exhibit cytotoxicity, but also hypomethylating activity. DNA hypomethylation is observed at lower concentrations rather than at higher concentrations, the latter of which is associated with direct cytotoxicity through DNA double-strand breaks.28 The clinically used dosages of decitabine and azacitidine mainly focus on their hypomethylating activity.29 We chose to use low-dose decitabine in in vivo experiments to match the clinical dose.30 PTC299 efficiently synergized with low doses of decitabine in MDS xenograft model mice and suppressed disease progression. Therefore, we postulate that PTC299 combined with hypomethylating agents would be effective even at the clinical dosage.
We previously referred to the possible synergism between PTC299 and cytarabine (AraC),6 a deoxycytidine analog used as a standard chemotherapeutic agent to treat AML. The increased activity of the combination of AraC with PTC299 may reflect the more efficient incorporation of AraC into DNA because of a reduction in the levels of competing endogenous pyrimidine nucleotides, as we demonstrated with decitabine in the present study. Although combination therapy with AraC may be a promising option for various types of hematological malignancies, eligible patients may be limited due to enhanced cytotoxic effects because high-dose AraC therapy is only accessible and well tolerated by a small number of patients.31 In contrast, hypomethylating agents are widely used in clinical settings, such as for MDS and elderly AML patients, and side effects are generally considered to be tolerable. PTC299 does not inhibit the proliferation of normal cells, including hematopoietic stem cells at concentrations 1000-fold greater than its 50% inhibitory concentration in tumor cells in vitro6 and was shown to be generally well tolerated in clinical trials.32 Therefore, PTC299 with hypomethylating agents might be widely applied to the treatment of AML and MDS, including older aged patients, because of a tolerable safety profile.
We also determined that the effect of PTC299 was at least partly the result of downregulation of c-MYC. PTC299 and decitabine both downregulated c-MYC, and their combination was additive. Transfection of MDS cells with c-MYC largely attenuated the growth inhibitory effects of PTC299. The gene expression profiles of CD34+ cells from MDS patients showed c-MYC as one of the most upregulated genes in these patients.33 The amplification of MYC at 8q24.21 has also been reported at low frequencies in MDS including patients with trisomy 8, in which c-MYC expression was upregulated and c-MYC inhibition induced the specific loss of trisomy 8 cell viability in cultures.34 These findings suggest that c-MYC is also a therapeutic target in MDS, similar to AML.35 Other DHODH inhibitors, Breqinar and BAY 2402234, also downregulate c-MYC,25,36 indicating that downregulation of c-MYC is not an off-target effect of PTC299. The mechanisms by which PTC299 downregulates c-MYC remain unclear. This issue may be an important next step in studying the mechanisms underlying the cytotoxic effects of DHODH inhibition not directly associated with the suppression of pyrimidine synthesis. The impact of c-MYC downregulation in AML cells is another issue to be examined to obtain a deeper understanding of the therapeutic efficacy of PTC299 for MDS, as a precursor to AML, and AML.
RNA sequence data were deposited in the DNA Data Bank of Japan (accession number DRA 009271).
Acknowledgments
The authors thank Tomoyuki Yamaguchi for providing Tet-on c-Myc vector and Mikako Kuribayashi for illustrating the mouse picture. The super-computing resource was provided by the Human Genome Center, the Institute of Medical Science, the University of Tokyo.
This work was supported in part by Grants-in-Aid for Scientific Research (#19H05653) and Scientific Research on Innovative Areas “Replication of Non-Genomic Codes” (#19H05746) from MEXT, Japan, and grants from the Takeda Science Foundation and the Princess Takamatsu Cancer Research Fund.
Author contributions
K.K. and A.I. designed this study; K.K. performed experiments, analyzed data, and actively wrote the manuscript; Y.N., S. Kaito, D.S., Y.N.-T., S. Koide, W.K., M.Y., C.Z., and N.M. performed experiments and analyzed data; M.O. analyzed next-generation sequencing data; K.I., S.Y., S.I., A.M., H.J.B., K.I., S.Y., and R.I. set up the xenograft mouse model; S.I. and A.M. developed and provided the AkaBLI system; K.T. developed and provided the MDS-L cell line; W.L., J.S., and M.W. developed and supplied PTC299; E.S. and K.Y. conceptualized the research and edited the manuscript; and A.I. conceived of and directed the project, secured funding, and actively wrote the manuscript.
Conflict-of-interest disclosure: W.L., J.S., and M.W. are employed by PTC Therapeutic and have received salary compensation for time, effort, and hold or held financial interest in the company. The remaining authors declare no competing financial interests.
Correspondence: Atsushi Iwama, Division of Stem Cell and Molecular Medicine, Center for Stem Cell Biology and Regenerative Medicine, The Institute of Medical Science, The University of Tokyo, 4-6-1 Shirokanedai, Minato-ku, Tokyo 108-8639, Japan; e-mail: 03aiwama@ims.u-tokyo.ac.jp.

