

Key Points
The LCL161/LBH regimen effectively induces cell death in MM cells in vitro and in vivo.
The LCL161/LBH regimen inactivates the noncanonical NF-κB pathway and activates the extrinsic apoptotic pathway.

Abstract
Interactions between the inhibitor of apoptosis protein antagonist LCL161 and the histone deacetylase inhibitor panobinostat (LBH589) were examined in human multiple myeloma (MM) cells. LCL161 and panobinostat interacted synergistically to induce apoptosis in diverse MM cell lines, including those resistant to bortezomib (PS-R). Similar interactions were observed with other histone deacetylase inhibitors (MS-275) or inhibitors of apoptosis protein antagonists (birinapant). These events were associated with downregulation of the noncanonical (but not the canonical) NF-κB pathway and activation of the extrinsic, caspase-8–related apoptotic cascade. Coexposure of MM cells to LCL161/LBH589 induced TRAF3 upregulation and led to TRAF2 and NIK downregulation, diminished expression of BCL-XL, and induction of γH2A.X. Ectopic expression of TRAF2, NIK, or BCL-XL, or short hairpin RNA TRAF3 knock-down, significantly reduced LCL161/LBH589 lethality, as did ectopic expression of dominant-negative FADD. Stromal/microenvironmental factors failed to diminish LCL161/LBH589–induced cell death. The LCL161/LBH589 regimen significantly increased cell killing in primary CD138+ cells (N = 31) and was particularly effective in diminishing the primitive progenitor cell–enriched CD138–/19+/20+/27+ population (N = 23) but was nontoxic to normal CD34+ cells. Finally, combined LCL161/LBH589 treatment significantly increased survival compared with single-agent treatment in an immunocompetent 5TGM1 murine MM model. Together, these findings argue that LCL161 interacts synergistically with LBH589 in MM cells through a process involving inactivation of the noncanonical NF-κB pathway and activation of the extrinsic apoptotic pathway, upregulation of TRAF3, and downregulation of TRAF2/BCL-XL. Notably, this regimen overcomes various forms of resistance, is active against primary MM cells, and displays significant in vivo activity. This strategy warrants further consideration in MM.
Introduction
Multiple myeloma (MM) is an accumulative malignant disorder of mature plasma cells that is generally incurable. Nevertheless, significant progress has been made in developing novel, targeted agents against this disease, including proteasome inhibitors (eg, bortezomib, carfilzomib), immunomodulatory agents (eg, lenalidomide), and antibodies (eg, daratumumab, anti-BCMA conjugate).1 However, resistance to these agents universally supervenes, justifying the search for new agents and rational combination strategies. Histone deacetylase inhibitors (HDACIs) represent epigenetic agents that act by deacetylating histone tails, leading to a less compact chromatin structure, thereby promoting the transcription of genes encoding for cell differentiation and/or cell death.2 HDACIs (eg, belinostat, romidepsin) have been approved for the treatment of T-cell malignancies (eg, cutaneous T-cell lymphoma, peripheral T-cell lymphoma),3 but their roles in other hematopoietic malignancies, including those of B-cell origin, remain to be defined. Notably, the pan-HDACI panobinostat (LBH589; LBH) has been approved when combined with bortezomib in patients with relapsed/refractory MM.4
Inhibitor of apoptosis (IAP) proteins are encoded by BIRC family genes and include cIAP1, cIAP2, XIAP, and survivin, among others.5 The antiapoptotic actions of these agents are opposed by second mitochondrial-derived activator of caspases (SMAC), which is released during mitochondrial permeabilization and triggers cell death.6 The prevalence of IAPs in cancer, and in MM in particular,7 has prompted the development of SMAC mimetics such as the monovalent IAP antagonist LCL161 (LCL).8 SMAC mimetics activate caspases directly and may thereby circumvent the resistance conferred by antiapoptotic proteins such as BCL-2 and MCL-1.9 In addition, SMAC mimetics have been shown to downregulate c-IAP1/2, which has been implicated in the regulation of the NF-κB pathway, an important survival signaling cascade in MM.10 Preclinical studies have shown that LCL161 potentiates the activity of cytotoxic agents in various tumor types,11-13 and a phase 1 trial of LCL161 and cyclophosphamide has been completed in patients with MM.8
The observation that agents which interrupt NF-κB signaling potentiate HDACI activity in malignant hematopoietic cells14 raised the possibility that SMAC mimetics might interact beneficially with these agents. Currently, interactions between HDACIs and SMAC mimetics have been minimally explored in MM or other tumor types. Here we describe synergistic interactions between LBH and LCL161 in cultured MM cells, including those resistant to bortezomib, as well as in primary MM cells but not in normal hematopoietic progenitors. Interestingly, this process seems to involve inactivation of the noncanonical rather than the canonical NF-κB pathway, accompanied by TRAF3 induction as well as activation of the extrinsic apoptotic cascade. Significantly, the regimen circumvented stromal cell–related forms of resistance and was tolerable and effective against an in vivo MM model.
Methods
Cell lines and reagents
Human MM cell lines MM.1S, MM.1R, NCI-H929, and U266, and RPMI8226 cells and human BM stroma HS-5 cells, were maintained in RPMI 1640 supplemented with 10% fetal bovine serum and penicillin-streptomycin. U266 and RPMI8226 were authenticated (Basic STR Profiling Service, ATCC 135-X) by ATCC (Manassas, VA) immediately after this study was completed.
All experiments used logarithmically growing cells (4-5 × 10⁵ cells/mL). MycoAlert (Lonza, Allendale, NJ) assays were performed, showing that all cell lines were free of mycoplasma contamination.
Ex vivo assay
An ex vivo assay was used to quantify the chemosensitivity of primary MM cells as described previously.15,16 Briefly, myeloma cells were purified from bone marrow aspirates by using CD138 affinity chromatography and plated in a collagen matrix with bone marrow stroma and patient plasma. After incubation overnight, tumor cells were treated with LCL161, LBH589, or the combination and then assayed for 96 hours using a robotic microscope equipped with an incubation chamber (EVOS FL Auto, Thermo Fisher Scientific, Waltham, MA). The MM cell line MM1.S was used in parallel to control for drug potency across experiments. Bright-field images taken every 30 minutes captured cell movement and membrane motion to identify live cells. Synergy was determined by using the method described by Sudalagunta et al,17 in which percent live cells across time and 5 serially diluted (1:3) concentrations when treated with LCL161 and LBH589 are used to compute additive response using the Bliss Independence Model. The additive response serves as a reference to determine the extent of synergy observed in each patient sample by comparing it with the percent live cells measured when treated with the combination (at a fixed ratio of the 2 constituent single agents). Two metrics of drug sensitivity were used, area under the curve and median lethal dose, in which the additive area under the curve/median lethal dose are compared with that of the combination to quantify the synergy seen in each patient sample.
Investigators obtained signed informed consent from all patients donating marrow who were enrolled on protocols HM3340 (Virginia Commonwealth University) and on 14690 and 18608 (H. Lee Moffitt Cancer Center and Research Institute) as approved by the respective institutional review boards. Patient samples were used in accordance with the Declaration of Helsinki, International Ethical Guidelines for Biomedical Research Involving Human Subjects, the Belmont Report, and the US Common Rule. The medical records were deidentified, and only information relating to prebiopsy treatment was reviewed.
Statistical analysis
Values represent the means ± standard deviation for at least 3 independent experiments performed in triplicate. The significance of differences between experimental variables was determined by using the Student t test or one-way analysis of variance with the Tukey-Kramer multiple comparisons test. The significance of P values is indicated as follows: *P < .05, **P < .01, or ***P < .001.
Animal studies
All animal studies were approved by the Institutional Animal Care and Use Committee and were performed in accordance with the Association for Assessment and Accreditation of Laboratory Animal Care, the United States Department of Agriculture, and Public Health Service guidelines. For the orthotopic murine model, C57BL/KaLwRij mice were injected intravenously with 5 × 10⁶ 5TGM1 murine multiple myeloma cells stably transfected with a construct encoding luciferase (5TGM1/Luc). Treatment started from day 13 after injection with cells. Details on drug preparation are provided in the supplemental Materials and Methods. Both LCL161 (30 mg/kg, 3 days per week) and LBH589 (13.3 mg/kg, 5 days per week) were administered via intraperitoneal injection. Control animals were injected with equal volumes of vehicle.
Further details about the methods used and all additional data are available in the supplemental Appendix.
Results
LCL/LBH coadministration synergistically induces apoptosis in MM cells
Exposure (24 hours) of MM1.S cells to 5 µM LCL or 5 nM LBH minimally or modestly induced apoptosis, respectively (terminal deoxynucleotidyltransferase-mediated dUTP nick end labeling assay); combined treatment sharply increased cell death (Figure 1A, left panels). Quantitation of apoptosis revealed a significant increase with combined exposure (P < .01) (Figure 1A, right panel). Isobologram analysis yielded combination index values <1.0, consistent with synergistic interactions (Figure 1B). Minimally toxic concentrations of LBH significantly increased apoptosis over a range of LCL (1-10 µM) and LBH (3-7 nM) concentrations (Figure 1C). Western blot analysis showed that combined LBH and LCL exposure markedly increased caspase-3 and PARP degradation (Figure 1D). Very similar interactions were observed in multiple other MM cell lines, including 8226, H929, U266, bortezomib-resistant PS-R,18 and MM1.R (dexamethasone-resistant) cells (supplemental Figure 1). Comparable results were obtained with other HDACIs (eg, belinostat [PXD101] or MS-275) and SMAC mimetics (eg, birinapant [TL32711]) in U266 and their bortezomib-resistant counterparts (PS-R) (supplemental Figure 2).
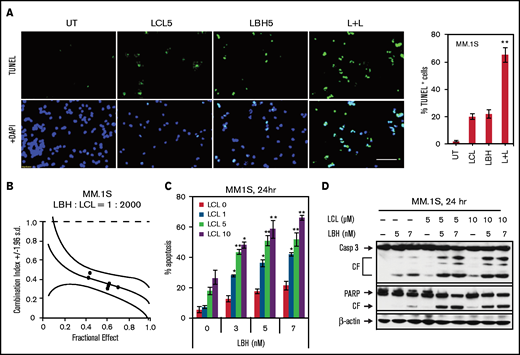
LCL161/LBH589 (panobinostat) synergistically induces apoptosis in MM.1S cells. (A) MM.1S cells were exposed (24 hours) to 5 µM LCL with or without 5 nM LBH, followed by terminal deoxynucleotidyltransferase-mediated dUTP nick end labeling (TUNEL) staining (left panel) using fluorescence microscopy (bar = 40 µm). The percentages of TUNEL (+) cells are presented in the right panel. (B) MM.1S cells were exposed (24 hours) to varying concentrations of LBH ± LCL at a fixed ratio (1: 2000), after which the percentage of 7-AAD+ cells was determined. Combination index values <1.0 denote a synergistic interaction. (C) MM.1S cells were exposed to the indicated concentrations of LBH ± LCL for 24 hours, followed by flow cytometric analysis of cell death after staining with 7-AAD. (D) MM.1S cells were incubated with LBH ± LCL for 24 hours. Caspase-3 and PARP were monitored by immunoblotting analysis. β-actin was assayed to ensure equivalent loading and transfer. *P < .05, **P < .01. All experiments were repeated three times. CF, cleavage fragment; DAPI, 4′,6-diamidino-2-phenylindole.
LCL161/LBH589 (panobinostat) synergistically induces apoptosis in MM.1S cells. (A) MM.1S cells were exposed (24 hours) to 5 µM LCL with or without 5 nM LBH, followed by terminal deoxynucleotidyltransferase-mediated dUTP nick end labeling (TUNEL) staining (left panel) using fluorescence microscopy (bar = 40 µm). The percentages of TUNEL (+) cells are presented in the right panel. (B) MM.1S cells were exposed (24 hours) to varying concentrations of LBH ± LCL at a fixed ratio (1: 2000), after which the percentage of 7-AAD+ cells was determined. Combination index values <1.0 denote a synergistic interaction. (C) MM.1S cells were exposed to the indicated concentrations of LBH ± LCL for 24 hours, followed by flow cytometric analysis of cell death after staining with 7-AAD. (D) MM.1S cells were incubated with LBH ± LCL for 24 hours. Caspase-3 and PARP were monitored by immunoblotting analysis. β-actin was assayed to ensure equivalent loading and transfer. *P < .05, **P < .01. All experiments were repeated three times. CF, cleavage fragment; DAPI, 4′,6-diamidino-2-phenylindole.
The combination of LCL161 and LBH589 downregulates cIAP1 and induces γH2A.X but does not inactivate the canonical NF-κB pathway in MM cells
The impact of LCL/LBH exposure on proteins involved in the canonical NF-κB pathway was examined. Exposure (16 or 24 hours) of U266 or MM.1S to LCL (±LBH) markedly downregulated cIAP1, as previously described in multiple other cell types,19-21 but had a more modest effect on cIAP2 (Figure 2A-B, upper panels). Cotreatment also sharply induced γH2A.X, an indicator of DNA damage known to be induced by SMAC mimetics,22 in both MM cell lines. In contrast, exposure of U266 or MM.1S cells to either agent alone or in combination either increased or had only minor effects on p-p65 (Figure 2A-B, lower panels), an indicator of canonical NF- B activation.23 Compatible results observed by using an NF-κB p65 Chemi Act Assay are shown in Figure 2C and 2D. These findings argue against interruption of the canonical NF-κB pathway as a contributor to LBH/LCL synergism.
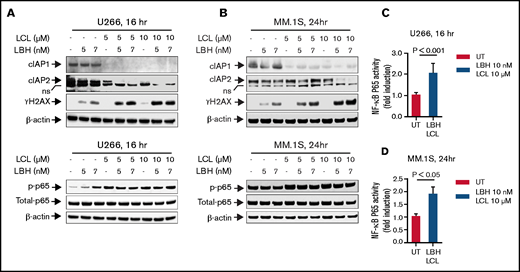
The combination of LCL161 and LBH589 activates the canonical NF-κB pathway and induces DNA damage in MM cells. (A and B) U266 cells or MM.1S cells were exposed to the indicated concentrations of LBH ± LCL for 16 hours (U266) or 24 hours (MM.1S). Immunoblotting analysis was then performed to monitor levels of cIAP1, cIAP2, γH2A.X, p-p65, and p65. β-actin was assayed to ensure equivalent loading and transfer. All experiments were repeated three times. (C and D) DNA binding of NF-kB (p65 subunit) was determined by using a TransAM assay for NF-κB activity.
The combination of LCL161 and LBH589 activates the canonical NF-κB pathway and induces DNA damage in MM cells. (A and B) U266 cells or MM.1S cells were exposed to the indicated concentrations of LBH ± LCL for 16 hours (U266) or 24 hours (MM.1S). Immunoblotting analysis was then performed to monitor levels of cIAP1, cIAP2, γH2A.X, p-p65, and p65. β-actin was assayed to ensure equivalent loading and transfer. All experiments were repeated three times. (C and D) DNA binding of NF-kB (p65 subunit) was determined by using a TransAM assay for NF-κB activity.
The LCL/LBH regimen diminishes activation of the noncanonical NF-B pathway in MM cells
Effects of combined LCL/LBH exposure on the noncanonical NF-κB pathway were then investigated. Exposure of U266 cells to LBH upregulated TRAF3, and this action was potentiated by LCL coadministration (Figure 3A). This was accompanied by modest downregulation of NIK (NF-κB–initiating kinase) as well as diminished expression of p52, a hallmark of noncanonical NF-κB activation.24 The combination also modestly but discernibly downregulated TRAF2, a component of both the canonical and noncanonical NF-κB pathways,25 as well as BCL-XL, whose expression is regulated in part by the noncanonical pathway.26 Comparable results were observed in MM.1S cells (Figure 3B). Finally, coadministration of alternative HDACIs (MS-275) and Smac mimetics (birinapant) triggered similar events in U266 and bortezomib-resistant PS-R cells (eg, increased caspase-3 and PARP cleavage, TRAF3 upregulation, and downregulation of cIAP1, TRAF2, and NIK) (supplemental Figure 3A). Together, these findings are consistent with the notion that activity of the LCL/LBH regimen involves inactivation of the noncanonical NF-κB pathway.
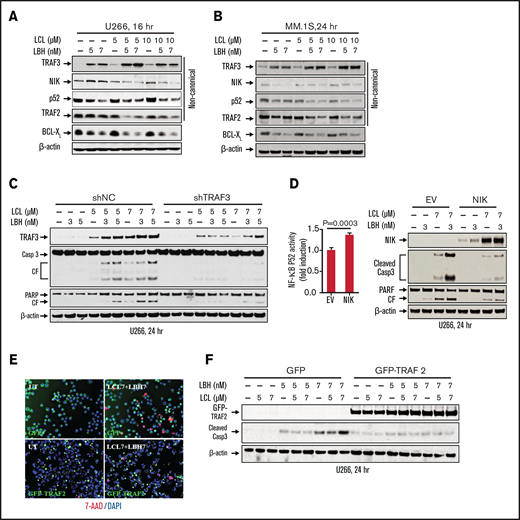
The LCL/LBH regimen diminishes activation of the noncanonical NF-κB pathway in MM cells. (A and B) U266 or MM.1S cells were exposed to the indicated concentrations of LCL ± LBH for 16 hours (U266) or 24 hours (MM.1S). Immunoblotting analysis was then performed to monitor levels of TRAF3, NIK, p52, TRAF2, and BCL-XL. (C) U266/shNC and U266/shTRAF3 cells were exposed to the indicated concentrations of LCL ± LBH for 24 hours. Immunoblotting analysis was then performed to monitor levels of TRAF3, caspase-3, and PARP. (D) U266/EV and U266/NIK cells were exposed to the indicated concentrations of LCL (3 µM) ± LBH (7 nM) for 24 hours. Immunoblotting analysis was then performed to monitor levels of NIK, caspase-3, and PARP. DNA binding of NF-kB (p52 subunit) was determined by using a TransAM assay for NF-kB activity. (E and F) U266/GFP and U266/GFP-TRAF2 cells were exposed to the indicated concentrations of LCL ± LBH for 24 hours. Cells were stained with 7-AAD, and cytospin slides were prepared. Imaging was taken by fluorescence microscopy (bar = 40 µm). Immunoblotting analysis was then performed to monitor levels of GFP-TRAF2 and cleaved caspase-3. β-actin was assayed to ensure equivalent loading and transfer. All experiments were repeated three times CF, cleavage fragment; DAPI, 4′,6-diamidino-2-phenylindole.
The LCL/LBH regimen diminishes activation of the noncanonical NF-κB pathway in MM cells. (A and B) U266 or MM.1S cells were exposed to the indicated concentrations of LCL ± LBH for 16 hours (U266) or 24 hours (MM.1S). Immunoblotting analysis was then performed to monitor levels of TRAF3, NIK, p52, TRAF2, and BCL-XL. (C) U266/shNC and U266/shTRAF3 cells were exposed to the indicated concentrations of LCL ± LBH for 24 hours. Immunoblotting analysis was then performed to monitor levels of TRAF3, caspase-3, and PARP. (D) U266/EV and U266/NIK cells were exposed to the indicated concentrations of LCL (3 µM) ± LBH (7 nM) for 24 hours. Immunoblotting analysis was then performed to monitor levels of NIK, caspase-3, and PARP. DNA binding of NF-kB (p52 subunit) was determined by using a TransAM assay for NF-kB activity. (E and F) U266/GFP and U266/GFP-TRAF2 cells were exposed to the indicated concentrations of LCL ± LBH for 24 hours. Cells were stained with 7-AAD, and cytospin slides were prepared. Imaging was taken by fluorescence microscopy (bar = 40 µm). Immunoblotting analysis was then performed to monitor levels of GFP-TRAF2 and cleaved caspase-3. β-actin was assayed to ensure equivalent loading and transfer. All experiments were repeated three times CF, cleavage fragment; DAPI, 4′,6-diamidino-2-phenylindole.
To investigate the functional significance of these events, parallel studies were performed in MM cells ectopically expressing proteins of interest or short hairpin RNA (shRNA) strategies. Coadministration of LCL161 and LBH in cells expressing TRAF3 shRNA resulted in diminished TRAF3 upregulation accompanied by reduced caspase-3 and PARP cleavage compared with empty vector controls (Figure 3C). Quantitation of apoptosis confirmed a significant reduction in cell death in TRAF3 shRNA cells (supplemental Figure 3B). Similarly, cells ectopically expressing NIK exposed to the combination exhibited increased NF-κB p52 activity (Figure 3D, left panel), reduced caspase-3/PARP cleavage (Figure 3D, right panel), and diminished apoptosis (supplemental Figure 3C) compared with controls.
Parallel studies performed in U266 cells ectopically expressing TRAF2 revealed diminished cell death (7-AAD staining) after LCL/LBH exposure (Figure 3E) as well as reduced caspase-3 cleavage compared with empty vector controls (Figure 3F). Finally, ectopic expression of BCL-XL in 8226 cells clearly diminished LCL/LBH–induced PARP cleavage (supplemental Figure 4A) and significantly reduced cell death (supplemental Figure 4B) compared with controls. Collectively, these findings argue that upregulation of TRAF3 and downregulation of TRAF2, NIK, and BCL-XL contribute functionally to LCL/LBH–mediated lethality in MM cells.
Blockade of the extrinsic apoptotic pathway is involved in LCL/LBH–induced apoptosis
The impact of LCL/LBH exposure on the extrinsic apoptotic pathway was then examined. LCL/LBH robustly activated DR4 but not DR5 aggregation in U266 cells (supplemental Figure 5). Combined exposure of MM.1S cells to both agents sharply increased caspase-8 and caspase-9 cleavage associated with increased cleavage of caspase-3 (Figure 4A). Increased cleavage/activation of caspase-8 was also observed in U266 and PS-R cells exposed to TL32711 and MS-275 (Figure 4B). To determine the functional significance of these events, U266 cells expressing dominant-negative caspase-8 were used. Dominant-negative caspase-8 cells were significantly less sensitive to LCL/LBH–induced cell death than empty vector counterparts (P < .01) (Figure 4C). Equivalent results were observed in cells expressing dominant-negative FADD (Figure 4D).
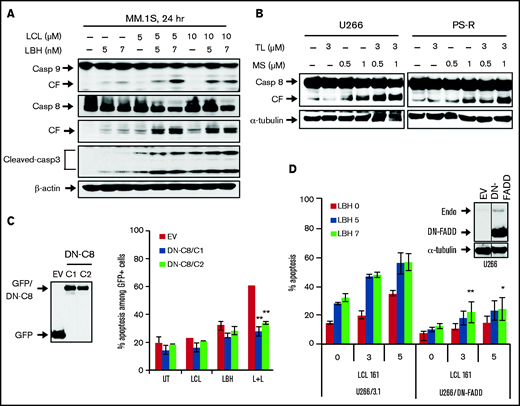
Blockade of the extrinsic apoptotic pathway diminished LCL/LBH–induced apoptosis. (A) MM.1S cells were exposed to the indicated concentrations of LCL ± LBH for 24 hours. Immunoblotting analysis was then performed to monitor levels of caspase-8 and cleaved caspase-3. (B) Bortezomib-naive U266 cells or bortezomib-resistant PS-R cells were exposed to the indicated concentrations of TL ± MS for 24 hours. Immunoblotting analysis was then performed to monitor levels of caspase-8. (C and D) U266/dominant-negative caspase-8 (DN-C8) and U266/dominant-negative FADD (DN-FADD) cells were established by stably transfecting human dominant-negative caspase-8 complementary DNA or DN-FADD complementary DNA. Immunoblotting analysis was then performed to monitor levels of GFP and FADD. A black border indicates that the blots are cut from the same membrane and same exposure time. α-Tubulin or β-actin was assayed to ensure equivalent loading and transfer. Cells were treated with LCL ± LBH for 24 hours, after which the percentage of 7-AAD+ cells was determined by flow cytometry. *P < .05, **P < .01. All experiments were repeated three times. CF, cleavage fragment.
Blockade of the extrinsic apoptotic pathway diminished LCL/LBH–induced apoptosis. (A) MM.1S cells were exposed to the indicated concentrations of LCL ± LBH for 24 hours. Immunoblotting analysis was then performed to monitor levels of caspase-8 and cleaved caspase-3. (B) Bortezomib-naive U266 cells or bortezomib-resistant PS-R cells were exposed to the indicated concentrations of TL ± MS for 24 hours. Immunoblotting analysis was then performed to monitor levels of caspase-8. (C and D) U266/dominant-negative caspase-8 (DN-C8) and U266/dominant-negative FADD (DN-FADD) cells were established by stably transfecting human dominant-negative caspase-8 complementary DNA or DN-FADD complementary DNA. Immunoblotting analysis was then performed to monitor levels of GFP and FADD. A black border indicates that the blots are cut from the same membrane and same exposure time. α-Tubulin or β-actin was assayed to ensure equivalent loading and transfer. Cells were treated with LCL ± LBH for 24 hours, after which the percentage of 7-AAD+ cells was determined by flow cytometry. *P < .05, **P < .01. All experiments were repeated three times. CF, cleavage fragment.
To confirm the involvement of caspases in these events, the pan-caspase inhibitor Boc-Z-FMK, the caspase-9 inhibitor Z-LEHD-FMK, or the caspase-8 inhibitor Z-IEHD-FMK was used. These inhibitors significantly blocked LCL/LBH–induced caspase activation and cell killing (supplemental Figure 6A-C). Boc-Z-FMK was used to determine whether upregulation of γH2AX (reflecting DNA damage, as shown in Figure 2A-B [upper panels]) represents a primary cause of LCL/LBH–induced lethality or a consequence of caspase activation. This inhibitor had little effect on γH2AX induction by LCL/LBH (supplemental Figure 6A, lower panel). Similar results were seen with the DNA-damaging agent melphalan, although a slight reduction in γH2AX was noted (supplemental Figure 6D). These findings indicate that activation of the extrinsic apoptotic pathway contributes functionally to LCL/LBH lethality in MM cells and suggests that LCL/LBH–mediated DNA damage represents a primary rather than secondary event.
LCL/LBH is active against primary CD138+ MM cells and diminishes the primitive progenitor cell–enriched CD138−/CD19+/CD20+/CD27+ population while sparing normal CD34+ cells
Effects of the LCL/LBH regimen on primary MM cells were then investigated. BM mononuclear cells from a patient with MM resistant to bortezomib were exposed (24 hours) to LCL ± LBH, after which cells were stained with CD138-PE (red) and Annexin V-FITC (green) probes. Although single agents had no or modest effects on the number of CD138+ cells or apoptosis, combined treatment resulted in a marked reduction in CD138+ cells and increased Annexin positivity (Figure 5A, upper panel). In contrast, bortezomib had little effect. Flow cytometric quantitation of CD138+ cells yielded consistent results (Figure 5A, lower panel).
![LCL/LBH is active against primary CD138+ MM cells and reduces the primitive progenitor cell–enriched CD138−/CD19+/CD20+/CD27+ population while sparing normal CD34+ cells. (A) Representative primary bone marrow cells from a patient with MM (relapse and refractory [RR]; prior bortezomib) were exposed to LBH (5 nM) ± LCL (5 µM) for 24 hours, after which the cells were stained with CD138-PE and Annexin V (Ann V)-FITC. Images were obtained with an IX71-Olympus inverted system microscope at 20× magnification. Flow cytometric analysis was performed to determine the CD138+ population. (B) After exposure to LBH (5 nM) ± LCL (5 µM) for 24 hours, the percentage of primitive CD138–/CD19+/CD20+/CD27+ cells in bone marrow mononuclear cells from a primary MM sample was determined by multi-color flow cytometry. The percentage of viable cells shown in red boxes (as Annexin V–/7-AAD–) is displayed after normalization of viable cells in untreated samples to 100%. The viability of the treated samples was calculated related to values for the untreated sample. (C) Flow cytometry comparison of effects of LCL161/LBH589 on primary CD138+ MM cells (left) and cord blood (CB) CD34+ cells (right). (D) Parallel experiments were conducted with 31 primary samples. Viability of CD138+ cells was analyzed by using multi-color flow cytometry determination of Annexin V-FITC. Lines indicate means and standard deviations (P < .001 or P < .0013). (E) After exposure to LBH (5-10 nM) ± LCL (5 µM) for 24 hours, apoptosis of CD138–/CD19+/CD20+/CD27+ cells (n = 23) was analyzed by Annexin V-FITC staining and quantitated by using multi-color flow cytometry (P < .0001 or P < .0078). (F) Parallel experiments were conducted with 6 primary CB CD34+ samples (n = 6; P = .0661 or P = .2290). FSC, forward scatter; SSC, side scatter.](https://ash.silverchair-cdn.com/ash/content_public/journal/bloodadvances/5/19/10.1182_bloodadvances.2020003597/5/m_advancesadv2020003597f5.png?Expires=1765885226&Signature=RDk3xTD7U4MdqikBL0oAtqRCx07Z1nSZlny4tEGwiOks3y4kuyRb7nAFBBsim9SsXRFJcLDeO-G5OGNZ7rfu9PqBXe6IbRMHYPmStcELquamjAjPrY9IjSgoT3qF7oTbz4fYpZ1L7nRwMXaXKyYinYG-~V7DLGK7j6ImSr3X9AQ6vfzG87YKRV0~2sl9wo0FuEPW-Rq6tPK79DEc0EX74LfL7MB4d9pyjg9EohQZJX2sZxziE7ebdXlKykxylPyuWT52FNv5KmJkV5lWameuauwTWLPlBUwmZ0ruC9RxScRo3me2aDV4yLhQbN3FPzud~rVu0ZGD2KAr2v1wC7klIQ__&Key-Pair-Id=APKAIE5G5CRDK6RD3PGA)
LCL/LBH is active against primary CD138+ MM cells and reduces the primitive progenitor cell–enriched CD138−/CD19+/CD20+/CD27+ population while sparing normal CD34+ cells. (A) Representative primary bone marrow cells from a patient with MM (relapse and refractory [RR]; prior bortezomib) were exposed to LBH (5 nM) ± LCL (5 µM) for 24 hours, after which the cells were stained with CD138-PE and Annexin V (Ann V)-FITC. Images were obtained with an IX71-Olympus inverted system microscope at 20× magnification. Flow cytometric analysis was performed to determine the CD138+ population. (B) After exposure to LBH (5 nM) ± LCL (5 µM) for 24 hours, the percentage of primitive CD138–/CD19+/CD20+/CD27+ cells in bone marrow mononuclear cells from a primary MM sample was determined by multi-color flow cytometry. The percentage of viable cells shown in red boxes (as Annexin V–/7-AAD–) is displayed after normalization of viable cells in untreated samples to 100%. The viability of the treated samples was calculated related to values for the untreated sample. (C) Flow cytometry comparison of effects of LCL161/LBH589 on primary CD138+ MM cells (left) and cord blood (CB) CD34+ cells (right). (D) Parallel experiments were conducted with 31 primary samples. Viability of CD138+ cells was analyzed by using multi-color flow cytometry determination of Annexin V-FITC. Lines indicate means and standard deviations (P < .001 or P < .0013). (E) After exposure to LBH (5-10 nM) ± LCL (5 µM) for 24 hours, apoptosis of CD138–/CD19+/CD20+/CD27+ cells (n = 23) was analyzed by Annexin V-FITC staining and quantitated by using multi-color flow cytometry (P < .0001 or P < .0078). (F) Parallel experiments were conducted with 6 primary CB CD34+ samples (n = 6; P = .0661 or P = .2290). FSC, forward scatter; SSC, side scatter.
LCL/LBH is active against primary CD138+ MM cells and reduces the primitive progenitor cell–enriched CD138−/CD19+/CD20+/CD27+ population while sparing normal CD34+ cells. (A) Representative primary bone marrow cells from a patient with MM (relapse and refractory [RR]; prior bortezomib) were exposed to LBH (5 nM) ± LCL (5 µM) for 24 hours, after which the cells were stained with CD138-PE and Annexin V (Ann V)-FITC. Images were obtained with an IX71-Olympus inverted system microscope at 20× magnification. Flow cytometric analysis was performed to determine the CD138+ population. (B) After exposure to LBH (5 nM) ± LCL (5 µM) for 24 hours, the percentage of primitive CD138–/CD19+/CD20+/CD27+ cells in bone marrow mononuclear cells from a primary MM sample was determined by multi-color flow cytometry. The percentage of viable cells shown in red boxes (as Annexin V–/7-AAD–) is displayed after normalization of viable cells in untreated samples to 100%. The viability of the treated samples was calculated related to values for the untreated sample. (C) Flow cytometry comparison of effects of LCL161/LBH589 on primary CD138+ MM cells (left) and cord blood (CB) CD34+ cells (right). (D) Parallel experiments were conducted with 31 primary samples. Viability of CD138+ cells was analyzed by using multi-color flow cytometry determination of Annexin V-FITC. Lines indicate means and standard deviations (P < .001 or P < .0013). (E) After exposure to LBH (5-10 nM) ± LCL (5 µM) for 24 hours, apoptosis of CD138–/CD19+/CD20+/CD27+ cells (n = 23) was analyzed by Annexin V-FITC staining and quantitated by using multi-color flow cytometry (P < .0001 or P < .0078). (F) Parallel experiments were conducted with 6 primary CB CD34+ samples (n = 6; P = .0661 or P = .2290). FSC, forward scatter; SSC, side scatter.
Multicolor flow cytometry was used to quantify the effect of the LCL/LBH regimen on CD138+ bone marrow cells as well as on a more primitive population putatively enriched for stem cell–like cells (CD138–/CD19+/CD20+/CD27+).27 Whereas LCL or LBH individually had little effect on the viability of the former cells, combined treatment reduced viability by ∼60% (Figure 5B). In the latter population, agents administered individually had modest effects on survival, whereas combined treatment sharply increased cell death. Side-by-side analysis of CD138+ cells and normal CD34+ cord blood mononuclear cells revealed a marked increase in cell death in MM cells with combined treatment but little evidence of toxicity for individual agents or the combination in the nonmalignant mononuclear cells (Figure 5C).
The activity of the regimen was then examined in a larger series of primary MM cells in which NGS cancer hotspot mutations (eg, RAS, PDGFRA, IDH1, KIT) were monitored (supplemental Table 1). A significant proportion of MM cells harbor recurring mutations in RAS (9 of 12 [75%]), PDGFRA (4 of 12 [30%]), KIT (3 of 12 [25%]), and KDR (3 of 12 [25%]) genes, and these mutations can be associated with poor prognosis in patients with MM.28-31 Combined treatment significantly increased cell death compared with LBH or LCL alone (P < .0001 and P = .013, respectively; N = 31) (Figure 5D). Similar increases were observed in the case of CD138–/CD19+/CD20+/CD27+; P < .001 and P = .0078; N = 23) (Figure 5E). In contrast, normal CD34+ cells displayed no increase in cell killing with individual agents or the combination (N = 6) (Figure 5F).
The LCL/LBH combination circumvents microenvironment-driven resistance
Attempts were then made to determine what effects stromal cell factors might have on LCL/LBH anti-myeloma activity. Green fluorescent protein (GFP)-labeled U266 cells were cultured in the presence or absence of HS-5 stromal cells and exposed (24 hours) to LCL ± LBH; apoptosis (Annexin V) was then monitored in the GFP population. Cells exposed to LCL/LBH in the presence or absence of HS-5 cells exhibited equivalent degrees of cell death (P > .05) (supplemental Figure 7A). Furthermore, luciferase-labeled U266 cells cocultured with HS-5 cells exhibited significantly diminished viability after LCL/LBH 24-hour exposure (P < .01) (supplemental Figure 7B). In addition, combined treatment potentiated U266/GFP cell death (7-AAD+; red) in a three-dimensional HS-5 coculture model, reflected by a conversion of green to yellow staining (supplemental Figure 7C). Interestingly, both agents individually but particularly in combination induced cell death (7-AAD positivity) in stromal cells (bright-field). Moreover, primary cells cocultured in HS-5 medium displayed a marked increase in Annexin V–staining cells when exposed to LCL/LBH (supplemental Figure 7D). Finally, primary cells cultured in the presence of HS-5 medium displayed, if anything, more cell death in CD138+ cells than cells cultured in the absence of HS-5 (P < .02) (supplemental Figure 7E). Furthermore, CD138–/CD19+/CD20+/CD27+ cells, a population enriched for MM progenitors,27 exhibited an equivalent degree of cell death (P > .05) (supplemental Figure 7F).
To determine whether this strategy is effective in the presence of MM patient-derived bone marrow stroma (PBMDS)-driven resistance, parallel studies were performed. U266/GFP cells exposed to LCL/LBH in the presence of PBMDS cells displayed a marked increase in 7-AAD+ cells (supplemental Figure 8A). Moreover, purified primary CD138+ cells from 3 patients with MM cocultured with PBMDS cells, collagen, and patient serum exhibited synergistic induction17 of cell death when exposed to LCL/LBH (Figure 6; supplemental Table 2) as well as in a series of 6 total primary specimens tested (supplemental Figure 8B). Taken together, these findings indicate that the LCL/LBH regimen is active against cultured and primary MM cells in the presence of stromal cell factors.
![LCL/LBH synergistically circumvents microenvironment-driven resistance. (A) Ex vivo viability analysis of purified CD138+ patient MM cells in the context of patient stroma, collagen, and patient serum over 4 days with LCL161, panobinostat, or the combination (5 concentrations serially diluted threefold from 20 µM [LCL161], 50 nM [panobinostat]). Purple line is MM1.S cell line control at maximum concentration. (B) Quantitation of cell viability by area under the curves (AUC) of all 5 doses. (C) Quantification of synergy at 96 hours by AUC and median lethal dose (LD50). Responses greater than mathematically determined additivity are synergistic; values shown are increased experimental activity compared with expected additive response.18](https://ash.silverchair-cdn.com/ash/content_public/journal/bloodadvances/5/19/10.1182_bloodadvances.2020003597/5/m_advancesadv2020003597f6.png?Expires=1765885226&Signature=BVSWQespHu3o90Cul53dQ1n~2itESUXLoE6dSYQnDmyebj1GJEafrYsYxEs8humvzPDhy5gbz3vxmQ~cePtrCBXT1qNX1gSRv4m44NsVbBaa00HBlgMCyrkeRInkW-WBy13hCO~pPxYCe43Y8gGjq9Pufpc6fgR4HXok0ojW9F5qSqZWOS5FTd1kSJhhHugded7cs4y5VWid1XWaXR7RlnnCi9XH3y4DLi-H90EgJ0TKXoTQPyaiiQHjklpRZN4jZjYRJMT-4aE0AbzwLoew2~Bw66So406pUr~H-jQkju-BDpJYWOWzrkGYdoS8VHybOkWCpxu0f0zTs1pUD1msJQ__&Key-Pair-Id=APKAIE5G5CRDK6RD3PGA)
LCL/LBH synergistically circumvents microenvironment-driven resistance. (A) Ex vivo viability analysis of purified CD138+ patient MM cells in the context of patient stroma, collagen, and patient serum over 4 days with LCL161, panobinostat, or the combination (5 concentrations serially diluted threefold from 20 µM [LCL161], 50 nM [panobinostat]). Purple line is MM1.S cell line control at maximum concentration. (B) Quantitation of cell viability by area under the curves (AUC) of all 5 doses. (C) Quantification of synergy at 96 hours by AUC and median lethal dose (LD50). Responses greater than mathematically determined additivity are synergistic; values shown are increased experimental activity compared with expected additive response.18
LCL/LBH synergistically circumvents microenvironment-driven resistance. (A) Ex vivo viability analysis of purified CD138+ patient MM cells in the context of patient stroma, collagen, and patient serum over 4 days with LCL161, panobinostat, or the combination (5 concentrations serially diluted threefold from 20 µM [LCL161], 50 nM [panobinostat]). Purple line is MM1.S cell line control at maximum concentration. (B) Quantitation of cell viability by area under the curves (AUC) of all 5 doses. (C) Quantification of synergy at 96 hours by AUC and median lethal dose (LD50). Responses greater than mathematically determined additivity are synergistic; values shown are increased experimental activity compared with expected additive response.18
LCL/LBH suppresses tumor growth in a murine myeloma model
The in vivo effects of the regimen were then examined by using C57BL/KalwRij mice bearing luciferase-labeled 5TGM1 MM cells. After tail vein inoculation, mice were treated with LCL ± LBH (30 mg/kg orally or 13.3 mg/kg intraperitoneally, respectively). Tumor growth was monitored by whole body imaging, which revealed a clear reduction in signal at day 19 in mice treated with both LCL and LBH (Figure 7A). Imaging of bone fragments from euthanized mice revealed a marked reduction in lytic lesions in animals treated with both agents (Figure 7B); photon quantitation confirmed a significant reduction in the LCL/LBH group (P < .05 compared with single treatment) (Figure 7C). Kaplan-Meier analysis showed a significant increase in survival for animals treated with both agents compared with single-agent treatment (P < .05) (Figure 7D). Notably, no treatment resulted in significant weight loss (Figure 7E). Finally, a flank model showed a clear reduction in tumor luminescence in NSG mice treated with both agents (supplemental Figure 9A), and western blot analysis of tumors showed downregulation of p52, cIAP1, and cIAP2 and upregulation of γH2A.X in these animals (supplemental Figure 9B). Together, these findings indicate that the LCL/LBH regimen is effective and tolerable in the in vivo setting and accompanied by several molecular events observed in vitro.
![LCL/LBH suppresses tumor growth in a murine myeloma model. Immunocompetent C57BL/KaLwRij mice were inoculated via the tail vein intravenously with 5 × 10⁶ luciferase-labeled 5TGM1 cells. Mice were randomized to 4 groups (n = 7 or 8 per group). Treatment was initiated after luciferase signal was detected. LCL161 (30 mg/kg, 5 days per week) and LBH (13.3 mg/kg, 3 days per week) were given orally or intraperitoneally, respectively. (A) Tumor growth was monitored every other day after intraperitoneal injection with 100 μL of 15 mg/mL D-luciferin substrate using the PerkinElmer IVIS 200 imaging system. (B) Tumor growth was monitored by whole body imaging and dissection imaging. Arrow, bone marrow lesion (luciferase signals); circle, extramedullary lesion; sp, spleen; 1, cranium; 2, spine; 3/4, scapulars; 5/7, upper limbs; 6/8, lower limbs; 9/10, ilium; 11, brain; 12, lung; 13, liver; 14, stomach; 15/16, kidneys). (C) Tumor growth was quantified by average luciferase activity (photons/second/cm2/sr). P < .05 vs each single treatment (log-rank [Mantel-Cox] test). (D) Kaplan-Meier analysis was conducted to analyze survival. Inset, median survival days. Yellow bar indicate time when treatment (Tx) began (day 13) and was discontinued (day 24). P < .05 vs each single treatment. (E) Body weight was measured every other day. Veh, vehicle.](https://ash.silverchair-cdn.com/ash/content_public/journal/bloodadvances/5/19/10.1182_bloodadvances.2020003597/5/m_advancesadv2020003597f7.png?Expires=1765885226&Signature=jpprAqP9p9oAlXpUDfitXN~29~TU9OjJw0CEWap-tONowCHV6ZhMRvcvX6pv2gJN89TtYoG2gGFfpuCddzT3QQJ~BLami1gdAGudX~0ntJ9XXjvS5mmLPkycAsHEOytxGe-FE91FpSOLzLvjiaqxulRqzS4qGv0vURpAFAnV9xaS~-jW0luI48k0LIQuFF6ASqMBZhFgPM4JKaNrOzTcRBfVPD5l5xhGNXACc8KjJmqXs5o6qkQ6iTmwTBDI7fzv4kFXQ2qf08WXJzobBkAuWf7KIz~VR9u2Gb6k9LsBSiK2rRPcNZxWASbANhtdc0lZNzQYRTMogReA-clg5ZvE2g__&Key-Pair-Id=APKAIE5G5CRDK6RD3PGA)
LCL/LBH suppresses tumor growth in a murine myeloma model. Immunocompetent C57BL/KaLwRij mice were inoculated via the tail vein intravenously with 5 × 10⁶ luciferase-labeled 5TGM1 cells. Mice were randomized to 4 groups (n = 7 or 8 per group). Treatment was initiated after luciferase signal was detected. LCL161 (30 mg/kg, 5 days per week) and LBH (13.3 mg/kg, 3 days per week) were given orally or intraperitoneally, respectively. (A) Tumor growth was monitored every other day after intraperitoneal injection with 100 μL of 15 mg/mL D-luciferin substrate using the PerkinElmer IVIS 200 imaging system. (B) Tumor growth was monitored by whole body imaging and dissection imaging. Arrow, bone marrow lesion (luciferase signals); circle, extramedullary lesion; sp, spleen; 1, cranium; 2, spine; 3/4, scapulars; 5/7, upper limbs; 6/8, lower limbs; 9/10, ilium; 11, brain; 12, lung; 13, liver; 14, stomach; 15/16, kidneys). (C) Tumor growth was quantified by average luciferase activity (photons/second/cm2/sr). P < .05 vs each single treatment (log-rank [Mantel-Cox] test). (D) Kaplan-Meier analysis was conducted to analyze survival. Inset, median survival days. Yellow bar indicate time when treatment (Tx) began (day 13) and was discontinued (day 24). P < .05 vs each single treatment. (E) Body weight was measured every other day. Veh, vehicle.
LCL/LBH suppresses tumor growth in a murine myeloma model. Immunocompetent C57BL/KaLwRij mice were inoculated via the tail vein intravenously with 5 × 10⁶ luciferase-labeled 5TGM1 cells. Mice were randomized to 4 groups (n = 7 or 8 per group). Treatment was initiated after luciferase signal was detected. LCL161 (30 mg/kg, 5 days per week) and LBH (13.3 mg/kg, 3 days per week) were given orally or intraperitoneally, respectively. (A) Tumor growth was monitored every other day after intraperitoneal injection with 100 μL of 15 mg/mL D-luciferin substrate using the PerkinElmer IVIS 200 imaging system. (B) Tumor growth was monitored by whole body imaging and dissection imaging. Arrow, bone marrow lesion (luciferase signals); circle, extramedullary lesion; sp, spleen; 1, cranium; 2, spine; 3/4, scapulars; 5/7, upper limbs; 6/8, lower limbs; 9/10, ilium; 11, brain; 12, lung; 13, liver; 14, stomach; 15/16, kidneys). (C) Tumor growth was quantified by average luciferase activity (photons/second/cm2/sr). P < .05 vs each single treatment (log-rank [Mantel-Cox] test). (D) Kaplan-Meier analysis was conducted to analyze survival. Inset, median survival days. Yellow bar indicate time when treatment (Tx) began (day 13) and was discontinued (day 24). P < .05 vs each single treatment. (E) Body weight was measured every other day. Veh, vehicle.
Discussion
SMAC mimetics such as LCL161 and birinapant have attracted attention in light of their ability to disrupt the function of several antiapoptotic proteins (eg, XIAP, survivin), thereby circumventing the block to apoptosis characteristic of neoplastic cells.10 This permits them to lower the threshold for cell death induced by cytotoxic agents such as cisplatin and vinca alkaloids, among others.32,33 In the case of MM, LCL161 has been shown to increase the anti-myeloma activity of cyclophosphamide (NCT01955434) and JAK inhibitors.34 However, aside from their pro-apoptotic actions, IAPs (particularly cIAP1) have been implicated in various signaling pathways, including NF-κB.35 This raises the possibility that SMAC mimetics may interact beneficially with agents whose activity is regulated by NF-κB. In this regard, previous studies have shown that in malignant hematopoietic cells, interruption of NF-κB signaling enhances the lethal actions of HDACIs.36 LBH is a pan-HDACI, which, when combined with dexamethasone and bortezomib, has been approved for the treatment of patients with relapsed/refractory MM.37 These considerations prompted us to investigate whether LCL161 might increase the activity of a clinically relevant HDACI such as LBH. Our results indicate that these agents interact synergistically in MM cells, including those resistant to standard agents as well as primary MM cell specimens.
Contrary to expectations, LCL161 failed to inactivate the canonical NF-κB pathway in HDACI-treated cells, reflected by the absence of downregulation of p-65 (p-RelA), despite the robust downregulation of cIAP1. This finding argues against the possibility that enhanced lethality of the combination stems from interruption of the canonical NF-κB pathway. The basis for this finding is uncertain, given the observation that cIAP1/2 represents a component of a large complex (Complex I) implicated in activation of IKK, which triggers IκBα phosphorylation and degradation, thereby permitting RelA nuclear translocation and DNA binding.38 However, this process may be overcome by the intrinsic ability of HDACIs to activate NF-κB14 and/or the capacity of HDACIs to modulate other components of the complex (eg, A20). Additional studies will be required to resolve this question.
In sharp contrast, the present evidence indicates that the LCL161/LBH regimen resulted in inactivation of the noncanonical NF-κB pathway, reflected by marked downregulation of p52 processing, and that this process contributed to anti-myeloma activity. In this regard, cIAP1/2 antagonists have been referred to as “double-edged swords” with respect to activation of NIK-dependent noncanonical NF-κB signaling,39 as cIAP is known to inhibit NIK, a key component of this pathway.40 Consequently, degradation of cIAP1 might be expected to activate the noncanonical pathway. However, cIAP is also known to downregulate TRAF3, one of whose actions is to inhibit NIK.41 Furthermore, the inhibitory activity of TRAF3 on NIK overrides release from the antagonistic actions of cIAP.40 In line with these concepts, the LCL161/LBH regimen, despite downregulating cIAP, markedly upregulated TRAF3, accompanied by NIK downregulation. The observations that TRAF3 knock-down or ectopic expression of NIK attenuated cell death induced by this regimen argues that noncanonical NF-κB inactivation contributes functionally to lethality. Furthermore, the finding that LCL161/LBH downregulated TRAF2 and BCL-XL, both of which are components of or regulated by the noncanonical pathway,42 and that ectopic expression of these proteins diminished regimen activity support the functional involvement of this cascade in anti-myeloma actions. Moreover, a recent study highlighted the induction of BCL-XL expression by CD40 through canonical as well as noncanonical NF-κB signaling.43
In addition to inactivation of the noncanonical NF-κB, the present findings indicate that activation of the extrinsic apoptotic pathway contributes to the activity of the LCL161/LBH regimen. In this context, previous studies have suggested that activation of the extrinsic pathway (eg, by TRAIL agonists) increases cell death induced by SMAC mimetics in neoplastic cells.44 Moreover, we recently observed that the extrinsic pathway was also involved in synergism between birinapant and the proteasome inhibitor bortezomib.10 In the present studies, combined LBH/LCL161 exposure resulted in a dramatic increase in DR4 levels and caspase-8 cleavage, indicating activation of the extrinsic apoptotic cascade.44-46 Notably, cells expressing dominant-negative caspase-8 or FADD were markedly less sensitive to LBH/LCL161–induced apoptosis, documenting a significant functional contribution of this pathway to cell death. The observation that γH2AX formation and DNA damage were not abrogated by pan-caspase inhibition argues that such events represent a primary event mediating LCL/LBH lethality, and are not simply secondary consequences of cell death. In addition, it has previously been shown that simultaneous activation of the intrinsic and extrinsic apoptotic pathways dramatically increases cell death in neoplastic cells.47 It is therefore possible that LCL161/LBH–induced intrinsic pathway activation (eg, by BCL-XL downregulation) cooperates with extrinsic pathway activation (eg, by caspase-8 cleavage) to trigger MM cell death.
The LCL161/LBH regimen effectively induced cell death in cultured as well as in primary MM cells and overcame resistance conferred by microenvironmental factors (eg, collagen, immortalized stromal cells) as well as MM patient–derived stromal cells and serum. Previous studies have implicated activation of the noncanonical NF-κB pathway in protective effects associated with stromal cells.47,48 It is therefore logical to speculate that the ability of the LCL161/LBH regimen to block noncanonical NF-κB signaling contributed to the failure of stromal cells to block cell death induced by these agents. Of note, although LCL161/LBH induced cell death in primary CD138+ cells as well as more primitive progenitors (CD138–/CD19+/CD20+/CD27+) cocultured with normal or patient-derived stromal cells, identical regimens were relatively nontoxic to normal CD34+ cells. The basis for such selectivity is uncertain but may reflect the preferential toxicity of HDACIs toward neoplastic versus normal cells.49 Analogously, the selective activity of IAP antagonists toward neoplastic vs normal cells may reflect the greater dependency of the former on antiapoptotic proteins.50 Additional studies will be required to address these questions more definitively.
The LCL161/LBH regimen displayed significant in vivo activity in an immunocompetent MM cell model with no substantial evidence of toxicity. Importantly, several of the changes observed in vitro (eg, reductions in p52 processing, cIAP1 downregulation) were recapitulated in vivo, raising the possibility that mechanisms underlying cell death were operative in both settings. Interesting, results of an earlier study suggest that the in vivo activity of LCL161 in a MM model may reflect, at least in part, immunologic factors.8 In this context, studies have suggested that HDACIs may, in addition to their epigenetic actions, perturb antitumor immunosurveillance.51,52 Consequently, the direct effects of LCL161/LBH in promoting MM cell death in vivo may potentially be enhanced by immunologic mechanisms. Studies are currently underway to test this hypothesis.
The results of the present study have potential implications for MM therapy. As noted previously, LBH, when combined with bortezomib/dexamethasone, is approved in relapsed/refractory MM,53 and studies are currently underway designed to optimize this regimen (#NCT02654990). LCL161 has undergone testing in several malignancies (#NCT02890069, #NCT02649673), including MM (#NCT01955434, #NCT03111992),8 and thus far trials have shown this agent to be minimally toxic at plasma concentrations comparable to those used in the present study.11 Based on these considerations, a combination regimen involving LCL161 and LBH warrants further consideration, and efforts to develop this concept are currently underway.
Acknowledgments
This work was supported by the National Institutes of Health, National Cancer Institute (1R01CA205607-01), and an award from the Leukemia and Lymphoma Society of America (R6508-18). Services in support of the research project were provided by the Virginia Commonwealth University Massey Cancer Center Tissue and Data Acquisition and Analysis Core, and Mouse Models Core Laboratory, supported, in part, with funding from a National Institutes of Health, National Cancer Institute, Cancer Center Support Grant (P30 CA016059). In addition, this work was supported in parts by the H. Lee Moffitt Cancer Center Physical Sciences in Oncology Grant 1U54CA193489-01A1, H. Lee Moffitt Cancer Center’s Team Science Grant, Miles for Moffitt Foundation, the Cancer Center Support Grant P30-CA076292 to the Moffitt Cancer Center, and from the Pentecost Family Foundation. Access to primary cells was made possible through the Total Cancer Care Protocol at the Moffitt Cancer Center.
Authorship
Contribution: L.Z., Y.Z., M.B.M., YX.N., XY.H., L.L., K.S., J.N., R.P., J.M., C.P., D.B., P.R.S., R.R.C., M.D.SS., G.D.A., R.R.A., A.S.S., M.K., and A.F.-G. performed experiments and analyzed data; K.S., XY.H., L.L., and L.K. checked the original data; L.Z. and S.G. wrote the manuscript; and L.Z., Y.D., K.H.S., and S.G. conceived and supervised the study.
Conflict-of-interest disclosure: The authors declare no competing financial interests.
Correspondence: Steven Grant, Division of Hematology/Oncology, PO Box 980035, Virginia Commonwealth University, Richmond, VA 23298; e-mail: steven.grant@vcuhealth.org.

