

Key Points
Systemic inflammation is present both before and after HCT in patients with MPS.
Ten years after HCT, bone homeostasis– related markers remain highly elevated in MPS I patients and possibly reflect ongoing skeletal disease.

Abstract
Mucopolysaccharidoses (MPS) are devastating inherited diseases treated with hematopoietic cell transplantation (HCT). However, disease progression, especially skeletal, still occurs in all patients. Secondary inflammation has been hypothesized to be a cause. To investigate whether systemic inflammation is present in untreated patients and to evaluate the effect of HCT on systemic inflammation, dried blood spots (n = 66) of patients with MPS (n = 33) treated with HCT between 2003 and 2019 were included. Time points consisted of pre-HCT and, for patients with MPS type I (MPS I), also at 1, 3, and 10 years of follow-up. Ninety-two markers of the OLINK inflammation panel were measured and compared with those of age-matched control subjects (n = 31) by using principal component analysis and Wilcoxon rank sum tests with correction. Median age at transplantation was 1.3 years (range, 0.2-4.8 years), and median time of pre-HCT sample to transplantation was 0.1 year. Normal leukocyte enzyme activity levels were achieved in 93% of patients post-HCT. Pretransplant samples showed clear separation of patients and control subjects. Markers that differentiated pre-HCT between control subjects and patients were mainly pro-inflammatory (50%) or related to bone homeostasis and extracellular matrix degradation (33%). After 10 years’ follow-up, only 5 markers (receptor activator of nuclear factor kappa-Β ligand, osteoprotegerin, axis inhibition protein 1 [AXIN1], stem cell factor, and Fms-related tyrosine kinase 3 ligand) remained significantly increased, with a large fold change difference between patients with MPS I and control subjects. In conclusion, systemic inflammation is present in untreated MPS patients and is reduced upon treatment with HCT. Markers related to bone homeostasis remain elevated up to 10 years after HCT and possibly reflect the ongoing skeletal disease, making them potential biomarkers for the evaluation of new therapies.
Introduction
Mucopolysaccharidoses (MPS) are a group of diseases caused by genetic defects in the production of lysosomal enzymes that degrade glycosaminoglycans (GAGs).1 Without treatment, the consequences of these devastating multisystemic disorders often result in premature death. Allogeneic hematopoietic cell transplantation (HCT) has been shown to be a treatment option for a selected group of patients with MPS. Intense international collaboration has resulted in strongly improved 5-year survival rates, which now exceed 90% in well-matched patients in large experienced centers and have positively changed long-term perspectives.2,3
Although HCT is a successful treatment in terms of long-term survival, the magnitude of residual disease is increasingly recognized.4-6 The residual disease burden is multifaceted, often involving several organ systems, including the skeleton, ligaments, eyes, and heart valves. Known important predictors of the effect of HCT on long-term outcomes are achievement of normal leukocyte enzyme activity levels after HCT and early timing of therapy.4 At present, except for the leukocyte enzyme activity level achieved after HCT, no biochemical markers are known to predict the long-term outcome. Currently, improved treatment protocols have resulted in normal leukocyte enzyme activity levels in the majority of patients, and newborn screening programs to detect patients at an early age are evolving. Patients, however, despite undergoing transplant at an early age and the achievement of normal post-HCT leukocyte enzyme activity levels, still develop residual disease that has been shown to progress over time.4-7 This has led to the development of new therapies, such as autologous gene–transduced cell transplantation aiming for supra-physiological hematologic enzyme activity levels to achieve higher penetrance in tissues; clinical trials for these therapies are now open for patients with MPS type I (MPS I) and MPS type III, and other trials are likely to open in the near future. However, biochemical markers, which reflect residual disease and can potentially predict whether new therapies are better in treating all facets of the disease, are lacking.
Interest in the involvement of the immune system in the pathology of MPS has grown in recent years. Several studies, both in mice and human, have shown that the immune system in patients with MPS is in a pro-inflammatory state.8-11 Because inflammation is a secondary manifestation of the original disease, we hypothesized that systemic inflammation markers could be potential biomarkers for the evaluation of new therapies that aim to improve the long-term clinical outcomes of patients with MPS. With the aim to provide a signature of long-term residual disease that reflects the weak spots of current HCT treatment, we investigated whether systemic inflammation is present in untreated patients and to what extent the inflammation is ongoing after HCT.
Methods
Study participants
All patients with MPS treated with HCT in the Wilhelmina Children’s Hospital of the University Medical Centre Utrecht (Utrecht, The Netherlands) between 2003 and 2019 were included in the current study. All patients gave informed consent before joining the study, and approval from the responsible institutional committee (Medical Research Involving Human Subjects from the University Medical Center Utrecht, Utrecht University) was acquired. The MPS phenotype, date of birth, date of sample collection, age at transplantation, leukocyte enzyme activity level before and after transplantation (scored as below or above lower limit of normal; cutoff point, 20 nmol/h per milligram), and use of medication were collected from the medical records. As control subjects, stable phenylketonuria patients underwent collection of dried blood spots (DBS) in the following age ranges: 0 to 1 year, 1 to 3 years, 3 to 6 years, 6 to 12 years, and >12 years.
Sample preparation of DBS
DBS of all patients with MPS were collected at baseline (pre-HCT), and for patients with MPS I also at 1 year, 3 years, and 10 years after HCT. Samples of patients with graft-versus-host disease who were being treated with corticosteroids or immunosuppressive drugs at time of collection were excluded from analyses. DBS were prepared by dispensing whole blood collected by vena puncture in a heparin tube or directly from a finger prick onto Guthrie cards. DBS were subsequently dried for at least 4 hours at room temperature and stored at −80°C in a plastic bag with silica gel bags until analysis. No differences in markers were seen in DBS prepared from the heparin tubes compared with DBS prepared from a direct finger prick (data not shown).
OLINK multiplex assay
DBS were analyzed with the OLINK Proseek Multiplex Inflammation assay at the University Medical Center Utrecht; this assay is based on proximity extension assay technology with oligonucleotide-labeled antibody probe pairs that bind to their respective targets.12,13 From the DBS, 1.2-mm punches were obtained, and 1 µL sample diluent was added to the punches to compensate for volume. Hereafter, the process was performed following the manufacturer’s manual. In short, proximity extension assay technology makes use of antibody pairs direct to specific proteins. Upon binding of antibody pairs to their respective targets, DNA reporter molecules bound to the antibodies give rise to new DNA amplicons with each ID-barcoding their respective antigens. The amplicons were subsequently quantified by using a BioMark HD Real-Time PCR Platform (Fluidigm, South San Francisco, CA). The raw quantification cycle values were normalized and converted into normalized protein expression (NPX) units. The NPX values were expressed on a log2 scale in which one unit higher in NPX values represents a doubling of the measured protein concentration. Quality control of the measured samples was performed by using the standard quality control protocol of OLINK. The simultaneously measured 92 proteins are listed in supplemental File 1. The assay was performed at the same time for all patients and control subjects.
Statistical analysis
Baseline characteristics are reported as frequencies and percentages for categorical variables and median (range) for continuous variables. Two distinct data sets were obtained, one for patients with paired DBS and one for patients with one DBS and DBS collected from control subjects. Before analysis, the data sets were merged, and the total data set was corrected for batch effects by using R package SVA,14 function ComBat.15 To test whether inflammation was present in patients with MPS at one specific time point compared with age-matched control subjects, a principal component analysis (PCA) was performed. Furthermore, DBS analyte NPX levels between the patients and control subjects were compared by using a Wilcoxon rank sum test followed by a Benjamini-Hochberg correction for multiple comparisons. Finally, using the linearized NPX values, the fold change of each marker was compared between patients and control subjects. To visualize the fold change values in a volcano plot, the fold change values were transformed to log2 fold change (data not shown). Markers that showed a log2 fold change >1.5, which correlates with a fold change >2.7, and that were significant according to the Wilcoxon rank sum test after Benjamini-Hochberg correction were considered relevant in the comparison between patients and control subjects. Heatmap clustering was based on Ward’s method and pairwise correlation distance.
To study the changes of markers over time, we used linear mixed effects models, including a fixed effect for time. For these analyses, only patient data were included, because longitudinal data of control subjects were not available. Linear mixed effects models were fitted on the NPX values of each marker as dependent variables. Initially, random intercept and random slope (for time) were included in the model to take into account interindividual variations. Models that were not able to converge were subsequently fitted with a fixed effect for time in combination with random intercept and no random effect for the slope (time). The parameter’s inference was done with a restricted maximum likelihood approach. The model assumptions, including normal distributed residuals, random effects, and homogeneity of variance, were confirmed visually. The P values for the fixed effect for time were extracted from the models and corrected with Benjamini-Hochberg correction for multiple comparisons. Adjusted P values <.05 were considered significant. The R project (RStudio: Integrated Development for R. RStudio, Inc., Boston, MA) for statistical computing version 3.4.1 with the packages “lme4” and “ggplot2” was used for all analyses and for the creation of figures.
Results
Patient characteristics
In total, 97 samples from both patients and control subjects were included in the analyses. Of these, 66 samples originated from 33 patients. Patient characteristics are shown in Table 1. The majority of patients were diagnosed with MPS I (MPS I, Hurler, n = 24; MPS I, Hurler/Scheie, n = 2). Two patients were diagnosed with MPS type II (MPS II), two with MPS type IV, and three with MPS type VI (MPS VI). Pre-HCT samples were available from 22 patients. The median age at pre-HCT sample collection (ie, untreated patients) was 1.1 years (range, 0.1-4.7 years). Thirty-nine follow-up samples were available from 26 patients with MPS I. The median age at transplantation was 1.3 years (range, 0.2-4.8 years). All but 2 patients (7%) had enzyme activity levels in the normal range post-HCT. At the 1-year follow-up, 14 samples were available; at the 3-year follow-up, 15 samples; and at the 10-year follow-up, 10 samples. The remaining 31 samples originated from 31 control subjects with a median age of 9 years (range, 0-29 years). For control subjects, 3 samples were available in the age range of 0 to 1 year, 6 samples in the range of 1 to 3 years, 4 samples in the range of 3 to 6 years, 8 samples in the range of 6 to 12 years, and, finally, 10 samples were collected from control subjects aged ≥12 years.
Patient characteristics (N = 30) and number of samples of DBS
| Characteristic | Value | |||
|---|---|---|---|---|
| Male sex | 21 (70%) | |||
| Age at pre-HCT collection, median (range), y | 1.1 (0.1-4.7) | |||
| Age at transplantation, median (range), y | 1.3 (0.2-4.8) | |||
| Enzyme activity level post-HCT in normal range | 28 (93%) | |||
| MPS type | DBS (n) | |||
| Pre | 1-year FU | 3-year FU | 10-year FU | |
| MPS | 22 | 14 | 15 | 10 |
| MPS 1 | 16 | 14 | 15 | 10 |
| MPS 2 | 2 | |||
| MPS type 3 | 2 | |||
| MPS 6 | 2 | |||
FU, follow-up.
Inflammation in untreated patients with MPS
First, the inflammation status in pre-HCT patients (n = 22) compared with age-matched control subjects was explored. Supervised analysis resulted in a list of 64 significant markers after correction for multiple testing. When combining significance and log2 fold change >1.5, the list was reduced to 37 markers (data not shown). Unsupervised PCA revealed a clear separation of pre-HCT patients with MPS vs age-matched control subjects. The first component described a large percentage of variation in the data, with a remarkable 52% (Figure 1A-B). Separate clusters of the different MPS subtypes were not observed (Figure 1A). A nearly perfect separation between patients and control subjects was also observed when the data were visualized in a heatmap based on hierarchical clustering for both samples and cytokines (supplemental File 2).
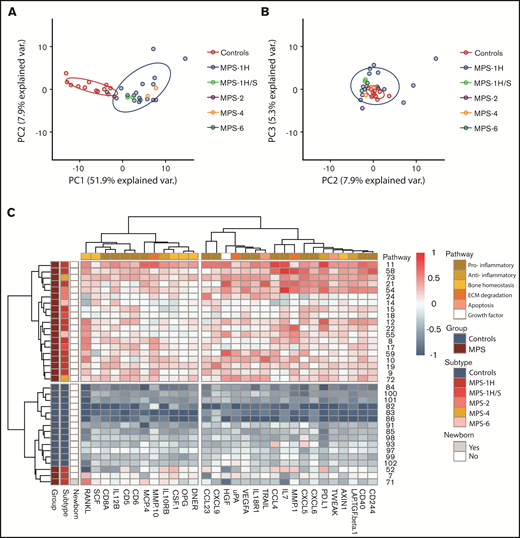
PCA and heatmap of inflammation markers in untreated patients with MPS vs control subjects. (A) Principal component 1 (PC1) vs principal component 2 (PC2) shows clear separation of control subjects (blue) and patients with MPS (n = 22). (B) PC2 vs principal component 3 (PC3). (C) Heatmap of inflammation markers both present in PC1 of PCA and list of significant and >1.5-log2 fold change supervised analysis. On the left, color coding is shown for group (control subjects vs MPS), subtypes (of the different MPS), and whether the patient was a newborn. The color coding on top indicates to which pathway the different markers belong. ECM, extracellular matrix.
PCA and heatmap of inflammation markers in untreated patients with MPS vs control subjects. (A) Principal component 1 (PC1) vs principal component 2 (PC2) shows clear separation of control subjects (blue) and patients with MPS (n = 22). (B) PC2 vs principal component 3 (PC3). (C) Heatmap of inflammation markers both present in PC1 of PCA and list of significant and >1.5-log2 fold change supervised analysis. On the left, color coding is shown for group (control subjects vs MPS), subtypes (of the different MPS), and whether the patient was a newborn. The color coding on top indicates to which pathway the different markers belong. ECM, extracellular matrix.
Markers that were both present in the list of 37 differentiating markers and in the top 40 markers of the first component of the unsupervised PCA were selected for further analysis and are shown in Table 2 and Figure 1C (n = 30). A significant number of markers (n = 15 [50%]) were associated with a pro-inflammatory immune status. Interestingly, 10 markers were associated with bone homeostasis (n = 6 [20%]) and extracellular matrix (ECM) degradation (n = 4 [13%]). The other markers were associated with an anti-inflammatory status (n = 3 [10%]), apoptosis (n = 1 [3%]), or were growth factors (n = 1 [3%]).
Selection of 30 differentiating inflammation markers in untreated patients with MPS vs control subjects
| Marker | Eponym | Pathway | Function |
|---|---|---|---|
| CD5 | Pro-inflammatory | Expressed on surface of T cells | |
| CD6 | Pro-inflammatory | Expressed on surface of T cells | |
| CD8A | Pro-inflammatory | T-cell surface glycoprotein, coreceptor | |
| CD40 | Pro-inflammatory | Costimulatory protein on APCs | |
| CD244 | NK-cell receptor 2B4 | Pro-inflammatory | Cell surface receptor of NK cells (and T cells) |
| CCL4 | MIP-1β | Pro-inflammatory | Chemoattractant for NK cells and monocytes, produced by neutrophils, monocytes, T cells, B cells, fibroblasts, endothelial, and epithelial cells. Increased with age |
| CCL23 | MIP-3 | Pro-inflammatory | Chemotactic for resting T cells and monocytes |
| CXCL5 | ENA78 | Pro-inflammatory | Produced following stimulation of cells with IL-1 or TNF-α, chemotactic for neutrophils |
| CXCL 6 | GCP-2 | Pro-inflammatory | Chemoattractant for neutrophils |
| CXCL9 | MIG | Pro-inflammatory | Induces chemotaxis of CTLs, NKs, and macrophages; promotes differentiation and multiplication of leukocytes. Also causes tissue extravasation |
| IL7 | Pro-inflammatory | HGF secreted by stromal cells in BM and thymus. Also produced by keratinocytes, DCs, hepatocytes, neurons, and epithelial cells; not produced by lymphocytes. Stimulates differentiation of HSCs to myeloid progenitor cells and proliferation of all cells in lymphoid lineage (B/T/NK) | |
| IL.12B | Pro-inflammatory | Expressed by activated macrophages; acts on T and NK cells; important for sustaining sufficient number of memory/effector T helper 1 cells | |
| IL.18R1 | Pro-inflammatory | Binds IL-18; induced by IFN-α and IL-12 in NK and T cells | |
| MCP.4 | CCl13 | Pro-inflammatory | Induces chemotaxis in monocytes, eosinophils, T cells, basophils. Induced by IL-1 and TNF-α |
| VEGFA | Pro-inflammatory | Found prominently on endothelial cell membrane; also stimulates monocyte migration and increases microvascular permeability upon binding to its receptors (VEGFR1 and VEGFR2) and to heparan sulfate and heparin | |
| IL.10RB | Anti-inflammatory | Together with IL-10RA required for IL-10–induced signal transduction | |
| LAP.TGF.β.1 | Anti-inflammatory | Part of complex with latent TGF-binding protein and TGF-β. Cleaved by MMP-9 and MMP-2, TGF-β induces development of regulatory T cells, has an inhibitory effect on B-cell proliferation, stimulates resting monocytes, and inhibits activated macrophages | |
| PD.L1 | CD274 | Anti-inflammatory | Interacts with CXCL9, suppresses adaptive arm of immune system, reduces apoptosis in regulatory T cells. Expressed on T cells, NK cells, macrophages, myeloid DCs, B cells, epithelial cells, and vascular endothelial cells upon IFN-γ stimulation |
| RANKL | TRANCE/ TNFSF11 | Bone homeostasis | Receptor activator of NF-κB ligand. Osteoclastic activity is triggered via the osteoblasts’ surface-bound RANKL activating the osteoclasts’ surface-bound RANK |
| OPG | TNFRSF11B | Bone homeostasis | Osteoclastogenesis inhibitory factor and decoy receptor for RANKL. Also binds to TRAIL and inhibits TRAIL-induced apoptosis. GAGs also are ligands for OPG. Expressed on osteoblast lineage cells. Expression is highly regulated by estrogens. Upregulation of OPG suppresses osteoclastogenesis and bone resorption. Wnt and TGF-β are OPG-inducing cytokines |
| AXIN1 | Bone homeostasis | Negative regulator of the Wnt pathway and can induce apoptosis | |
| SCF | KIT-ligand | Growth factor/ bone homeostasis | Cytokine that binds to c-KIT receptor (CD117) and is important in the regulation of HSCs in the stem cell niche in the BM. It contributes to the self-renewal and maintenance of HSCs. Stromal cell surrounding HSCs release SCF. HSCs become less sensitive to SCF in adulthood |
| CSF.1 | Growth factor/bone homeostasis | Hematopoietic growth factor, differentiates HSCs into macrophages, drives proliferation of a pro-inflammatory macrophage phenotype in acute kidney injury. Also released by osteoblasts, binds on osteoclasts inducing differentiation | |
| DNER | Growth factor/ bone homeostasis | Δ/Notch-like epidermal growth factor-related receptor is an activator of the NOTCH1 pathway | |
| TRAIL | TNFSF10 | Apoptosis/bone homeostasis | Produced by most normal tissue cells and induces caspase-8–dependent apoptosis after binding to death receptors DR4 and DR5. Also ligand for DcDR1 (TRAIL-neutralizing decoy-receptor), DcDR2 (activates NF-κB pathway), and OPG. TRAIL induces osteoclastogenesis by binding to specific TRAIL receptors on osteoclast precursor cell surfaces |
| TWEAK | TNFSF12 | Apoptosis | Ligand for TWEAKR receptor and can induce apoptosis via multiple pathways. Produced mainly by leukocytes, including monocytes, DCs, and NK cells |
| MMP.1 | ECM degradation | MMP enzyme in ECM remodeling; targets collagen types I, II, and III. HGF activates MMP-1 activity via the Etsy transcription family | |
| MMP.10 | ECM degradation | MMP enzyme in ECM remodeling, targets among others proteoglycans, cleaves precursor of MMP.1 | |
| uPA | ECM degradation | uPA, primary substrate is plasminogen (precursor of plasmin). Activation of plasmin can trigger a proteolytic cascade that participates in thrombolysis or extracellular matrix degradation. uPA also can cleave pro-HGF. Ligand for uPAR, expressed by both osteoblasts and osteoclasts | |
| HGF | SF | ECM degradation/ growth factor | Paracrine cellular growth, motility, and morphogenic factor secreted by mesenchymal cells as pro-HGF which is among others activated by uPA. Primarily targets epithelial and endothelial cells but also hemopoietic progenitor cells and T cells. HGF upregulates the expression of IL-11 from osteoclast-like cells and inhibits osteoblast differentiation. HGF increases production of MMP-1 and uPA. Has an antifibrotic effect in various organs |
Markers that were present in both the list of markers that were significantly different and had a log2 fold change >1.5 in the supervised analysis and the top 40 markers within the first principal component of PCA. Markers are categorized based on their relation to MPS pathology. APCs, antigen presenting cells; AXIN1, axis inhibition protein 1; BM, bone marrow; CCL, C-C motif chemokine ligand; CD, cluster of differentiation; CSF, colony-stimulating factor; CTLs, cytotoxic T lymphocytes; CXCL, C-C-C motif chemokine ligand; DcDR, decoy death receptor; DCs, dendritic cells; DNER, delta/notch-like epidermal growth factor-related receptor; DR, death receptor; ECM, extracellular matrix; ENA, epithelial-derived neutrophil-activating peptide; GAG, glycosaminoglycan; GCP-2, granulocyte chemotactic protein 2; HGF, hepatocyte growth factor; HSCs, hematopoietic stem cells; IFN, interferon; IL-1, interleukin 1; LAP.TGF.b.1, latency-associated peptide and transforming growth factor beta-1; MCP, monocyte chemoattractant protein; MIG, monokine induced by gamma interferon; MIP, macrophage inflammatory protein; MMP-9, matrix metalloproteinase-9; NK cell, natural killer cell; OPG, osteoprotegerin; PD.L1, programmed death ligand 1; RANK, receptor activator of nuclear factor kappa-B; RANKL, receptor activator of nuclear factor kappa-B ligand; SCF, stem cell factor; SF, scatter factor; TGF-β, transforming growth factor β; TNFSF, tumor necrosis factor superfamily; TRAIL, tumor necrosis factor related apoptosis-inducing ligand; TRANCE, TNF-related activation-induced cytokine; TWEAK, tumor necrosis factor weak inducer of apoptosis; TWEAKR, tumor necrosis factor weak inducer of apoptosis receptor; uPA urokinase-type plasminogen activator; uPAR, urokinase-type plasminogen activator receptor. VEGFA, vascular endothelial growth factor AVEGFR, vascular endothelial growth factor receptor.
Inflammation in MPS I patients treated with HCT
To assess the effect of HCT on the inflammation status of patients with MPS I, the longitudinal data of these patients were analyzed. Of the 92 measured markers, 15 markers changed significantly over 10 years’ time (Table 3). All markers that significantly decreased (n = 13) were pro-inflammatory markers. Two markers (Fms-related tyrosine kinase 3 ligand [Flt3L] and stem cell factor [SCF]) significantly increased over 10 years and are growth factors related to bone homeostasis.
Markers with significant change over time (n = 15) in HCT-treated patients with MPS I
| Marker | Slope* | P | Pathway | Differentiating pre-HCT |
|---|---|---|---|---|
| CXCL9 | −0.09 | .049 | Pro-inflammatory | Yes |
| CXCL10 | −0.12 | .04 | Pro-inflammatory | No |
| CCL3 | −0.13 | .01 | Pro-inflammatory | No |
| CCL4 | −0.10 | .02 | Pro-inflammatory | Yes |
| CCL19 | −0.09 | .03 | Pro-inflammatory | No |
| CCL20 | −0.09 | .04 | Pro-inflammatory | No |
| CCL25 | −0.08 | .02 | Pro-inflammatory | No |
| MCP.3 | −0.07 | .03 | Pro-inflammatory | No |
| IFN.γ | −0.12 | .04 | Pro-inflammatory | No |
| TNF | −0.07 | .009 | Pro-inflammatory | No |
| TNFB | −0.06 | .04 | Pro-inflammatory | No |
| TNFRSF9 | −0.08 | .009 | Pro-inflammatory | No |
| CDCP1 | −0.06 | .04 | Pro-inflammatory | No |
| Flt3L | 0.1 | .03 | Growth factor/bone homeostasis | No |
| SCF | 0.1 | .03 | Growth factor/bone homeostasis | Yes |
CCL, C-C motif chemokine ligand; CXCL, C-C-C motif chemokine ligand; IFN, interferon; MCP, monocyte chemoattractant protein; SCF, stem cell factor; TNF-a, tumor necrosis factor alpha; TNFRSF, tumor necrosis factor receptor superfamily
The slope of the linear mixed model indicates the change in NPX unit per year.
Because no longitudinal data of control subjects were available, cross-sectional data were used. Only 1 marker (CCL28) was found to be statistically different between the predefined age groups (0-1 year, 1-3 years, 3-6 years, 6-12 years, and >12 years). However, although not statistically significant in the different age groups, the majority of markers did exhibit a trend to increase over time in control subjects (supplemental File 3). Therefore, patient samples of the different follow-up time points were also compared in a cross-sectional manner with age-matched control subjects. At 3 years’ post-HCT, all markers that were pre-HCT differentiators were still present in both the list of markers that were significant with a log2 fold change >1.5 between patients and control subjects and the top 40 markers of the first component of the PCA. At 10 years’ follow-up, when assessing significant differences between patients and control subjects only and thus without taking the fold change into account, 30 markers were still different between patients and age-matched control subjects (Table 4). All of these were also significantly different pre-HCT. However, only 5 markers (receptor activator of nuclear factor kappa-Β ligand [RANKL], osteoprotegerin [OPG], AXIN1, SCF, and Flt3L), related to bone homeostasis, remained elevated, with a >1.5-log2 fold change difference (Figure 2).

Differentiating markers with log2 fold change >1.5 at 10 years’ follow-up. Longitudinal data of patients with MPS I are shown in red; cross-sectional data of control subjects are shown in blue. Average line is estimated by a linear mixed model for longitudinal patient data and shown with a “Loess” curve for control subjects. The shaded area reflects the 95% confidence intervals. X-axes show follow-up (in years) for patients and age (in years) for control subjects. Median age at transplantation was 1.3 years (range, 0.2-4.8 years).
Differentiating markers with log2 fold change >1.5 at 10 years’ follow-up. Longitudinal data of patients with MPS I are shown in red; cross-sectional data of control subjects are shown in blue. Average line is estimated by a linear mixed model for longitudinal patient data and shown with a “Loess” curve for control subjects. The shaded area reflects the 95% confidence intervals. X-axes show follow-up (in years) for patients and age (in years) for control subjects. Median age at transplantation was 1.3 years (range, 0.2-4.8 years).
Markers significantly different between patients with MPS I and age-matched control subjects at 10 years’ follow-up (n = 29)
| Marker | Adjusted P | Fold change | Pathway |
|---|---|---|---|
| CCL19 | .04 | 1.4 | Pro-inflammatory |
| CCL20 | .01 | 1.6 | Pro-inflammatory |
| CD244 | .004 | 2.2 | Pro-inflammatory |
| CD40 | .01 | 1.8 | Pro-inflammatory |
| CD5 | .006 | 2.1 | Pro-inflammatory |
| CD6 | .002 | 2.6 | Pro-inflammatory |
| CD8A | .004 | 2.5 | Pro-inflammatory |
| CDCP1 | .02 | 1.3 | Pro-inflammatory |
| CX3CL1 | .01 | 1.7 | Pro-inflammatory |
| CXCL5 | .004 | 2.3 | Pro-inflammatory |
| IL.12B | .003 | 2.2 | Pro-inflammatory |
| IL.18R1 | .03 | 1.7 | Pro-inflammatory |
| IL7 | .001 | 2.0 | Pro-inflammatory |
| MCP.2 | .02 | 1.6 | Pro-inflammatory |
| MCP.4 | .008 | 1.7 | Pro-inflammatory |
| TNFB | .05 | 1.4 | Pro-inflammatory |
| LAP.TGF.β.1 | .03 | 1.6 | Anti-inflammatory |
| IL.10RB | .01 | 1.7 | Anti-inflammatory |
| RANKL | .001 | 2.7 | Bone homeostasis |
| OPG | .001 | 2.8 | Bone homeostasis |
| AXIN1 | .002 | 3.2 | Bone homeostasis |
| SCF | .0005 | 3.5 | Growth factor/bone homeostasis |
| Flt3L | .0002 | 2.8 | Growth factor/bone homeostasis |
| CSF.1 | .004 | 2.2 | Growth factor/bone homeostasis |
| DNER | .001 | 2.5 | Growth factor/bone homeostasis |
| LIF.R | .006 | 1.5 | Growth factor |
| TRAIL | .03 | 1.8 | Apoptosis/bone homeostasis |
| TWEAK | .001 | 2.3 | Apoptosis |
| MMP.10 | .01 | 1.9 | ECM degradation |
ECM, extracellular matrix.
The markers that were both significant and included a log2 fold change >1.5 are highlighted in bold.
Discussion
To the best of our knowledge, this study is the first to describe the course of systemic inflammation in patients with MPS I undergoing transplant with up to 10 years of follow-up. Before transplantation, a clear increase in a large profile of mainly pro-inflammatory biomarkers was observed in patients with MPS compared with control subjects. Early after transplantation (up to 3 years), inflammation was still present in patients with MPS I compared with the age-matched control subjects. However, after 10 years of follow-up, most of the inflammatory markers had decreased. Five markers (RANKL, OPG, AXIN1, Flt3L, and SCF), which are associated with bone homeostasis, remained significantly increased in combination with a log2 fold change >1.5 compared with control subjects, suggesting they may serve as biomarkers for (skeletal) residual disease.
The pro-inflammatory profile seen before transplantation is in line with previous research.8–11,16 GAGs are direct inducers of the Toll-like receptor-4 pathway, resulting in the production of pro-inflammatory cytokines, including tumor necrosis factor-α (TNF-α).17 Simonaro et al18 have shown the importance of the Toll-like receptor-4 pathway in the pathogenesis of cartilage and bone disease in MPS, and a pilot study with anti–TNF-α in patients with MPS resulted in lower pain scores.19 However, anti–TNF-α treatment comes with disadvantages and side effects. Therefore, less toxic anti-inflammatory agents have been investigated. One example is pentosan polysulfate (PPS), which is a semi-synthetic sulfated polysaccharide polymer with anticoagulant, prochondral, and anti-inflammatory properties. In MPS animal models, PPS reportedly reduced GAG concentrations and improved cartilaginous and osseous pathology.20 A phase 1/2 clinical trial in adult patients with MPS I with the less severe phenotypes (Scheie and Hurler-Scheie) receiving enzyme replacement therapy showed further reduction in urine GAG concentrations and improved range of motion after 24 weeks of PPS treatment.21 Similarly, beneficial effects were observed in patients with MPS II.22
Interestingly, one patient (ID 71) was a newborn and had relatively little inflammation. Nevertheless, RANKL, an important cytokine in bone homeostasis, already showed a clear increase in concentration at birth compared with those in age-matched control subjects. Patients who were sampled at the age of 2 months already exhibited a pro-inflammatory profile. It would be interesting to evaluate whether other newborns with MPS also exhibit little inflammation at birth. PPS treatment starting at diagnosis in patients detected via newborn screening programs might be able to diminish inflammation-related damage in cartilage and may improve outcomes after HCT. Whether patients undergoing transplant also experience a beneficial effect of PPS treatment on skeletal and joint disease remains to be evaluated.
At 10 years’ follow-up, the majority of inflammatory markers decreased; however, many were still significantly different from those of age-matched control subjects. It should be noted that because this study only provides information about systemic presence of these markers, local inflammation could still be occurring, and this topic warrants further investigation. Although systemic inflammatory markers decrease over time after transplantation in MPS I, bone homeostasis markers, including RANKL, remain highly elevated. Therefore, increased RANKL secretion induced by pro-inflammatory cytokines is unlikely to be the only mechanism occurring in patients with MPS I.
Bone homeostasis is tightly regulated and is a conjunction of mature osteoblasts creating bone and activated osteoclasts resorbing bone.23 Osteoblasts are generated from mesenchymal stem cells (MSCs). MSCs initially differentiate into immature osteoblasts, followed by differentiation into mature osteoblasts.24 Cocultures of patient-derived GAGs (eg, MPS I, MPS II, MPS VI) collected from urine with osteogenic MSCs showed an inhibiting effect on the differentiation of immature osteoblasts to mature osteoblasts, resulting in decreased mineral production; this was most profound when osteoblasts were cultured with GAGs derived from patients with MPS VI.25 During the differentiation of osteoblasts, Wnt signaling is a key pathway.26 Wnt3a (canonical) is mainly responsible for stem cell and osteoblast proliferation, whereas Wnt5a (noncanonical) is responsible for stem cell and osteoblast differentiation and thus mineralization. Heparan sulfate–binding sites have been found on most canonical Wnts.27,28 When osteoblasts are cultured with GAGs derived from MPS I, MPS II, and MPS VI, an increase in Wnt3a/canonical signaling occurs, thereby limiting mineralization.25 This might be a cause of the increased levels we observed in AXIN1, as this protein is a key component of the canonical Wnt pathway where it is, in complex with glycogen synthase kinase-3β and adenomatous polyposis coli, bound to β-catenin when the canonical Wnt pathway is in an inactivated state.26
The most important pathway in bone homeostasis is the RANKL/RANK/OPG pathway.29 RANKL, RANK, and OPG are key partners of a system that directly regulates osteoclast differentiation. RANKL, expressed on osteoblasts, binds to RANK present on osteoclast precursors, inducing their differentiation into osteoclasts and stimulating osteoclastogenesis. OPG is a decoy receptor for RANKL that neutralizes RANKL by preventing it to bind to RANK, resulting in decreased osteoclast recruitment. Previous studies have elucidated increased osteoclastogenesis in both animals and patients with MPS I.17,30 MPS I osteoblasts produced increased amounts of RANKL and displayed increased amounts of osteoclasts in vitro. Studies have shown that immature osteoblasts have higher RANKL expression compared with mature osteoblasts,31 which could be the reason for higher RANKL expression in patients with MPS as GAGs inhibit the differentiation of immature to mature osteoblasts.25 Interestingly, in intervertebral discs, cells have been shown to upregulate catabolic factors, including pro-inflammatory cytokines and matrix-degrading enzymes, in the presence of both RANKL and pro-inflammatory stimuli.32 Furthermore, GAGs can bind directly to OPG and further increase osteoclastogenesis,33 resulting in combination with decreased mineralization in the typical skeletal features of patients with MPS, known as dysostosis multiplex.
The increase in RANKL might have treatment implications. Denosumab, a monoclonal human antibody, binds and neutralizes the activity of RANKL and might thus be an interesting drug for the treatment of skeletal disease in patients with MPS. Currently, the drug is approved by the US Food and Drug Administration for postmenopausal osteoporosis and for patients with high risk of bone fractures. Recently, results have been published of a phase 3 clinical trial on joint destruction in patients with rheumatoid arthritis treated with denosumab.34 Denosumab significantly inhibited the progression of joint destruction and led to an increase in bone mineral density but did not affect the joint space narrowing or disease activity scores in patients with rheumatoid arthritis. The effect of denosumab in MPS has not yet been studied.
In addition to elevated levels of RANKL, OPG, and AXIN1, increased levels of the growth factors Flt3L and SCF were observed. Increased osteoclastogenesis could be the reason for this elevation as osteoclasts are of hematopoietic origin and HSCs give rise to myeloid progenitors upon stimulation with, among others, SCF.35 Granulocyte-macrophage colony-stimulating factor promotes further differentiation of myeloid progenitors in macrophage progenitors. Finally, macrophage colony-stimulating factor (M-CSF) further differentiates cells into the monocyte/macrophage lineage, which are considered osteoclast precursors. Our data show that M-CSF (CSF.1) was indeed increased in patients with MPS before HCT. After 10 years of follow-up, M-CSF was still significantly different between control subjects and patients, although no longer with a large fold change difference. Flt3L, conversely, did continue to differ greatly between patients and control subjects. Studies have shown that Flt3L can be a substitute for M-CSF36 and might, in patients with MPS I, contribute to the differentiation of osteoclasts in a non–CSF-dependent matter.
The current study has several limitations. First, our control subjects were patients with phenylketonuria and therefore not “real” healthy control subjects. However, the patients with phenylketonuria were on a strict diet and showed no symptoms of disease. Because it is difficult to collect DBS from healthy children of all ages, these patients were chosen to be the best “healthy” control available. The observation that all patients with MPS could be separated from control subjects and the control subjects did not show inflammation profiles indicates that these second-best control subjects were sufficient. However, in the longitudinal analyses, a post-HCT control group would be of interest to determine what changes occur due to the transplantation. A second limitation was that only cross-sectional data were available for the control group. As a consequence, we could not include control data in the mixed effects model analyses. We observed that many markers increase over age, and a validation of this finding is needed by collecting longitudinal data of control subjects. Finally, because MPS are rare disorders, we were unfortunately unable to validate our current findings in a new cohort of patients. Future research on biomarkers, inflammation, and the effect of new therapies on among others skeletal disease (bone deformities, hip dysplasia, thoracolumbal kyphosis) in MPS should take RANKL, OPG, AXIN1, Flt3L, and SCF into account to validate our results.
Finally, most biomarker research has been conducted in plasma or serum samples. DBS, on the other hand, are easy to collect (ie, sampling can be done from home and sent to the laboratory by mail) and have shown higher stability of markers over time compared with plasma samples.37 However, markers found in samples of DBS can differ from plasma markers. In contrast to plasma, additional markers that are present intracellularly or on the surface of cells are measured when using DBS. Future studies comparing biomarkers should therefore take the origin of the sample into account.
In conclusion, we are the first to show the long-term effect of HCT on systemic inflammation in patients with MPS. Pre-HCT, there is a clear pro-inflammatory profile present in patients with MPS compared with control subjects, which remained early after HCT. However, in patients with MPS I after 10 years of follow-up, the majority of systemic markers associated with a pro-inflammatory status declined. In contrast, markers associated with bone homeostasis remained highly elevated despite HCT and might reflect the ongoing skeletal disease after transplantation. Future research should evaluate whether these markers could serve as easily accessible biomarkers for the effect of new therapies on musculoskeletal symptoms in patients with MPS I and possibly also other MPS subtypes with musculoskeletal features. Furthermore, anti-inflammatory and anti-RANKL agents are interesting research subjects to further improve the clinical outcomes of patients with MPS, especially regarding the musculoskeletal manifestations.
Acknowledgments
The authors thank all parents and patients for participating in this study. The authors also thank M.J.C. René Eijkemans and Rebecca Stellato for their statistical input.
B.T.A.v.d.B. was supported by a research grant from the Sylvia Toth Charity Foundation while working on this study. B.T.A.v.d.B. is a PhD candidate at Utrecht University.
Funding support for this article was provided by the Sylvia Toth Charity Foundation. The sponsors of this study are public or nonprofit organizations that support science in general. They had no role in gathering, analyzing, or interpreting the data.
Authorship
Contribution: B.T.A.v.d.B. contributed to the design, planning, and acquisition of the data, performed analyses, interpreted the data, and drafted the manuscript, including figures; J.J.B. contributed to the design, planning and acquisition of the data, interpretation of the data, and critically revised the manuscript; E.M.D., N.V.-D., P.M.v.H., and S.N. contributed to the acquisition of the data, interpreted the data, and critically revised the manuscript; J.D. performed analyses, interpreted the data, and critically revised the manuscript; and B.T.A.v.d.B., J.J.B., and P.M.v.H. were responsible for the medical care of the patients; and the corresponding author had full access to the data and had final responsibility for the decision to submit for publication.
Conflict-of-interest disclosure: The authors declare no competing financial interests.
Correspondence: Stefan Nierkens, Center for Translational Immunology, University Medical Center Utrecht, Heidelberglaan 100, 3584 CX, Utrecht University, Utrecht, The Netherlands; e-mail: s.nierken@umcutrecht.nl.

