

Key Points
The obesity paradox in VTE was not substantially explained by a body mass–associated protein signature.
Leptin, the main protein in the signature, was inversely related to recurrent VTE and death but only under leptin-sensitive conditions.

Abstract
The obesity paradox, the controversial finding that obesity promotes disease development but protects against sequelae in patients, has been observed in venous thromboembolism (VTE). The aim of this investigation was to identify a body mass–related proteomic signature in VTE patients and to evaluate whether this signature mediates the obesity paradox in VTE patients. Data from the Genotyping and Molecular Phenotyping in Venous ThromboEmbolism Project, a prospective cohort study of 693 VTE patients, were analyzed. A combined end point of recurrent VTE or all-cause death was used. Relative quantification of 444 proteins was performed using high-throughput targeted proteomics technology. Measurements were performed in samples collected during the acute VTE event and at 12-month follow-up. An 11-protein signature (CLEC4C, FABP4, FLT3LG, IL-17C, LEP, LYVE1, MASP1, ST2, THBS2, THBS4, TSLP) for body mass in VTE patients was identified. The signature did not significantly mediate the obesity paradox (change in hazard ratio [HR]: 0.04; likelihood ratio test of nested models = 7.7; P = .74), but its main constituent protein, leptin, was inversely associated with recurrent VTE or death (adjusted HR [95% confidence interval] per standard deviation increase: 0.66 [0.46-0.94]). This relationship was significantly (P = .007) modified by markers of leptin resistance (ie, high body mass index and high circulating matrix metalloproteinase-2 levels). Although the signature did not substantially explain the obesity paradox, leptin appears to be protective against disease recurrence and death in VTE patients. This protective effect was abrogated under conditions of leptin resistance and hence was unrelated to the obesity paradox.
Introduction
The obesity paradox designates the observation that obesity confers a protective effect in patients against recurrent vascular events and mortality despite its deleterious roles in disease development, and it remains a hotly contested phenomenon. Although evidence favoring the paradox has been presented for a variety of pathologies, critics argue that the paradox is wholly attributable to forms of selection bias1,2 or unmeasured residual confounding.3 For example, it has been argued that findings suggestive of an obesity paradox may actually reflect wasting disease–induced cachexia, natural loss of body mass in advanced age, or obesity-related medication use, such as metformin.3
In venous thromboembolism (VTE), evidence for an obesity paradox has been established in large patient cohorts.4,5 Obesity is a known risk factor for primary VTE events and has been suggested to be predictive of recurrent events as well.6,7 Others acknowledge that in patient populations, a metabolically healthy obese phenotype that compares favorably to leaner, but metabolically unhealthier patients,8 is often observed.6 In the context of exacerbations of congestive heart failure, it was recently conjectured that the obesity paradox may in part be explained by the suppression of specific adverse cardiometabolic effects, particularly of insulin-like growth factor binding proteins 1 and 2.9 However, whether healthy obesity–associated molecular mechanisms could help explain the obesity paradox in VTE has not yet been investigated.
In this investigation, we set out to establish whether the obesity paradox in VTE might be explained by circulating proteins reflecting protective molecular mechanisms.
Methods
For this investigation, data from the Genotyping and Molecular Phenotyping in Venous ThromboEmbolism (GMP-VTE) Project were analyzed. The GMP-VTE Project is an investigator-initiated, multicenter prospective cohort study situated in Germany, which combines multiple clinical and biological data levels to elucidate the molecular mechanisms involved in acute and long-term VTE. The study design and implementation, including detailed information regarding all methodologic aspects, are described in detail elsewhere.10
Study participants
The study participants of the GMP-VTE Project are individuals with objectively established VTE who were enrolled during the diagnostic workup for acute VTE after presenting to hospital with clinical signs or symptoms of VTE. Participants came from 2 preexisting prospective cohort studies with clinical trial registration (VTEval: NCT02156401, FOCUS: DRKS00005939). Upon enrollment, each patient underwent a standardized investigation, including a detailed anamnesis to collect information on medical history, family history of relevant disease and medication intake, a comprehensive physical examination, and diagnostic imaging. Medication intake was registered using the Anatomical Therapeutic Chemical (ATC) classification system. Biosamples, especially venous blood samples, were collected from all study participants. Exclusion criteria were age < 18 years, contraindication for diagnostic imaging, and inability to provide consent. All study participants provided written informed consent for participation, collection of biomaterials, and subsequent data use for analysis. Study documents were approved by local ethics committees at all study sites, and the GMP-VTE Project was conducted in accordance with the Declaration of Helsinki (2013, 7th revision) and the General Data Protection Regulation (EU 2016/679).
VTE diagnostic modalities
Presence of deep vein thrombosis (DVT) was assessed using whole-leg color Doppler ultrasonography and pulmonary embolism by computed tomographic pulmonary angiography or ventilation/perfusion scintigraphy. All diagnoses were independently adjudicated by board-certified angiologists or radiologists connected to the involved study sites.
Clinical end point
A combined end point of recurrent VTE or all-cause death was defined as the primary end point of the study. Recurrent VTE was defined as any incident DVT or pulmonary embolism (PE) event that occurred during 2 years of follow-up. Incident events were monitored by standardized annual computer-assisted telephone interviews and confirmed by use of hospital records insofar as these were available. Based on general legal obligation, all-cause death was recorded by local registry offices, whose databases were continuously and electronically queried for updates.
Proteomic profiling
Venous blood samples were collected from all participants during the acute phase of VTE and during follow-up visits. All blood samples were frozen and centrally stored at −80°C in the Biomaterial Bank Mainz for future analysis. Relative quantification of protein concentrations was performed on ethylenediaminetetraacetic acid–treated plasma samples, using multiplex proximity extension assay technology (Olink Bioscience, Uppsala, Sweden). Five 96-plex immunoassay panels (trading names: Target 96 Cardiovascular II, Cardiovascular III, Inflammation, Immune Response, Cardiometabolic) with minimal overlap regarding proteins enabled the relative quantification of 444 unique proteins per individual (listed in supplemental Table 1), covering a diverse array of biological processes. Measurements were performed in samples collected at baseline (ie, during the acute VTE event) and at 12-month follow-up. Detailed information on the complete proteomics measurement and postprocessing pipeline for the GMP-VTE Project was published previously.10
Analysis concept and statistical analysis
Study participants who were underweight (body mass index [BMI] < 18.5 kg/m2) were excluded from analysis to prevent cachexia caused by competing comorbidities from influencing results. Baseline characteristics for eligible individuals were stratified by weight classes as follows: normal weight, 18.5 to 25 kg/m2; overweight, 25 to 30 kg/m2; obese, ≥30 kg/m2. These were expressed as relative and absolute frequencies in case of categorical variables and as mean with standard deviation or median with interquartile range (IQR) for continuous variables, as appropriate to the distribution. Cumulative incidence curves were calculated as 1 minus the Kaplan-Meier estimator; differences between curves were tested with the log-rank test. The relationship between BMI and end point was evaluated using a Cox regression model predicting recurrent VTE or death using BMI modeled with restricted cubic splines with 3 knots to allow for nonlinearity. A Wald χ2 chunk test, implemented in the R package rms,11 was performed to assess whether there was potential for nonlinearity. Covariate-adjusted survival analyses were conducted with Cox regression models, predicting recurrent VTE or death as the outcome in each model. Two-sided P < .05 was considered a relevant association in this analysis.
A flowchart illustrating the analysis is provided in supplemental Figure 1. Before the identification of a body mass–related proteomic signature, patients with active cancer were excluded, so that a relevant source of potential bias with respect to the investigation was eliminated. Least absolute shrinkage and selection operator (LASSO)-regularized linear regression was used to identify the smallest, but optimal, set of proteins among the total set of 444 that predicted continuous BMI. Adjustment covariates were age, sex, smoking status, history of VTE, C-reactive protein concentrations, D-dimer concentrations, and baseline medication intake. The medication intake that was accounted for in models constituted the use of cardiovascular medication (ATC code: C01), antithrombotic medication (ATC code: B01), nonsteroidal anti-inflammatory drugs (NSAIDs; ATC code: M01A), contraceptives (ATC code: G03A), and corticosteroids (ATC code: H02). To allow for nonlinear relationships between proteins, fractional polynomial transformations were applied to all variables before inclusion in the model. Further details of the regularized regression can be found in the supplemental Material. To ensure that the identification of body mass–associated proteins was not confounded by the acute disease condition itself, the same model was additionally recomputed in samples collected 12 months after the index VTE event. Proteins overlapping between both time points were considered particularly robust predictors of BMI and selected for the body mass protein signature. Because of this procedure, the signature was determined on the basis of only those individuals who had proteomic measurements at both time points.
Finally, the relationship between the body mass–associated protein signature and the end point and the robustness of the obesity paradox against adjustment by this protein signature were tested using Cox proportional hazards regression models, where the same significance threshold as used previously was applied. Likelihood ratio tests were used to test for significant differences in fit between nested models. Additional analyses of the proteins that were identified as possibly protective were conducted using Cox regression models with specific adjustment and interaction terms. All analyses incorporating proteins were performed after excluding individuals with active cancer. All analyses were performed in R (R Foundation for Statistical Computing, Vienna, Austria), version 3.5.3.
Results
Baseline characteristics for 657 VTE patients, having excluded underweight individuals (n = 6) and individuals without BMI data (n = 30), are shown stratified by weight class in Table 1. Age and sex were approximately equally distributed between weight classes. VTE provoking risk factors did not exhibit any trends in relation to weight class, except with regard to the prevalence of active malignancy, which was inversely and monotonically related to BMI. The prevalence of history of VTE was highest in obese patients but lowest in overweight patients. Cardiovascular risk factors and diseases were distributed in line with expectation: in particular, the prevalence of diabetes, hypertension, and coronary artery disease increased with increasing body mass. The progressively increasing intake of cardiovascular medications by weight class matched the worse clinical profile. There were no differences in intake of antithrombotic medications between classes (detailed overview provided in supplemental Table 2). D-dimer and C-reactive protein concentrations were lowest in the normal weight class.
Baseline characteristics, stratified by weight class
| Normal weight (n = 181) | Overweight (n = 239) | Obese (n = 237) | |
|---|---|---|---|
| Demographic characteristics | |||
| Age, mean (standard deviation) | 58.1 (18.7) | 63 (15) | 59 (14.4) |
| Female sex, % (n) | 42.5 (77) | 41.4 (99) | 44.3 (105) |
| VTE-related risk factors | |||
| Active cancer, % (n) | 15.6 (28) | 12.8 (30) | 8.1 (19) |
| History of VTE, % (n) | 28.1 (50) | 23.5 (54) | 35.4 (80) |
| Recent surgery, % (n) | 6.1 (11) | 7.7 (18) | 7.4 (17) |
| Recent trauma, % (n) | 4.5 (8) | 4.7 (11) | 4.4 (10) |
| Recent immobilization, % (n) | 17.2 (31) | 16.8 (39) | 15.5 (36) |
| Recent > 4-hour travel, % (n) | 14.6 (26) | 13.5 (31) | 10 (23) |
| Cardiovascular risk factors | |||
| Diabetes, % (n) | 3.9 (7) | 13.1 (30) | 21.1 (48) |
| Arterial hypertension, % (n) | 36 (64) | 49.8 (115) | 67.3 (152) |
| Current smoking, % (n) | 18.6 (33) | 14.3 (32) | 16.5 (36) |
| Cardiovascular disease | |||
| Atrial fibrillation, % (n) | 5.6 (10) | 4.4 (10) | 3.9 (9) |
| Heart failure, % (n) | 3.4 (6) | 5.8 (13) | 4.4 (10) |
| Coronary artery disease, % (n) | 6.7 (12) | 7 (16) | 8.2 (18) |
| Peripheral artery disease, % (n) | 6 (8) | 3.4 (5) | 3.6 (5) |
| History of stroke, % (n) | 4.5 (8) | 4.3 (10) | 6.1 (14) |
| Medication intake | |||
| Cardiovascular medication, % (n) | 57.9 (95) | 69.8 (148) | 73.2 (153) |
| Antithrombotic medication, % (n) | 91.5 (150) | 95.3 (202) | 92.8 (194) |
| NSAIDs, % (n) | 5.5 (9) | 4.7 (10) | 5.2 (12) |
| Corticosteroids, % (n) | 6.1 (10) | 14.2 (30) | 5.3 (11) |
| Contraceptives, % (n) | 7.9 (13) | 3.3 (7) | 3.3 (7) |
| Laboratory markers | |||
| D-dimer in mg/L, median (IQR) | 2.9 (1.3/7.2) | 3.9 (1.5/7.7) | 3.8 (1.6/7.5) |
| C-reactive protein in mg/L, median (IQR) | 12 (4.8/41) | 18 (4.7/45.5) | 18 (6.2/46.2) |
Normal weight was defined as BMI between 18.5 and 25 kg/m2; overweight as BMI ≥ 25 and <30 kg/m2, and obese as BMI of ≥30 kg/m2.
Recurrent VTE and death by weight class
The incidence of recurrent VTE and death by weight class is shown in Figure 1. Here, an approximately linear, inverse dose-response relationship between BMI and the aggregate clinical outcome was observed (log-rank P = .007): normal weight individuals had the highest rates of recurrent VTE or death, overweight individuals had a slightly reduced rate (incidence rate ratio = 0.85; 95% confidence interval [CI] = 0.52-1.40; P = .53), and obese individuals had a strongly reduced incidence of recurrent VTE or death (incidence rate ratio = 0.41; 95% CI = 0.23-0.74; P = .003). A model incorporating restricted cubic splines to model the relationship between BMI and outcome confirmed that there was no evidence for a nonlinear relationship in this cohort (P for nonlinearity = .90; supplemental Figure 2). Disaggregated end points (incident DVT, PE, all-cause death) showed similar progressions (supplemental Figure 3).
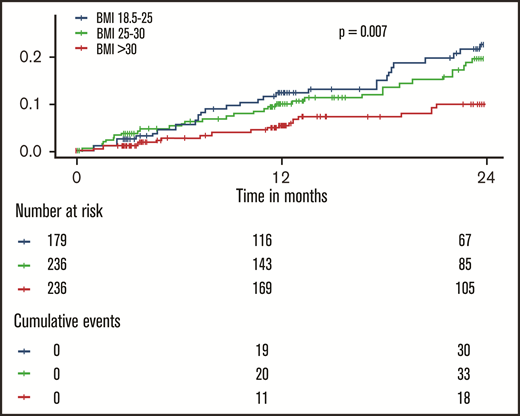
Inverse dose-dependence between the body mass index and recurrent events and death in patients with venous thromboembolism. The shown P value was calculated with a log-rank test.
Inverse dose-dependence between the body mass index and recurrent events and death in patients with venous thromboembolism. The shown P value was calculated with a log-rank test.
Robustness of the obesity paradox against potential sources of confounding
After accounting for commonly cited sources of confounding in literature, including age, active cancer, cardiovascular disease, history of VTE, cardiovascular risk factors, and medication intake, obesity was associated with a nearly 50% reduction (hazard ratio [HR]: 0.54; 95% CI: 0.31-0.94) in recurrent VTE or death. Every 5-point increase in BMI was associated with a 20% hazard reduction (HR: 0.80; 95% CI: 0.63-1.02). Adjusted HRs for obesity and separately for BMI per 5-point increment are shown in supplemental Table 3.
Relationship between the body mass–associated proteomic signature and clinical outcome
A robust proteomic signature for body mass in VTE patients consisting of 11 proteins (CLEC4C, FABP4, FLT3LG, IL-17C, LEP, LYVE1, MASP1, ST2, THBS2, THBS4, TSLP) was identified from the investigations at baseline and 12-month follow-up (Figure 2; protein abbreviations and corresponding names listed in supplemental Table 1). A moderate degree of variance in BMI was accounted for by the models at both time points (supplemental Tables 4 and 5) used to derive this signature (baseline model R2: 0.77; 10-fold cross-validated R2: 0.33; follow-up model R2: 0.61, 10-fold cross-validated R2: 0.24). Besides age, only smoking status and contraceptive use were selected in the baseline model, and no clinical variables were selected in the follow-up model, indicating that the variance was primarily accounted for by proteomic markers.
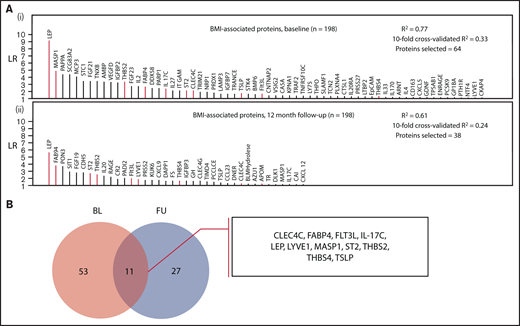
Identification of a body mass–associated plasma protein signature at 2 measurement time points. (A) Proteins selected in LASSO-regularized regression models with BMI as the continuous dependent variable: (i) all BMI-related proteins selected at the baseline measurement and (ii) those proteins selected at the follow-up measurement (12 months postindex event). The full model specifications and results, including adjustment covariates, are shown in supplemental Tables 4 and 5. (B) Selection of overlapping proteins between the baseline and follow-up measurement time points. The intersection of the proteins from both models (these are highlighted in red in panel A) was selected as robustly associated with BMI.
Identification of a body mass–associated plasma protein signature at 2 measurement time points. (A) Proteins selected in LASSO-regularized regression models with BMI as the continuous dependent variable: (i) all BMI-related proteins selected at the baseline measurement and (ii) those proteins selected at the follow-up measurement (12 months postindex event). The full model specifications and results, including adjustment covariates, are shown in supplemental Tables 4 and 5. (B) Selection of overlapping proteins between the baseline and follow-up measurement time points. The intersection of the proteins from both models (these are highlighted in red in panel A) was selected as robustly associated with BMI.
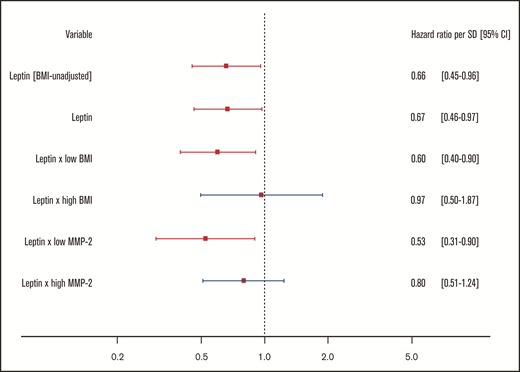
For the body mass–associated protein signature, age- and sex-adjusted HRs for the clinical end point recurrent VTE or death are shown per protein in Figure 3. In this investigation, only leptin (LEP) was significantly associated with this outcome. Every standard deviation increase in leptin concentration was associated with a 34% reduction (HR: 0.66; 95% CI: 0.46-0.94) in incidence of recurrent VTE or death.
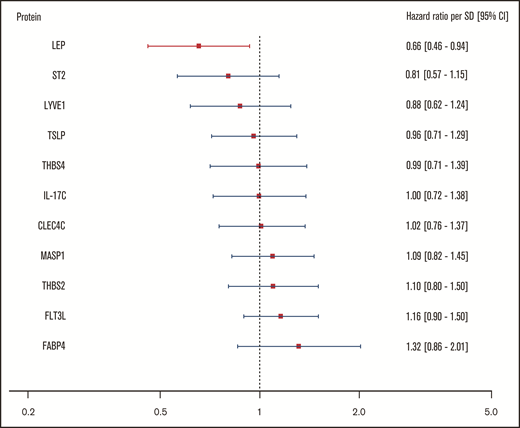
Relationship of body mass–associated protein signature with recurrent VTE or death. Shown in this figure are the age- and sex-adjusted HRs with 95% CIs from a Cox regression model incorporating the 11 BMI-related proteins as identified in the proteomic analysis, predicting the combined recurrent VTE or death end point. In this model, proteins were transformed in accordance with the previously LASSO-selected transformation associated with the highest λ ratio. HRs reflect the increase or reduction in hazard per standard deviation increase in concentration of a given protein. CLEC4C, C-type lectin domain family 4 member C; FABP4, fatty acid–binding protein; Flt3L, Fms-related tyrosine kinase 3 ligand; IL-17C, interleukin-17C; LEP, leptin; LYVE1, lymphatic vessel endothelial hyaluronic acid receptor 1; MASP1, Mannan-binding lectin serine protease 1; ST2, ST2 protein; THBS2, thrombospondin-2; THBS4, thrombospondin-4; TSLP, thymic stromal lymphopoietin.
Relationship of body mass–associated protein signature with recurrent VTE or death. Shown in this figure are the age- and sex-adjusted HRs with 95% CIs from a Cox regression model incorporating the 11 BMI-related proteins as identified in the proteomic analysis, predicting the combined recurrent VTE or death end point. In this model, proteins were transformed in accordance with the previously LASSO-selected transformation associated with the highest λ ratio. HRs reflect the increase or reduction in hazard per standard deviation increase in concentration of a given protein. CLEC4C, C-type lectin domain family 4 member C; FABP4, fatty acid–binding protein; Flt3L, Fms-related tyrosine kinase 3 ligand; IL-17C, interleukin-17C; LEP, leptin; LYVE1, lymphatic vessel endothelial hyaluronic acid receptor 1; MASP1, Mannan-binding lectin serine protease 1; ST2, ST2 protein; THBS2, thrombospondin-2; THBS4, thrombospondin-4; TSLP, thymic stromal lymphopoietin.
To assess whether the body mass signature could partially account for the observed obesity paradox in VTE, a model containing clinical variables and the signature was compared with a model containing only clinical variables. The obesity paradox did not appear to be mediated by the proteomic signature as evidenced by a lack of significant change in the HR estimate on inclusion of the signature (ΔHR: 0.04; likelihood ratio test, χ2(11) = 7.7; P = .74; supplemental Table 6).
Additional analysis of the protective effect of leptin and modulation by leptin sensitivity
High leptin concentrations were previously found to be BMI independently protective against disease progression and death in patients with PE12 and pulmonary hypertension.13 Hence, we investigated whether any mediation by BMI of the relationship between leptin and the outcome was present in this cohort. In addition, we investigated whether the sensitivity of patients to leptin could moderate the magnitude of this effect. In a recent mouse model of obesity, it was found that activated matrix metalloproteinase-2 (MMP-2) induces leptin resistance by cleaving the leptin receptor (LEPR-B) and that silencing MMP-2 is sufficient to overcome leptin resistance in mice.14 Thus, we additionally investigated the role of MMP-2 in this context. Sequence alignment showed that leptin and MMP-2 are highly conserved between mice and humans, exhibiting high interspecies protein sequence identity and similarity with 83.2% and 91% for leptin and 95.6% and 97.4% for MMP-2, respectively (supplemental Table 7).
The effects of markers of leptin resistance on the relationship between leptin and the study outcome were investigated by stratified 1 − Kaplan-Meier plots showing incidence of recurrent VTE or death by high/low leptin concentration in low vs high (median split) BMI and low vs high (median split) MMP-2 concentration subgroups. Here, high leptin was defined as a leptin concentration in the top tertile of concentrations in the study sample. The cumulative incidence of recurrent VTE or death showed no clear difference in the subgroups with high and low leptin concentrations at baseline (high: top tertile leptin concentrations, low: bottom two tertiles of leptin concentrations; Figure 4A). In contrast, Figure 4B-E illustrates that the relationship between leptin concentration and clinical outcome is significantly and strongly affected by BMI and MMP-2 as modulators of leptin resistance. Interaction models showed that higher leptin concentrations were highly protective in normal weighted individuals (ie, below median BMI of 28.4 kg/m2; high leptin: HR: 0.24, 95% CI: 0.07-0.80; P = .02, P for interaction = .007) and those with low MMP-2 concentrations (ie, below median; high leptin: HR: 0.10; 95% CI: 0.01-0.72; P = .02, P for interaction = .02; supplemental Tables 8 and 9). In the opposite conditions (≥median BMI, ≥median MMP-2 concentrations), which might be taken to signify a state of leptin resistance, high leptin concentrations were not significantly related to the clinical outcome. Finally, Cox regression models with adjustment for a large panel of potentially confounding clinical variables, in which leptin was modeled continuously (Figure 5), confirmed that both observations were robust.
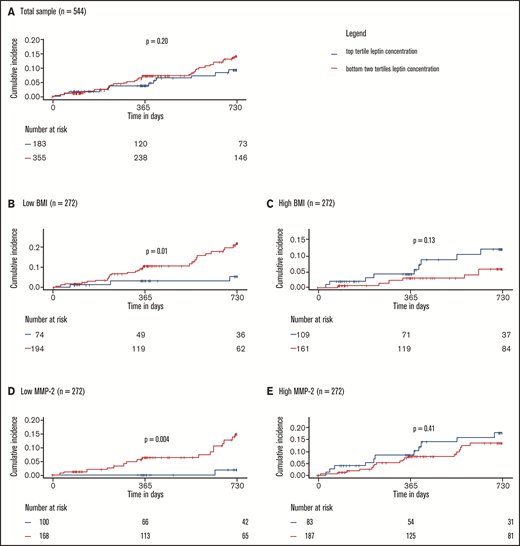
Protective effect of leptin on recurrent VTE and death depends on leptin sensitivity. (A) Total sample. Low and high BMI (B-C) and MMP-2 (D-E) were defined as below or equal to median BMI/MMP-2 or above median BMI/MMP-2, respectively. P values were calculated with log-rank tests. Interactions between high leptin levels and BMI and MMP-2 were significant and are reported in detail in supplemental Tables 8 and 9.
Protective effect of leptin on recurrent VTE and death depends on leptin sensitivity. (A) Total sample. Low and high BMI (B-C) and MMP-2 (D-E) were defined as below or equal to median BMI/MMP-2 or above median BMI/MMP-2, respectively. P values were calculated with log-rank tests. Interactions between high leptin levels and BMI and MMP-2 were significant and are reported in detail in supplemental Tables 8 and 9.
Protective effect of leptin on recurrent VTE and death persists after adjustment by potential confounding. Shown in this figure are the HRs with 95% CIs for a standard deviation increase in leptin concentrations from 4 Cox regression models, all predicting the combined recurrent VTE or death end point. All models are adjusted for age, sex, cardiovascular disease, history of VTE, diabetes, arterial hypertension, medication intake at baseline (cardiovascular medication, antithrombotic therapy, corticosteroids, contraceptives, NSAIDs), and the BMI-associated proteomic signature. All models except the first (denoted by BMI-unadjusted) are additionally adjusted for continuous BMI. The third and fourth models contain interaction terms. Low/high BMI and low/high MMP-2 were defined based on median splits.
Protective effect of leptin on recurrent VTE and death persists after adjustment by potential confounding. Shown in this figure are the HRs with 95% CIs for a standard deviation increase in leptin concentrations from 4 Cox regression models, all predicting the combined recurrent VTE or death end point. All models are adjusted for age, sex, cardiovascular disease, history of VTE, diabetes, arterial hypertension, medication intake at baseline (cardiovascular medication, antithrombotic therapy, corticosteroids, contraceptives, NSAIDs), and the BMI-associated proteomic signature. All models except the first (denoted by BMI-unadjusted) are additionally adjusted for continuous BMI. The third and fourth models contain interaction terms. Low/high BMI and low/high MMP-2 were defined based on median splits.
Discussion
In this investigation, the obesity paradox was replicated in a large and well-characterized cohort of prospectively enrolled patients with acute VTE. In this cohort, obesity was associated with an approximate halving of the hazard of recurrent VTE or death in the 2 years after an acute VTE event. The size of the observed effect closely matches results found previously. In 10 114 patients of the prospective Registro Informatizado de Enfermedad TromboEmbólica (RIETE) patient registry, mortality in obese VTE patients was half that of nonobese patients; the incidence of fatal PE decreased monotonically across increasing weight classes, excluding cachexic patients.4 A more recent study, based on data from the German nationwide inpatient database, similarly found that obesity appeared to confer a survival benefit among more than 340 000 inpatients with PE.5 Although the extensive phenotyping performed for this study allowed to account for a much larger array of potential confounders than previous studies, the obesity paradox proved robust to adjustment for all included potentially confounding clinical variables. The analytic design of this investigation ruled out many potential artifactual explanations for the obesity paradox, including age differences, overgeneralization of cachexia, underlying cancer, differences in medication intake, or a supposed less serious clinical profile in obese vs nonobese patients resulting from lead-time bias.
For this investigation, a body mass–associated proteomic signature was established using a high-throughput proteomics and cross-validated regularized regression modeling approach. The identified signature consists of 11 proteins (CLEC4C, FABP4, FLT3LG, IL-17C, LEP, LYVE1, MASP1, ST2, THBS2, THBS4, TSLP) that were consistently related to BMI in plasma sampled during the acute phase of VTE and at 12 months postindex event. The proteins in the signature have established connections to obesity.15-26
Although the body mass–associated proteomic signature did not relevantly explain the obesity paradox, one of the identified proteins, leptin, was found to be inversely related to VTE recurrence and death in this cohort. Leptin, like obesity, has been described as having a paradoxical relationship with cardiovascular and inflammatory disease, including coronary artery disease, diabetes, chronic kidney disease, and pulmonary hypertension.13 In the specific case of PE, it was previously found that low leptin concentrations BMI-independently predict a complicated course of disease and mortality,12 and in pulmonary hypertension, the ratio of leptin to BMI was strongly inversely related to death.13 In this analysis, the protective effect of leptin among VTE patients was confirmed, and the effect was again not simply a substitute for BMI. Going beyond previous studies, it was additionally shown that the protective effect of leptin was absent under conditions of leptin resistance (ie, high body mass or high circulating concentrations of the leptin receptor-cleaving protein MMP-2), suggesting that the effect is dependent on the ability of leptin to bind to its receptor.
Leptin action is dependent on its binding to the long form isoform of leptin receptor (LEPR-B), which is predominantly expressed in the central nervous system, particularly the hypothalamus.27 Because of its size, leptin cannot pass through the blood-brain barrier (BBB) to reach its neuronal targets unless it first binds to LEPR-B,28 although the exact mechanism of BBB transportation is unclear. On leptin binding, LEPR-B undergoes phosphorylation by Janus kinase-2 activating phosphorylation-dependent signal transduction cascades, including signal transducer and activator of transcription 5 and SH2-containing tyrosine phosphatase-2/extracellular signal regulated kinase.27 The LEP-LEPR-B complex additionally activates several other pleiotropic signaling pathways, such as the MAPK pathway,29 as well as a phosphatidylinositol 3-kinase–independent Akt/endothelial nitric oxide synthase (eNOS) pathway.30
Although the connections between the highly upstream signal transducer and activator of transcription, SH2-containing tyrosine phosphatase-2/extracellular signal regulated kinase, and MAPK pathways and VTE are ambiguous on account of their context-specific pleiotropy, evidence linking the Akt-eNOS pathway to clinical outcome in VTE is more consistent. In mice, in human blood and in histopathologic samples, eNOS mRNA is upregulated in acute PE, whereas serum eNOS is lowered compared with healthy controls.31 Although the reduced peripheral concentrations of the primarily endothelial membrane-secreted eNOS enzyme may indicate endothelial dysfunction, the upregulation of eNOS gene expression likely represents a compensatory effect. In Chinese populations, the eNOS 894G>T loss-of-function polymorphism was shown to be a risk factor for primary32 and recurrent VTE.33 It is intuitive that enhanced leptin signaling–mediated NO synthesis would result in an ameliorated clinical course in patients with VTE. Because cleavage of the leptin receptor effectively induces leptin resistance and Akt/eNOS signaling is impaired in conditions of leptin resistance, notably obesity,34 it is unsurprising that the vasoprotective effect of leptin would also be abrogated under these conditions. In this study, it was observed that the protective effect of leptin in VTE disappears entirely under conditions of leptin resistance. Leptin signaling–dependent eNOS activation, and loss thereof, could be one potential explanatory mechanism for these findings. Naturally, other downstream effects of leptin signaling, effected through other pathways, should also be explored.
Limitations
The possibility of a paradoxical association between obesity and clinical outcome in VTE caused by selection bias cannot be ruled out for this study. Although a range of commonly suspected confounders was adjusted for in all analyses, it is possible that unmeasured residual confounding was still present. Nevertheless, the observed dose-response relationship between BMI and clinical outcome makes it less plausible that this association was artifactual. In addition, more specific markers of visceral obesity, such as waist circumference, waist-to-hip ratio, or measurements of skinfold thickness were not available in this study. However, it is unlikely that the relatively small differences between these methods in terms of identifying visceral obesity35 could account for an effect of the magnitude found in this study. Finally, the findings related to modification of the relationship between leptin and clinical outcome by markers of leptin resistance were of a post hoc nature. These findings should be interpreted accordingly and be replicated in external cohorts.
Conclusions
This analysis demonstrated the robustness of the obesity paradox in VTE to adjustment by a large array of potential confounders. The body mass–associated plasma protein signature of a high-throughput targeted proteomics approach did not substantially explain the paradox. However, the main component of the signature, leptin, had a beneficial role in VTE outcome in nonobese individuals independent of the clinical profile. The dependency of this protective effect on leptin sensitivity was confirmed via the leptin receptor-cleaving protein MMP-2.
Acknowledgments
The authors thank all study participants of the VTEval and the FOCUS BioSeq studies and the study investigators of the VTEval and FOCUS BioSeq studies, including the following: VTEval—C. Espinola-Klein (Mainz), S. Konstantinides (Mainz), K. J. Lackner (Mainz), T. Münzel (Mainz), G. Weißer (Mainz), and P. S. Wild (Mainz); FOCUS Bioseq—R. Ewert (Greifswald), A. H. Ghofrani (Gießen), M. Halank (Dresden), M. Held (Würzburg), S. Konstantinides (Mainz), F. J. Meyer (München Bogenhausen), C. Opitz (Berlin), H.-J. Seyfarth (Leipzig), P. S. Wild (Mainz). The authors also thank Heidrun Lamparter, Bianca Zäpf, and Jacqueline Kandsberger for study and project management and Heidrun Dorsch for project management. Collaborators for this study were H. A. Ghofrani (München), M. Held (Würzburg), F. J. Meyer (Gießen), C. Opitz (Berlin), H-J. Seyfarth (Leipzig), and G. Weißer (Mainz).
The GMP-VTE project was funded by the German Federal Ministry of Education and Research (grant BMBF 01EO1003), internal funds from the Clinical Epidemiology and Systems Medicine (Center for Thrombosis and Hemostasis), and a grant from Bayer AG.
Authorship
Contribution: V.T.C., T.K., J.P., A.S., M.P.-N., S.R., L.E., M.L., J.G., and P.S.W. designed the analysis; V.T.C., J.P., and P.S.W. drafted the manuscript; V.T.C. and A.S. performed the statistical analysis; M.L., V.T.C. and M.A.A.-N. performed the sequence alignment; V.T.C. designed the visual summary of the results; and all authors contributed to the interpretation of results and the composition of the final manuscript.
Conflict-of-interest disclosure: T.K. receives consulting fees as biomarker consultant from Bayer AG, outside the submitted work. J.P. received funding for lecturing from Bayer AG and Boehringer Ingelheim, outside the submitted work. M.P.-N. is an employee of Boehringer Ingelheim. J.G., M.S., S.H., and K.L. are employees of Bayer AG. M.H. has received personal fees for lectures and consultations for travel/accommodation and meeting expenses from Acceleron, Actelion, AstraZeneca, Bayer, BERLIN CHEMIE, GSK, Janssen-Cilag, MSD, Novartis, and OMT, all outside the submitted work. S.V.K. reports research grants and personal fees from Bayer AG; research grants and personal fees from Actelion; research grants and personal fees from Daiichi-Sankyo; personal fees from Biocompatibles Group UK–Boston Scientific Group; personal fees from Pfizer-Bristol-Myers Squibb; personal fees from Novartis; personal fees from MSD; and research grants from Servier, all outside the submitted work. P.S.W. reports grants from Bayer AG and from the German Federal Ministry of Education and Research, during the conduct of the study; grants and personal fees from Boehringer Ingelheim; grants and personal fees from Novartis Pharma; grants from Philips Medical Systems; grants and personal fees from Sanofi-Aventis; grants and personal fees from Bayer Health Care; grants from Daiichi Sankyo Europe; personal fees from Bayer Health Care; personal fees from Astra Zeneca; personal fees and nonfinancial support from Diasorin; and nonfinancial support from I.E.M., outside the submitted work. All remaining authors declare no competing financial interests.
Correspondence: Philipp S. Wild, University Medical Centre Mainz of the Johannes Gutenberg University Mainz Langenbeckstrasse 1, 55131 Mainz, Germany; e-mail: philipp.wild@unimedizin-mainz.de.

