

Key Points
We used whole-genome sequencing data to examine 134 candidate risk alleles for acute vaso-occlusive pain in sickle cell disease.
Acute vaso-occlusive pain in sickle cell disease is associated with a polygenic score composed of 21 variants across 9 independent loci.

Abstract
Individuals with monogenic disorders can experience variable phenotypes that are influenced by genetic variation. To investigate this in sickle cell disease (SCD), we performed whole-genome sequencing (WGS) of 722 individuals with hemoglobin HbSS or HbSβ0-thalassemia from Baylor College of Medicine and from the St. Jude Children’s Research Hospital Sickle Cell Clinical Research and Intervention Program (SCCRIP) longitudinal cohort study. We developed pipelines to identify genetic variants that modulate sickle hemoglobin polymerization in red blood cells and combined these with pain-associated variants to build a polygenic score (PGS) for acute vaso-occlusive pain (VOP). Overall, we interrogated the α-thalassemia deletion −α3.7 and 133 candidate single-nucleotide polymorphisms (SNPs) across 66 genes for associations with VOP in 327 SCCRIP participants followed longitudinally over 6 years. Twenty-one SNPs in 9 loci were associated with VOP, including 3 (BCL11A, MYB, and the β-like globin gene cluster) that regulate erythrocyte fetal hemoglobin (HbF) levels and 6 (COMT, TBC1D1, KCNJ6, FAAH, NR3C1, and IL1A) that were associated previously with various pain syndromes. An unweighted PGS integrating all 21 SNPs was associated with the VOP event rate (estimate, 0.35; standard error, 0.04; P = 5.9 × 10⁻¹⁴) and VOP event occurrence (estimate, 0.42; standard error, 0.06; P = 4.1 × 10⁻¹³). These associations were stronger than those of any single locus. Our findings provide insights into the genetic modulation of VOP in children with SCD. More generally, we demonstrate the utility of WGS for investigating genetic contributions to the variable expression of SCD-associated morbidities.
Introduction
Sickle cell disease (SCD) is an autosomal recessive disorder caused by HBB gene mutations that generate structurally abnormal sickle hemoglobin (HbS, α2βS2).1,2 Under conditions of physiologic hypoxia, HbS forms rigid polymers that cause red blood cells (RBCs) to become sickle shaped and trigger hemolysis, hypercoagulability, inflammation, endothelial cell dysfunction, and vascular occlusion. Clinical consequences include acute and chronic pain, progressive multiorgan damage, and early mortality. The onset and evolution of SCD manifestations are regulated by incompletely defined genetic modifiers.3-7 Defining these modifiers will provide insights into SCD pathophysiology and may guide individualized therapies.
Some genetic variants modify SCD phenotypes by influencing the rate of HbS polymerization in RBCs. These include the thalassemias and variants that modulate RBC fetal hemoglobin (HbF, α2γ2) expression.8,9 Other modifiers act outside RBCs to influence specific complications. Candidate gene surveys, genome-wide association studies (GWASs), and whole-exome sequencing (WES) have identified potential modifier genes for SCD-associated acute chest syndrome,10,11 stroke,12,13 and acute vaso-occlusive pain (VOP) episodes.10,14-20 Most of these studies have analyzed only single candidate alleles. However, most phenotypes associated with SCD, and monogenic disorders in general, are influenced by many variants, necessitating the development of polygenic scores (PGSs).21 It is suboptimal to build PGSs for SCD comprehensively from WES or single-nucleotide polymorphism (SNP) arrays, which are less sensitive for detecting structural variants and not comprehensive. Moreover, it can be challenging to infer missing SNPs by imputation because of insufficient reference data on African Americans.
To better define genotype–phenotype relations in SCD, we initiated the Sickle Cell Genome Project (SGP) by performing whole-genome sequencing (WGS) on participants from Baylor College of Medicine (BCM) and from the St. Jude Children’ Research Hospital Sickle Cell Clinical Research and Intervention Program (SCCRIP) longitudinal cohort study (clinicaltrials.gov #NCT02098863).22 Here, we demonstrate the utility of WGS as a 1-time test for accurately identifying and analyzing potential modifier alleles that influence SCD phenotypes, using acute VOP as an example. We interrogated the α-thalassemia deletion −α3.7 and 133 candidate SNPs to generate a 21-SNP, 9-gene PGS, which was more strongly associated with VOP event rate and occurrence than any single variant. Our findings provide new insights into the genetic factors that may influence the frequency of VOP. More generally, we illustrate the power of WGS combined with longitudinal phenotyping to examine SCD modifier genes comprehensively. The SGP WGS dataset provides a new resource for SCD research that is available through a cloud-based platform (https://sickle-cell.stjude.cloud; https://www.biorxiv.org/content/10.1101/2020.08.24.264614v1).
Methods
Study design and study cohorts
The SGP study was approved by the Institutional Review Boards of BCM and St. Jude. All participants or their legal guardians provided written informed consent. The SCCRIP cohort is described elsewhere.22Figure 1 shows the experimental workflow. We performed WGS on 722 individuals with HbSS or HbSβ0-thalassemia to verify genetic diagnoses and identify SNPs and structural variants, including the common α-thalassemia deletion −α3.7 (Table 1; Figure 2). Next, 585 individuals with genetically confirmed HbSS/HbSβ0 thalassemia, for whom RBC %HbF and RBC indices were determined at ≥2 years of age, were analyzed for genetic associations with the cross-sectional baseline RBC %HbF by GWASs and a rare variant candidate gene–based approach (supplemental Table 1). Finally, 327 SCCRIP participants, aged 1 to 6 years, were analyzed for associations between longitudinal RBC %HbF or 134 candidate gene variants and longitudinal VOP events over 6 years, using the Sleep and Asthma Cohort (SAC)23 for partial external validation (Table 2).

Study design and datasets. The SGP cohort consists of 722 participants from BCM or the SCCRIP cohort at St. Jude Children’s Research Hospital who were analyzed by WGS. Globin gene analysis was performed for all participants to ascertain α-thalassemia, β-thalassemia, and hereditary persistence of fetal hemoglobin). GWASs and candidate gene–based testing for RBC %HbF were performed for 585 participants with WGS-confirmed HbSS or HbSβ0-thalassemia for whom RBC indices and %HbF were available after the age of 2 years and to whom no hydroxyurea therapy had been administered for at least 90 days. Genetic association studies of VOP events were performed for 327 SCCRIP participants who were analyzed longitudinally at ages 1 to 6 years. Covariates for VOP association studies included α-thalassemia status, modifier alleles for HbF expression, and genetic variants associated with pain of various etiologies. Validation for the SCCRIP VOP studies was performed by analyzing SCRIPP data with TSIR and by analyzing VOP-genotype associations in the SAC cohort.
Study design and datasets. The SGP cohort consists of 722 participants from BCM or the SCCRIP cohort at St. Jude Children’s Research Hospital who were analyzed by WGS. Globin gene analysis was performed for all participants to ascertain α-thalassemia, β-thalassemia, and hereditary persistence of fetal hemoglobin). GWASs and candidate gene–based testing for RBC %HbF were performed for 585 participants with WGS-confirmed HbSS or HbSβ0-thalassemia for whom RBC indices and %HbF were available after the age of 2 years and to whom no hydroxyurea therapy had been administered for at least 90 days. Genetic association studies of VOP events were performed for 327 SCCRIP participants who were analyzed longitudinally at ages 1 to 6 years. Covariates for VOP association studies included α-thalassemia status, modifier alleles for HbF expression, and genetic variants associated with pain of various etiologies. Validation for the SCCRIP VOP studies was performed by analyzing SCRIPP data with TSIR and by analyzing VOP-genotype associations in the SAC cohort.
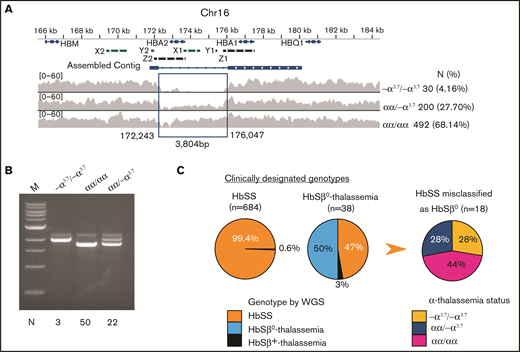
Characterization of α- and β-thalassemia alleles in the SGP cohort. (A) The extended α-globin locus on chromosome 16. The α-globin genes HBA1 and HBA2 are indicated on top. X1 and X2, Y1 and Y2, and Z1 and Z2 represent duplicated regions with high sequence similarity where unequal crossing over generates gene deletions. The α-thalassemia deletion −α3.7 was identified by reduced density of sequencing reads within the indicated assembled contig. The number and percentage of −α3.7 homozygotes and heterozygotes identified in the SGP cohort are shown at right. (B) Agarose gel fractionation of multiplex PCR products show wild-type α globin and −α3.7 alleles.31 We analyzed the genotypes of 75 randomly chosen samples by PCR (indicated at the bottom of the panel) to validate WGS calls for heterozygous or homozygous −α3.7. (C) Discrepancy between clinical assignments and genetic determinations of HbSS and HbSβ0 thalassemia genotypes in the SGP cohort. The first 2 pie charts show the WGS-derived genotypes of individuals who were previously assigned clinical diagnoses of HbSS or HbSβ0-thalassemia. The third pie chart shows the α-thalassemia status of 18 individuals in whom HbSβ0-thalassemia was incorrectly diagnosed.
Characterization of α- and β-thalassemia alleles in the SGP cohort. (A) The extended α-globin locus on chromosome 16. The α-globin genes HBA1 and HBA2 are indicated on top. X1 and X2, Y1 and Y2, and Z1 and Z2 represent duplicated regions with high sequence similarity where unequal crossing over generates gene deletions. The α-thalassemia deletion −α3.7 was identified by reduced density of sequencing reads within the indicated assembled contig. The number and percentage of −α3.7 homozygotes and heterozygotes identified in the SGP cohort are shown at right. (B) Agarose gel fractionation of multiplex PCR products show wild-type α globin and −α3.7 alleles.31 We analyzed the genotypes of 75 randomly chosen samples by PCR (indicated at the bottom of the panel) to validate WGS calls for heterozygous or homozygous −α3.7. (C) Discrepancy between clinical assignments and genetic determinations of HbSS and HbSβ0 thalassemia genotypes in the SGP cohort. The first 2 pie charts show the WGS-derived genotypes of individuals who were previously assigned clinical diagnoses of HbSS or HbSβ0-thalassemia. The third pie chart shows the α-thalassemia status of 18 individuals in whom HbSβ0-thalassemia was incorrectly diagnosed.
Demographic characteristics and sickle cell disease genotypes of all participants enrolled in the SGP WGS study (N = 722)
| Variable | Total (N = 722) | SCCRIP (N = 372) | BCM (N = 350) | P |
|---|---|---|---|---|
| Sex, N (%) | .43 | |||
| Male | 378 (52.35) | 193(51.88) | 185 (52.89) | |
| Female | 344 (47.65) | 179 (48.12) | 165 (47.14) | |
| Age (y),* (Mean, SD) | 6.06 (5.11) | 5.54 (4.50) | 6.63 (4.27) | .0009 |
| −α3.7 deletion | .99 | |||
| αα/αα (N, %) | 492 (68.14) | 253 (68.01) | 239 (68.29) | |
| −α3.7α/αα (N, %) | 200 (27.70) | 103 (27.69) | 97 (27.71) | |
| −α3.7α/−α3.7α (N, %) | 30 (4.16) | 16 (4.30) | 14 (4.00) | |
| Genotype (clinical), N (%)† | .0069 | |||
| HbSS | 684 (94.74) | 344 (92.47) | 340 (97.14) | |
| HbSβ0-thalassemia | 38 (5.26) | 28 (7.53) | 10 (2.86) | |
| Genotype (WGS), N (%)‡ | .35 | |||
| HbSS | 698 (96.7) | 359 (96.5) | 339 (96.9) | |
| HbSβ0-thalassemia | 23 (0.03) | 13 (3.5) | 10 (2.9) | |
| HbSβ+-thalassemia | 1 (0.001) | 0 (0) | 1 (0.3) |
P values for comparisons between SCCRIP and BCM participants for sex and genotype were determined by Fisher’s exact tests. P value for age was determined by Student t test. Significant P values (P < .05) are bold.
Age at which blood counts, erythroid indices, and HbF were recorded for this study (see supplemental Table 1).
Genotype obtained from the medical record.
Genotype determined by WGS in this study. Of 684 individuals with a clinical diagnosis of HbSS, 4 were found by WGS to have HbSβ0-thalassemia (3 with splice acceptor mutation HBB c.316-2A>G, and 1 with the Filipino β-thalassemia deletion). Of 38 individuals with a clinical diagnosis of HbSβ0-thalassemia, 18 were found by WGS to have HbSS and 1 had HbSβ+-thalassemia (Figure 2C; supplemental Figure 2).
SCCRIP and SAC participants analyzed for genetic associations with acute VOP
| Variable | SCCRIP (N = 327) | SAC (N = 175) | P | SCCRIP | ||
|---|---|---|---|---|---|---|
| Female (N = 159) | Male (N = 168) | P | ||||
| Sex | .85 | ND | ||||
| Female (N, %) | 159 (48.6) | 83 (47.4) | 159 (100) | 0 (0) | ||
| Male (N, %) | 168 (51.4) | 92 (52.6) | 0 (0) | 168 (100) | ||
| On HU therapy* | <.0001 | .51 | ||||
| Never (N, %) | 185 (56.6) | 148 (84.6) | 93 (58.5) | 92 (54.8) | ||
| Ever (N, %) | 142 (43.4) | 27 (15.4) | 66 (41.5) | 76 (45.2) | ||
| HU initiation age (y) (mean, SD) | 2.7 (1.5) | 8.3 (1.6) | <.0001 | 2.6 (1.6) | 2.8 (1.3) | .17 |
| Time on HU (mean, SD) | 2.8 (1.3) | 2.3 (1.6) | .08 | 2.8 (1.5) | 2.8 (1.1) | .86 |
| On chronic transfusion therapy* | ND | .04 | ||||
| Never (N, %) | 281 (85.9) | ND | 130 (81.8) | 151 (89.9) | ||
| Ever (N, %) | 46 (14.1) | ND | 29 (18.2) | 17 (10.1) | ||
| −α3.7 deletion | .35† | |||||
| αα/αα (N, %) | 219 (67.0) | ND | 111 (69.8) | 108 (64.3) | ||
| −α3.7α/αα (N, %) | 95 (29.0) | ND | 38 (23.9) | 57 (33.9) | ||
| −α3.7α/−α3.7α (N, %) | 13 (4.0) | ND | 10 (6.3) | 3 (1.8) | ||
| Genotypes determined by WGS | .24 | .22 | ||||
| HbSS (N, %) | 316 (96.6) | 165 (94.3) | 156 (98.1) | 160 (95.2) | ||
| HbSβ0 thalassemia (N, %) | 11 (3.4) | 10 (5.7) | 3 (1.9) | 8 (4.8) | ||
| Age in years‡ (mean, SD) | 5.8 (0.7) | 10.8 (0.7) | <.0001 | 5.8 (0.7) | 5.8 (0.6) | .82 |
| VOP event rate (events/100 person-years, %) | 12.5 (26.3) | 53.2 (56.6) | <.0001 | 11.2 (22.8) | 13.7 (29.3) | .81 |
P values in bold represent statistically significant associations (P < .05). Fisher’s exact test was used to compare sex, HU therapy, chronic transfusion therapy, the −α3.7 deletion, and SCD genotype between SCCRIP and SAC participants and between male and female participants in the SCCRIP cohort. The Wilcoxon rank-sum test was used to compare HU initiation age, time on HU, age in years, and VOP event rate between the 2 groups, as listed above. HU, hydroxyurea; ND, not determined; SD, standard deviation.
Hydroxyurea therapy or chronic transfusion therapy administered at any time up to 6 years of age for SCCRIP participants or up to 11 years of age for SAC participants.
P value was calculated based on a 2 × 2 contingency table of the number of participants with αα/αα vs −α3.7α/αα or −α3.7α/−α3.7α.
Age at last follow-up or censored at 6 years of age for SCCRIP participants or at 11 years of age for SAC participants.
WGS, mapping, quality control, single-nucleotide variant/indel calling, globin gene analysis, and genetic association studies of RBC %HbF are described in supplemental Methods.
Acute VOP phenotypes
We defined acute VOP events as visits to a health care facility that resulted in parenteral analgesics being administered. We examined VOP associations with α-thalassemia (−α3.7), %HbF, 11 SNPs in 3 gene regions associated with RBC %HbF (BCL11A, HBS1L-MYB, and the β-like globin gene cluster), and 122 additional SNPs in 62 genes associated with pain caused by SCD and/or other etiologies (pain SNPs) in a 6-year longitudinal study (supplemental Methods). We set participant ages as 1, 2, 3, 4, 5, and 6 years and extracted VOP events, exposure to hydroxyurea (yes/no), chronic RBC transfusions (yes/no), and the %HbF determined each year. The observational period was censored at 6 years of age or at last follow-up for participants younger than 6 years.
Genetic associations with longitudinal VOP events in the SCCRIP cohort
We defined the VOP event rate as the yearly frequency of VOP events and VOP event occurrence as the binary outcome of VOP events each year (yes/1 for ≥1; no/0 for none). Both analyses were adjusted for age, sex (except for sex-stratified analyses), −α3.7 (except for its association with the VOP event rate and event occurrence), exposure to hydroxyurea (yes/no), interactions between genetic factors and age, and the first 5 principal components (PCs) to control for population stratification in African Americans who are of mixed genetic ancestry (ie, admixed).
We first performed association studies of longitudinal VOP event rate by using a generalized linear mixed model (GLMM) with a quasi-Poisson link function to control for overdispersion, after checking the count model for over or underfitting zeros and for overdispersion. Additive and dominant genotype models were evaluated. P < .05 indicated confirmatory associations between the VOP event rate and −α3.7, %HbF or 11 RBC %HbF–associated SNPs. We controlled the false discovery rate at 0.05 for analyzing associations between the VOP event rate and 122 pain SNPs (defined above). Representative SNPs prioritized internally within the SCCRIP cohort by the 2-stage iterative resampling (TSIR) approach (supplemental Methods)24,25 were used to define PGSs and COMT haplotypes (supplemental Methods), which were then analyzed for associations with VOP event rate.
We performed association studies of VOP event occurrence by using the GLMM with a binomial link function. Models incorporating %HbF and PGSs were compared with each other and to a basic model by analysis of deviance, with differences following χ2 distribution with degrees of freedom corresponding to the difference in the number of degrees of freedom of the 2 models. Genetic associations with VOP events identified in the SCCRIP cohort were partially validated in the SAC23 by using the same approaches as for the SCCRIP cohort (supplemental Methods).
Results
Comparisons of the SCCRIP and BCM cohorts
The genome-wide average sequencing coverage and ancestry relations were similar between the cohorts (supplemental Figure 1A-B). Compared with the BCM participants, a higher proportion of the SCCRIP participants had a clinical diagnosis of HbSβ0-thalassemia; this difference was eliminated after correction of the genotypes by WGS (Table 1).
Among the 585 SGP participants older than 2 years who were examined for genetic associations with steady-state %HbF (Figure 1; supplemental Table 1), those from the SCCRIP cohort with HbSS were younger and exhibited significantly lower RBC and reticulocyte counts and greater mean corpuscular volume compared with BCM participants. The same relation between these RBC indices and younger age was observed in the Cooperative Study of Sickle Cell Disease (CSSCD) cohort.26 Hemoglobin A was detected in 102 individuals, 94 (92%) of whom were reported to have received a blood transfusion within the past 90 days. Eight individuals in whom HbA was detected with no report of a recent transfusion presumably received a transfusion that was undocumented or administered more than 90 days earlier. Individuals in the BCM cohort received more transfusions than did those in the SCCRIP cohort and had higher HbA levels.
Detection of thalassemia alleles by WGS
Coinherited thalassemia alleles influence multiple SCD morbidities by reducing HbS polymerization in RBCs5,9,27,28 and therefore must be considered as covariables in most phenotype association studies. The CSSCD study showed that by 6 months of age, SS infants with α-thalassemia had mean hemoglobin concentrations 0.5 g/dL higher than those without α-thalassemia.26 The most common α-thalassemia allele, a 3.7-kb deletion (−α3.7) that arose by recombination between duplicated HBA1 and HBA2 genes,29,30 is not detected by SNP microarrays and is difficult to identify by conventional WGS because of problems with mapping short sequence reads to the duplicated regions and uneven coverage. We detected −α3.7 from WGS data by combining coverage reduction and local de novo assembly (Figure 2A) and verified the method against multiplex polymerase chain reaction (PCR) analysis31 (Figure 2B). The −α3.7 allele was in Hardy–Weinberg equilibrium with a frequency of 18.0%, similar to the findings in another SCD cohort.32
Of 684 participants identified in the medical records as having HbSS, 4 (0.6%) were found by WGS to have HbSβ0-thalassemia (Table 1; Figure 2C; supplemental Figure 2). Of 38 participants who received a clinical diagnosis of HbSβ0-thalassemia based on interpretations of laboratory parameters such as low mean corpuscular volume and elevated %HbA2, the diagnosis was confirmed by WGS in only 19. The remainder had HbSS (n = 18) or HbSβ+-thalassemia (c.−79A>G, n = 1). Of the 18 participants in whom HbSS was incorrectly diagnosed as HbSβ0-thalassemia, 5 were homozygous for −α3.7, representing a 7.9-fold enrichment compared with individuals correctly identified as having HbSS (P < 5.1 × 10⁻⁴).
Genetic modifiers of RBC %HbF
Postnatal HbF expression attenuates SCD morbidities33,34 and is regulated by noncoding variants in BCL11A, the HBS1L–MYB intergenic region, and the β-like globin gene cluster.5,8,20,35,36 We verified these results in 585 participants (supplemental Results; supplemental Tables 1-3; supplemental Figures 3-7); developed HbF PGSs for BCL11A (3 SNPs), HBS1L–MYB (4 SNPs), and the β-like globin gene cluster (4 SNPs); and then combined them into a single PGSHbF (supplemental Methods). The largest estimated contribution to HbF variability, reflected by the generalized R2 (gR2), was from PGSBCL11A (gR2, 20.3%), followed by PGSHBS1L-MYB (gR2, 7.3%) and PGSβ-like (gR2, 2.9%). The PGSHbF integrating the 3 loci accounts for 30.5% of HbF variance, which is similar to the findings in other SCD cohorts.37 We detected no significant associations between %HbF and rare coding region variants in the candidate genes BCL11A, MYB, KLF1,38 or NIFIX39 (supplemental Results).
RBC %HbF and %HbF modifier alleles are associated with the VOP event rate
Longitudinally assessed VOP measurements were available for association studies in 327 of 372 SCCRIP participants with HbSS or HbSβ0-thalassemia (Figure 1; Table 2). We had insufficient power to compare VOP event rate and occurrence between patients with HbSS and those with HbSβ0-thalassemia, and no difference was observed in a prior study.40 Therefore, we combined the genotypes for both groups of participants for the current analysis. Most participants (91.4%-81%) had no VOP events across each year of life, whereas 5.2% to 8.8% had 1 VOP event per year. Approximately 2% and 1% had 2 or >2 VOP events per year, respectively (Figure 3A). The percentage of children on hydroxyurea therapy increased with age (Figure 3B), and hydroxyurea therapy was associated with reduced VOP event rate (estimate, −0.54; standard error [SE], 0.15; P = .0003). Chronic transfusion was not associated with VOP event rate, possibly because only 46 of 327 participants (14.1%) received this therapy. Age was not associated with VOP event rate, possibly because of the young age of participants and their having received hydroxyurea therapy.

Association studies of polygenic scores with %HbF and acute VOP event rate in the SCCRIP cohort. (A) The number of participants (N) experiencing 0, 1, 2, or >2 VOP events according to age. There are in total 1897 data points. (B) The proportion of participants treated with hydroxyurea (HU) therapy by age. (C) Fetal hemoglobin levels (%HbF) of participants according to PGSHbF and age in years. The PGS score on the x axis shows the number of unfavorable (low HbF–associated) alleles carried by each individual, with 0, 1, or 2 alleles being possible for each SNP. Accordingly, for the 11-SNP PGSHbF, the potential PGS for an individual can range from 0 to 22. The lines denote the smoothed mean values with the lower and upper shaded areas indicating the 95% confidence intervals. P values were calculated by a Wald test to test the association between %HbF and PGSHbF (estimate, −0.15; standard error, 0.09), using generalized estimating equations that accounted for the correlation between %HbF measurements on the same participants after adjusting for sex, 5 PCs, −α3.7 deletion, exposure to HU, chronic transfusion therapy, and nonlinear (quadratic and cubic) terms of age. (D) Association of VOP event rate with the polygenic scores defined in Table 3. The scatterplots show the estimated VOP event rate (y axis) according to each PGS model. Each symbol represents an estimated value of the VOP event rate, with the fitted linear regression line being shown for each PGS. P values were calculated based on a GLMM to test for associations between VOP event rate and the indicated PGS, which was analyzed as a continuous variable, adjusting for the same covariates listed in Table 3. Est, β estimate; SE, standard error. (E) The distribution of participants with respect to the 21-SNP PGSHbF+COMT+5snps. (F) Boxplots of the estimated VOP event rate (y axis) according to the 3 strata of PGSHbF+COMT+5snps: bottom 5% (<19, n = 16), middle group (19-30, n = 290), and top 5% (≥30, n = 19). P values were calculated as described for Table 3. (G) The distribution of exposure to HU therapy (y axis) with respect to the 3 strata of PGSHbF+COMT+5snps. P values were calculated based on the GLMM with a binomial link function, with exposure to HU therapy as a dependent variable and the 3 strata as independent variables, adjusted for the same covariates described in Table 3 except for exposure to HU therapy.
Association studies of polygenic scores with %HbF and acute VOP event rate in the SCCRIP cohort. (A) The number of participants (N) experiencing 0, 1, 2, or >2 VOP events according to age. There are in total 1897 data points. (B) The proportion of participants treated with hydroxyurea (HU) therapy by age. (C) Fetal hemoglobin levels (%HbF) of participants according to PGSHbF and age in years. The PGS score on the x axis shows the number of unfavorable (low HbF–associated) alleles carried by each individual, with 0, 1, or 2 alleles being possible for each SNP. Accordingly, for the 11-SNP PGSHbF, the potential PGS for an individual can range from 0 to 22. The lines denote the smoothed mean values with the lower and upper shaded areas indicating the 95% confidence intervals. P values were calculated by a Wald test to test the association between %HbF and PGSHbF (estimate, −0.15; standard error, 0.09), using generalized estimating equations that accounted for the correlation between %HbF measurements on the same participants after adjusting for sex, 5 PCs, −α3.7 deletion, exposure to HU, chronic transfusion therapy, and nonlinear (quadratic and cubic) terms of age. (D) Association of VOP event rate with the polygenic scores defined in Table 3. The scatterplots show the estimated VOP event rate (y axis) according to each PGS model. Each symbol represents an estimated value of the VOP event rate, with the fitted linear regression line being shown for each PGS. P values were calculated based on a GLMM to test for associations between VOP event rate and the indicated PGS, which was analyzed as a continuous variable, adjusting for the same covariates listed in Table 3. Est, β estimate; SE, standard error. (E) The distribution of participants with respect to the 21-SNP PGSHbF+COMT+5snps. (F) Boxplots of the estimated VOP event rate (y axis) according to the 3 strata of PGSHbF+COMT+5snps: bottom 5% (<19, n = 16), middle group (19-30, n = 290), and top 5% (≥30, n = 19). P values were calculated as described for Table 3. (G) The distribution of exposure to HU therapy (y axis) with respect to the 3 strata of PGSHbF+COMT+5snps. P values were calculated based on the GLMM with a binomial link function, with exposure to HU therapy as a dependent variable and the 3 strata as independent variables, adjusted for the same covariates described in Table 3 except for exposure to HU therapy.
Participants in the SAC23 validation cohort were older than those in the SCCRIP cohort, and age was positively associated with VOP event rate (estimate, 0.06; SE, 0.01; P < .0001; Table 2). Hydroxyurea therapy was not associated with VOP event rate, although few participants (15.4%) were on hydroxyurea therapy. Sex was not associated with VOP event rate but was included as a covariate by convention.20 The average VOP event rate was significantly higher in the SAC than in the SCCRIP cohort (P < .0001), possibly because fewer SAC participants were on hydroxyurea therapy and/or because they were older. Our study design had 94% and 48% power to discover an association between a SNP and the longitudinal VOP event rate in 327 SCCRIP participants at levels of .05 and .0004, respectively, and 95% power to discover such an association in 175 SAC participants at a level of .05 for replication (supplemental Figure 8).
Previous studies have demonstrated associations between VOP event rate and −α3.7, RBC %HbF, and HbF modifier SNPs.9,18,20,41–43 The −α3.7 variant was not associated with the VOP event rate in the SCRRIP participants (estimate, 0.29; SE, 0.23; P = .22; supplemental Table 4) but was included as a covariate because of published associations in previous studies, including the CSSCD cohort.41 The −α3.7 genotypes for the SAC were unavailable. In the SCCRIP cohort, high %HbF was associated with smaller VOP event rate (Table 3). The 11-SNP PGSHbF was more strongly associated with the VOP event rate than any individual SNP. As expected, the PGSHbF was also associated with longitudinal %HbF (supplemental Methods; Figure 3C). The full 11-SNP PGSHbF could not be examined in the SAC because of missing data, but a 5-SNP PGSHbF was associated with the VOP event rate.
Associations of %HbF and PGSs with VOP event rate and occurrence in the SCCRIP and the SAC participants
| SCCRIP | SAC (censored at 11 y) | |||||
|---|---|---|---|---|---|---|
| EST | SE | P | EST | SE | P | |
| VOP event rate | ||||||
| %HbF* | −0.18 | 0.05 | 4.7 × 10⁻⁴ | ND | ND | ND |
| PGSHbF | 0.27 | 0.07 | 1.2 × 10⁻⁴ | 0.11 | 0.07 | .045 |
| PGSCOMT | 0.29 | 0.06 | 2.7 × 10⁻⁵ | 0.07 | 0.04 | .04 |
| PGS5snps | 0.60 | 0.09 | 5.8 × 10⁻¹⁰ | ND | ND | ND |
| PGSHbF+COMT | 0.27 | 0.05 | 3.9 × 10⁻⁸ | 0.1 | 0.04 | .06 |
| PGSHbF+COMT+5snps | 0.35 | 0.04 | 5.9 × 10⁻¹⁴ | ND | ND | ND |
| VOP event occurrence | ||||||
| %HbF* | −0.22 | 0.07 | 7.5 × 10⁻⁴ | ND | ND | ND |
| PGSHbF | 0.33 | 0.08 | 8.8 × 10⁻⁵ | 0.19 | 0.09 | .014 |
| PGSCOMT | 0.29 | 0.08 | 2.0 × 10⁻⁴ | 0.07 | 0.04 | .055 |
| PGS5snps | 0.73 | 0.12 | 3.2 × 10⁻⁹ | ND | ND | ND |
| PGSHbF+COMT | 0.32 | 0.06 | 1.0 × 10⁻⁷ | 0.08 | 0.05 | .065 |
| PGSHbF+COMT+5snps | 0.42 | 0.06 | 4.1 × 10⁻¹³ | ND | ND | ND |
PGSHbF, sum of low HbF–associated alleles across 11 SNPs in BCL11A, HBS1L-MYB, and the extended β-globin locus (supplemental Methods); PGSCOMT, sum of high pain risk alleles across 5 COMT SNPs: rs6269, rs4633, rs4818, rs4680, and rs165599; PGS5snps, sum of high pain risk alleles across 5 additional pain-related SNPs: rs6858735 (TBC1D1), rs2835914 (KCNJ6), rs2295632 (FAAH), rs2963155 (NR3C1), and rs1800587 (IL1A); PGSHbF+COMT+5snps, PGSHbF + PGSCOMT + PGS5snps. The PGSs were analyzed as continuous variables. Covariates for the SCCRIP analysis included sex, hydroxyurea therapy, 5 PCs, −α3.7, and PGS–age interaction (except for %HbF). The −α3.7 status was not available for the SAC. PGSCOMT–age interaction was not included in the SAC analysis because the Bayesian information criterion for the model with PGSCOMT–age interaction was higher. P values for the SCCRIP and SAC studies were determined by the Wald test calculated from a generalized linear mixed model. P values for the SAC validation cohort were 1-sided. Bold P values indicated significant associations (P < .05). EST, β estimates; ND, not determined; SE, standard error.
A total of 1095 longitudinal RBC %HbF values were available for 284 of 327 SCCRIP participants analyzed for VOP event rate and event occurrence.
Multiple pain-related variants are associated with the VOP event rate in children with SCD
We extended our analyses of the SCCRIP participants to an additional 122 candidate pain SNPs in 62 genes (supplemental Table 5). After controlling for the false discovery rate at 0.05, 12 SNPs mapping to 9 genes were significantly associated with the VOP event rate. Of these, 9 SNPs mapping to 6 genes were validated internally within the SCCRIP cohort by TSIR analysis (supplemental Table 6). Of these, COMT (catechol-O-methyltransferase), NR3C1 (nuclear receptor subfamily 3, group C, member 1, the glucocorticoid receptor), TBC1D1 (TBC1 member 1 domain family member 1), and IL1A (interleukin-1α) have been associated with SCD VOP.15–19 The KCNJ6 (potassium inwardly rectifying channel subfamily J member 6) and FAAH 9 (fatty acid amide hydrolase) SNPs have not been associated previously with SCD VOP.
The “pain gene” most strongly associated with VOP in the SCCRIP participants was COMT, which encodes an enzyme that degrades catecholamines and has been linked to numerous pain syndromes.44 Self-reported pain in adults with SCD has been linked to a single COMT SNP (rs4680, Val158Met)16 and to a 5-SNP COMT haplotype (rs6269-rs4633-rs4818-rs4680-rs165599) in the Walk-PhaSST study.19 After further adjusting for PGSHbF and its interaction with age, all 5 SNPs, which are only partially linked and are thought to influence pain independently,19,45 were associated with the VOP event rate in the SCCRIP participants. These 5 SNPs were incorporated into a PGSCOMT (Table 3; supplemental Table 7). In the SAC, rs4633 was associated with the VOP event rate (supplemental Table 7; supplemental Figure 9). In sex-stratified analyses of the SCCRIP cohort, COMT SNPs were significant only in female participants (supplemental Table 8). However, significant associations were found in male participants after adjusting for the genotype−age interaction (supplemental Table 8); this contrasts with the findings of other studies in which COMT SNPs were associated with pain in female participants only.46 Specific COMT haplotypes are better associated with pain sensitivity than are individual SNPs.46 We validated the VOP-associated COMT haplotypes identified in Walk-PhaSST within the SCCRIP cohort and discovered several new ones (supplemental Results).
A multilocus PGS for VOP event rate and event occurrence in SCD
We analyzed unweighted PGSs for VOP to assess the combined effects of individual SNPs across multiple loci. We did not include the −α3.7 variant in the PGS calculation because it was not significant by itself in SCCRIP. In the SCCRIP cohort, the 5-SNP COMT PGSCOMT was more strongly associated with the VOP event rate than any individual COMT SNP for the additive model (Table 3; supplemental Table 6). Moreover, the PGSHbF+COMT was more strongly associated with the VOP event rate than either PGS alone (Table 3). In the SAC, the 5-SNP PGSHbF and PGSCOMT were also associated with the VOP event rate (Table 3; supplemental Table 7). The results in the SCCRIP cohort were similar when we tested the association of the PGSs with VOP event occurrence (defined in Methods; Table 3). The PGSHbF association with VOP event occurrence was validated in the SAC.
A full PGS integrating these 5 pain SNPs, PGSCOMT, and PGSHbF (PGSHbF+COMT+5snps) exhibited stronger association with the VOP event rate and occurrence than any component PGS or individual SNP (Table 3; Figure 3D). The PGSHbF+COMT+5snps model could not be validated in the SAC because the 5 pain SNPs were not available. In TSIR analysis of the SCCRIP cohort, the associations of PGSHbF+COMT+5snps with VOP event rate and occurrence were discovered and replicated in ≥99 repetitions. The largest estimated contribution to VOP event rate variability in the SCCRIP cohort was from PGS5snps (gR2, 1.4%; 95% confidence interval [CI], 0.5%-2.6%), followed by PGSCOMT (gR2, 0.7%; 95% CI, 0.2%-1.7%) and PGSHbF (gR2, 0.5%; 95% CI, 0.1%-1.4%). The gR2 for %HbF was 0.8% (95% CI, 0.1%-2.2%), slightly larger than that for PGSHbF, which accounts for approximately 30% of variance in HbF levels. The 21-SNP PGSHbF+COMT+5snps accounted for 2.3% (95% CI, 1.1%-3.8%) of the VOP event rate variance. Together, the basic model (age, sex, −α3.7, hydroxyurea therapy, and 5 PCs) plus PGSHbF+COMT+5snps accounted for 3.5% (95% CI, 2.5%-5.8%) of the VOP event rate variance. In the SAC, PGSCOMT and 5-SNP PGSHbF explained 0.6% (95% CI, 0.1%-1.5%) and 0.2% (95% CI, 0.0%-0.8%) of variance in the VOP event rate, respectively. Together, the basic model (age, sex, hydroxyurea therapy, and 5 PCs) plus a PGSHbF+COMT accounted for 4.4% (95% CI, 3.1%-6.9%) of variance in the VOP event rate in the SAC. These generalized R2 values must be interpreted cautiously because of the small sample size.
As noted, hydroxyurea therapy was associated with a reduced VOP event rate in the SCCRIP cohort. However, children with the 5% highest PGSHbF+COMT+5snps score (≥30, n = 19) had a threefold greater VOP event rate compared with children with the 5% lowest PGSHbF+COMT+5snps score (<19, n = 16; median, 0.06 vs 0.02; P = 9.0 × 10⁻⁶; Figure 3E-F), yet they were almost 5 times more likely to be on hydroxyurea therapy (36% vs 8%, P = 5.7 × 10⁻⁶; Figure 3G). These latter 2 findings were also replicated in 35 of 100 and 51 of 100 rounds of resampling, respectively, by TSIR analysis, which successfully passed the cutoff of discovering and replicating associations in at least 20 of 100 rounds of resampling.
To formally examine the improvement gained from incorporating %HbF and each PGS, we compared nested joint models for VOP event occurrence in the SCCRIP cohort (Table 4). Incorporating longitudinal %HbF improved the basic model for VOP event occurrence. Incorporating the SNP-based PGSHbF improved the basic model in the SCCRIP cohort and the SAC, validating the results of a previous study.20 Adding %HbF improved the PGSHbF genetic model, which is consistent with findings that the 11-SNP PGSHbF, accounts for only 30% of %HbF variance (see Discussion). In contrast, adding PGSHbF did not improve the %HbF model, suggesting that HbF-associated SNPs provide no information on VOP beyond their effect on the yearly measurements of %HbF. Adding PGSCOMT improved the basic model significantly for the SCCRIP cohort but not for the SAC, although adding PGSHbF and PGSCOMT together improved the model further for both cohorts. Finally, adding the contributions of 5 additional pain SNPs (PGSHbF+COMT+5snps) further improved the PGSHbF+COMT model for the SCCRIP cohort (P = 2.7 × 10⁻⁶). This finding was replicated in 83 of 100 rounds of resampling by TSIR analysis.
Red blood cell %HbF and PGS associations with longitudinal VOP event occurrence in SCCRIP and SAC participants
| SAC | |||||||
|---|---|---|---|---|---|---|---|
| SCCRIP | Censored at 11 y | Censored at 14 y | |||||
| Model description | Comparison model | χ2(df) | P | χ2(df) | P | χ2(df) | P |
| Basic model: VOP = sex + age + 5 PCs + HU + −α3.7 | NA | NA | NA | NA | NA | NA | NA |
| %HbF model*: VOP = basic model + %HbF | vs basic model | 8.58 (1) | .0034 | ND | ND | ND | ND |
| HbF SNP model: VOP = basic model + (PGSHbF+ PGSHbF × age) | vs basic model | 9.91 (2) | .007 | 5.5 (2) | .06 | 6.9 (2) | .03 |
| %HbF and HbF SNP model*: VOP = HbF SNP model + %HbF | vs %HbF model vs HbF SNP model | 3.33 (2) 7.94 (1) | .19 .005 | ND | ND | ND | ND |
| COMT model: VOP = basic model + PGSCOMT | vs basic model | 6.68 (1) | .0098 | 2.6 (1) | .11 | 2.6 (1) | .11 |
| HbF SNP and COMT model: VOP = HbF SNP model + PGSCOMT | vs basic model | 16.71 (3) | .0008 | 8.1 (3) | .045 | 9.5 (3) | .02 |
| vs HbF SNP model | 6.80 (1) | .009 | 2.6 (1) | .11 | 2.6 (1) | .11 | |
| vs COMT model | 10.04 (2) | .007 | 5.5 (2) | .06 | 6.9 (2) | .03 | |
| Full model: VOP = HbF SNP and COMT model + PGS5snps + PGS5snps × age | vs HbF SNP model vs HbF SNP and COMT model | 32.45 (3) 25.65 (2) | 4.2 × 10⁻⁷ 2.7 × 10⁻⁶ | ND ND | ND ND | ND ND | ND ND |
The PGSs are defined in Table 3. χ2 values were calculated by subtracting the deviance of the larger model with more independent variables from that of the smaller model and were used to calculate P values. The −α3.7 status was not available for the SAC cohort. df, degree of freedom; ND, not determined. NA, not applicable.
A total of 1095 longitudinal RBC %HbF values were available for 284 of 327 SCCRIP participants analyzed for VOP event occurrence. These %HbF data were used in the %HbF model and the %HbF + HbF SNP model.
Discussion
By using WGS data to analyze an SCD cohort, we assigned correct SCD genotypes, ascertained concomitant α-thalassemia, verified previous HbF modifier alleles, and then interrogated 134 candidate alleles for associations with acute VOP. A 21-SNP, 9-locus PGS, which included 2 genes not previously linked to SCD pain, was more strongly associated with acute VOP than any individual variant. HbF and associated modifier alleles ameliorate VOP events by inhibiting HbS polymerization, a proximal event in SCD pathophysiology. The 6 pain genes associated with VOP in this study act more distally and encode proteins with diverse functions, including an enzyme that degrades catecholamines (COMT),47 an inflammatory cytokine (IL1α),48 a membrane hydrolase that degrades bioactive lipids (FAAH),49 a RabGAP signaling factor that regulates skeletal muscle glucose transport (TBC1D1),50 the glucocorticoid nuclear receptor (NR3C1),49 and a potassium channel (KCNJ6).51 Evaluation of the COMT gene, which modulates the perception of many types of pain via multiple variants acting through different mechanisms,52 identified new haplotypes and genetic effects in SCD. Our findings provide new insights into the complex physiology of SCD-related pain, which is regulated by SCD-specific and generalized pain-related variables.
The PGSHbF+COMT+5snps combined with the basic model accounted for an estimated 3.5% of VOP event rate variance. This illustrates the complexity of VOC pain and is consistent with findings that even genome-wide PGSs capture relatively small proportions of variance for many complex phenotypes.53–55 Nevertheless, our findings might have clinical utility if they can be validated externally. For example, individuals with a PGSHbF+COMT+5snps in the top 5% exhibited a threefold higher VOP event rate (P = 9.0 × 10⁻⁶), yet they were 5 times more likely to be on hydroxyurea compared with participants with a score in the bottom 5% (P = 5.7 × 10⁻⁶). Therefore, a high pain PGS might indicate those individuals who are most likely to benefit from a second SCD-modifying therapy to be given in combination with hydroxyurea. Moreover, as the acute VOP rate is a common endpoint in therapeutic clinical trials,56–58 it might be informative to incorporate a pain PGS as a covariate in such studies.
Most genetic association studies for SCD phenotypes have identified single candidate alleles by using SNP arrays or WES. However, most phenotypes are regulated by many SNPs with small individual effects.53,59 As a single test for developing comprehensive PGSs, WGS is superior to SNP arrays or WES for several reasons. First, WGS facilitates the identification of common thalassemia structural variants, which must be considered as covariates for many SCD-related phenotypes. We identified the high-frequency α-thalassemia allele −α3.7 from WGS and confirmed that an accurate diagnosis of HbSβ0-thalassemia requires genetic testing and cannot be inferred from abnormal RBC indices.60 Although −α3.7 did not associate with acute VOP in this study, it has been linked to VOP in other SCD cohorts.9,41–43 Second, it is not possible to interrogate all SNPs with microarrays, and it is challenging to infer SNP genotypes by imputation in African Americans with SCD because of admixture and insufficient DNA reference panels.61 Consequently, we were unable to evaluate numerous VOP-associated SNPs from the available microarray analysis of the SAC. Third, WGS is likely to be cost effective for centers with appropriate bioinformatic and data storage capabilities. Remarkably, the cost of WGS is similar to that of globin gene analysis, which cannot be ascertained easily from SNP or WES data. As a 1-time test, WGS provides a comprehensive dataset of genetic variation for association studies in SCD. The utility of WGS is likely to improve over time as costs decline further and new technologies emerge. For example, long-read DNA sequencing should facilitate further the identification of structural variants and enable genome phasing to better define SNP interactions within haplotype blocks.
Baseline RBC %HbF, a powerful modifier of SCD phenotypes, is regulated largely by genetic variation.62 Variants in BCL11A, HBS1L-MYB, and the β-like globin gene cluster account for 30% of HbF variance.37 We verified these findings and found no other significant associations by GWASs or gene-based testing of candidate loci, indicating that unexplained %HbF heritability is regulated by many variants with modest individual effects. Because approximately 70% of heritability is not accounted for by the 11-SNP PGSHbF, directly measured %HbF should associate more significantly with SCD phenotypes. Accordingly, incorporating %HbF measurements into our study improved a pain model that included PGSHbF, whereas the converse was not true (Table 4). These findings contrast with an analysis of CSSCD data showing that %HbF-associated SNPs provide additional information on the VOP rate beyond the baseline %HbF.20 A potential explanation for this difference is that our study used serial measurements of %HbF over 6 years, whereas the CSSCD study used only a single steady-state measurement. The %HbF can vary according to age, receipt of hydroxyurea therapy, and random factors.63 Moreover, %HbF data are not always available. Complete 6-year longitudinal %HbF data were available for only 17% of individuals in the SCCRIP cohort and for none of the SAC participants. Genetic variants that regulate %HbF throughout the lifespan can be derived from WGS performed just once. Therefore, SNPs that associate with %HbF provide information for evaluating SCD phenotypes that it is not practical or feasible to obtain via serial %HbF determinations, particularly in children less than 5 years old who are undergoing a physiologic decline in γ-globin production. Similarly, a multi-SNP PGS accounting for a relatively small proportion of genetic variance in plasma lipid levels improved clinical risk classification beyond standard clinical factors, which included single baseline measurements of the lipid levels themselves.64
Our study has some caveats and limitations. First, the results were only partially validated in the SAC because of difficulties imputing some SNPs. We used TSIR to validate some genetic associations internally within the SCCRIP cohort. However, further external validation is required. Second, we modeled the exposure to hydroxyurea as a longitudinal binary covariate (yes/no) because dosages were not available for all participants. Third, defining VOP as “visits to a health care facility that resulted in parenteral analgesics being administered” may underestimate its incidence, as individuals experiencing pain do not always seek medical care. Fourth, our findings in young children with SCD might not apply entirely to VOP in adults, which is more often influenced by comorbidities, including depression.65 Continued longitudinal studies of the same SCCRIP participants described here should enable us to evaluate the genetics of pain susceptibility in SCD across the lifespan. Fifth, SCD-related VOP is also influenced by environmental factors,51 which must be considered in any integrated evaluation for VOP risk. Sixth, our relatively small cohort size necessitated the use of a candidate gene approach. Given the complex pathophysiology of SCD-related VOP, which is influenced by HbF expression, inflammation, and multiple neurotransmitter pathways in the central and peripheral nervous systems, it is likely that additional undiscovered modifier alleles exist.66,67 New gene discovery through unbiased GWASs will require larger, multicenter studies in which VOP data collection is harmonized. To this end, we have made our WGS data available through a cloud-based platform (https://sickle-cell.stjude.cloud).
Some genetic variants that predispose individuals to SCD morbidities also influence similar pathologies in the general population, as we have shown for pain-related genes in the current study. Other relevant examples include APOL1 (for kidney disease) and UGT1A1 (for hyperbilirubinemia and cholelithiasis).68–70 Ongoing studies are identifying new genetic modifiers and groups of modifiers compiled into PGSs for major organ disease in the general African American population, some of which may accelerate SCD morbidities.71–73 Examining these variants and PGSs systematically for their effects on SCD will be facilitated by the availability of WGS coupled with longitudinal phenotyping. In turn, defining SCD modifier genes before the onset of organ damage might identify those individuals who will benefit most from prospective targeted interventions.
Acknowledgments
The authors thank the participants enrolled in studies at St. Jude Children’s Research Hospital and Baylor College of Medicine; Keith A. Laycock, ELS, for scientific editing of the manuscript; and Vijay Sankaran, Laura Raffield, and David Ginsburg for comments on the manuscript.
Bioinformatics analysis in this study was supported in part by the National Institutes of Health National Cancer Institute under award P30 CA021765. This study was supported by the American Lebanese Syrian Associated Charities. The content is solely the responsibility of the authors and does not necessarily represent the official views of the National Institutes of Health.
Authorship
Contribution: E.R., G.K., G.W., L.E.P., S.W., W.B., J.D., S.R.R, R.J.B., T.-T.C., W.C, Y.C., M.R., Y.S., A.S., X.T., A.T., M.B., K.B., J.R.H., and E.S. performed data analyses; A.P.P., L.P., S.K.K., J.E., S.L., H.M., C.R., D.Y., and Y. Yao performed experiments; E.R., G.K., G.W., L.P., S.W., W.B., J.H.E., and M.J.W. interpreted the results; E.R.,G.K., L.P., S.R., G.W., and M.J.W drafted the manuscript; A.M.B., N.B., D.A., N.M.A., L.P., W.W., Y. Yasui, J.R.D., J.S.H., J.Z., M.D., W.W., V.A.S., J.R.D., and J.Z., provided critical review; and all authors approved the final version.
Conflict-of-interest disclosure: J.H.E. receives research support from Pfizer, Global Blood Therapeutics, Forma Therapeutics, and Eli Lilly and Co. and serves as a consultant for Daiichi Sankyo and Global Blood Therapeutics. J.R.H. receives research funds from Global Blood Therapeutics and consultant fees from MJ Life Science. M.D. receives research funding from Global Blood Therapeutics and consultant fees from Novartis. A.S. receives research support from Novartis and Vertex Pharmaceuticals/CRISPR Therapeutics. M.J.W. is a former advisor for Beam Therapeutics and holds equity and is on advisory boards for Cellarity Inc., Novartis, Forma Therapeutics, and Graphite Bio. The remaining authors declare no competing financial interests.
The current affiliation for E.R., T.-C.C., G.W., and W.C. is Center for Applied Bioinformatics, St. Jude Children's Research Hospital, Memphis, TN.
Correspondence: Mitchell J. Weiss, St. Jude Children’s Research Hospital 262 Danny Thomas Place, MS #355, Memphis, TN 38105; e-mail: mitch.weiss@stjude.org; and Gang Wu, St. Jude Children’s Research Hospital 262 Danny Thomas Hospital, MS #1135, Memphis, TN 38105; e-mail: gang.wu@stjude.org.

