

Key Points
Mitochondria migrate closely adjacent to the nucleus during erythroblast maturation and are critical for the enucleation process.
Low mitochondrial activity fueled by pyruvate, not in situ glycolysis, is key to the erythroblast enucleation process.

Abstract
Mammalian red blood cells (RBCs), which primarily contain hemoglobin, exemplify an elaborate maturation process, with the terminal steps of RBC generation involving extensive cellular remodeling. This encompasses alterations of cellular content through distinct stages of erythroblast maturation that result in the expulsion of the nucleus (enucleation) followed by the loss of mitochondria and all other organelles and a transition to anaerobic glycolysis. Whether there is any link between erythroid removal of the nucleus and the function of any other organelle, including mitochondria, remains unknown. Here we demonstrate that mitochondria are key to nuclear clearance. Using live and confocal microscopy and high-throughput single-cell imaging, we show that before nuclear polarization, mitochondria progressively move toward one side of maturing erythroblasts and aggregate near the nucleus as it extrudes from the cell, a prerequisite for enucleation to proceed. Although we found active mitochondrial respiration is required for nuclear expulsion, levels of mitochondrial activity identify distinct functional subpopulations, because terminally maturing erythroblasts with low relative to high mitochondrial membrane potential are at a later stage of maturation, contain greatly condensed nuclei with reduced open chromatin–associated acetylation histone marks, and exhibit higher enucleation rates. Lastly, to our surprise, we found that late-stage erythroblasts sustain mitochondrial metabolism and subsequent enucleation, primarily through pyruvate but independent of in situ glycolysis. These findings demonstrate the critical but unanticipated functions of mitochondria during the erythroblast enucleation process. They are also relevant to the in vitro production of RBCs as well as to disorders of the erythroid lineage.
Introduction
Large-scale production of red blood cells (RBCs) in vitro is a promising approach to overcoming the limited supplies available worldwide for blood transfusions and providing a safe alternative with reduced immunogenicity.1 Erythroid enucleation is a limiting step in RBC production in vitro. The low frequency (<10%) of erythroid enucleation has been an impediment to therapeutic-scale RBC production from embryonic and induced pluripotent stem cell sources in vitro.2 A detailed molecular understanding of the enucleation process may provide a means of improving the efficacy of RBC production in vitro from various sources.
The terminal steps of RBC maturation involve extensive alterations of cellular content through 5 erythroblast stages that result in hemoglobin accumulation, loss of all organelles, expulsion of the nucleus (enucleation), and transition to anaerobic glycolysis. During terminal maturation, erythroid precursor cells undergo chromatin condensation, nuclear polarization to one side of the cell followed by the formation of a contractile ring that ultimately triggers nuclear expulsion and generation of an enucleated reticulocyte.3-7 The reticulocyte begins maturation within the bone marrow and is subsequently released into the circulation to further mature into an RBC by clearing mitochondria and other organelles.4,8,9 The nature of communication between mitochondria and the nucleus, if any, during terminal erythroid cell maturation remains unknown.
We found that the transcriptional program of the nuclear and mitochondrial clearance is orchestrated by the same factor, FOXO3.10,11 This led us to explore whether there was any potential connection between these 2 organelles during erythroblast maturation. Our studies were motivated by several additional lines of evidence suggesting that mitochondria might be involved in the enucleation process: (1) until recently, mitochondrial removal was known to always follow and not precede the enucleation process12-14 ; (2) mitochondria remain healthy and stable in number until the nucleus is removed13 ; (3) processes similar to erythroblast enucleation, such as asymmetrical cytokinesis in polar body exclusion during oogenesis or nuclear polarization in migrating cells, require mitochondrial guidance and energy15-17 ; and (4) some of the key proteins implicated in the enucleation process seem to be involved in communication between the nucleus and mitochondria.18,19
Here we demonstrate that mitochondria are essential for the erythroid enucleation process. We first show through live and confocal as well as high-throughput single-cell imaging that during erythroblast maturation, mitochondria aggregate and locate closely adjacent to the nucleus before nuclear polarization and as the nucleus extrudes from the cell, a prerequisite for completion of enucleation. We further show that active but limited mitochondrial respiration is key to support nuclear extrusion. Notably, we found that pyruvate, independently of glucose oxidation, supports erythroblast enucleation. These findings provide a platform for dissecting the enucleation process during terminal erythroid cell maturation and devising methods to enhance this process. They also provide potential insights into mechanisms of anemia associated with mitochondrial disease, among others.20-22
Methods
Enucleation assay
Fluorescence-activated cell sorting (FACS)–purified mitochondrial membrane potential (MMP)–low or -high or total gate 3 (CD45−, TER119+, CD44low, tetramethyl rhodamine ethyl ester positive [TMRE+]) erythroblasts were plated in untreated 96-well plates at a density of 1 × 10⁶/mL as previously described10 (supplemental Methods); viability, mitochondrial activity, and enucleation were determined at indicated times. Compounds were added at the beginning of plating at the indicated concentration. For substrate exclusion, Dulbecco’s modified Eagle medium minus glucose, glutamine, and sodium pyruvate with 2% fetal bovine serum (FBS; minimal media) was used. Glucose (10 mM), glutamine (4 mM), and sodium pyruvate (4 mM) or dimethyl α-ketoglutarate (1 mM) and methyl pyruvate (1 mM) were added separately for 18 hours as indicated.
Live cell imaging, immunofluorescence, and confocal microscopy
Live cells were acquired on an LSM 880 Airyscan (Zeiss) with a 100×/1.46 Oil DIC objective for up to 4 hours. Ibidi chamber slides were maintained at 37°C with 5% carbon dioxide in Iscove modified Dulbecco medium with 2% FBS. Images were acquired and processed by Zen software and analyzed and quantified by Fiji.23,24 The area under the curve within peaks of intensity over the total area under the curve of normalized integrated intensities was calculated and then normalized to the total number of peaks. The same baseline was set for all cells per experimental group, determined by the lowest value just above background signal for a majority of cells in each experimental group. The peaks of intensity were defined as minimal height of 30% unless indicated otherwise.
ImageStream
Live stained or fixed cells were acquired with ImageStream X (Mark II). Data were processed and analyzed using IDEAS 6.2 software (Amnis/EMD Millipore) and FlowJo (version 10). Nucleated erythroblasts were identified by gating on in-focus (root mean square based) single cells expressing TER119 and DRAQ5 fluorescence. Enucleating erythroblasts were identified based on the ΔnucCentroid (ΔnucC; distance between the center of the cell and the center of the nucleus) metric as in the report by Liang et al.10 Localized or evenly distributed mitochondria were determined based on the circularity metric (circularitymito) and ΔmitoCentroid (ΔmitoC; distance between the center of the cell and the center of the mitochondrial networks), with localized mitochondria displaying low circularity and high ΔmitoC values.
Results
We used live cell confocal imaging to evaluate whether localization of mitochondria labeled with MitoTracker Green relative to the nucleus (4′,6-diamidino-2-phenylindole [DAPI]) changes during maturation of primary bone marrow erythroblasts marked by TER119 (Figure 1A; supplemental Figure 1A-B). In addition, we visualized mitochondrial localization by confocal microscopic analysis of antibodies to mitochondrial-specific translocase of outer membrane (TOM20) protein relative to the nucleus (DAPI) in primary bone marrow erythroblasts at distinct stages of maturation (Figure 1B-C; supplemental Figure 1C). To assess the distribution of mitochondrial networks relative to the nucleus, we generated a localization index (LI) based on an Azimuthal average of the mitochondrial fluorescence signal relative to the circular nucleus (Figure 1B-D; supplemental Figure 1C-D). LI values incorporate measurements of several mitochondrial properties in addition to mitochondrial distribution. Erythroblasts with low LI values display many mitochondrial peaks distributed around the cell, whereas erythroblasts with high LI values display few peaks concentrated in a minute region of the erythroblast (Figure 1B-D; supplemental Figure 1C-D); thus, LI values increase with increased mitochondrial localization. Our analyses revealed that in immature erythroblasts25 (gates 1 and 2: TER119+, CD44mid/high, FSCmid/high; supplemental Figure 1B), mitochondria are punctate and evenly distributed (low LI) around the nucleus throughout the cytosol (Figure 1B top panel; Figure 1C-D; supplemental Figure 1C top panel; supplemental Figure 1D left). These LI results were further validated by applying Shannon entropy, where values decrease with increased localization (supplemental Figure 1D right).
![Mitochondrial localization and nuclear polarization are synchronized during terminal maturation of mouse erythroblasts. (A) Snapshots of live confocal imaging of purified bone marrow erythroblasts to identify mitochondrial localization during increasing stages of maturation. Cells were stained with DRAQ5 (nucleus, blue), MitoTracker Green (MTG; mitochondria, green), and TER119 (erythroid marker, red). Arrows show mitochondrial localization. (B) Plots of Azimuthal average (also supplemental Figure 1C) integrate the signal intensity of TOM20 (mitochondria, red) around the center of the cell, displaying the normalized intensity around the whole cell counterclockwise starting at 0 degrees (evenly distributed [top], localized mitochondria [bottom]). (C-D) Representative confocal imaging of mitochondrial localization during erythroblast maturation was captured on Leica DM550 and analyzed by ImageJ; TOM20 (mitochondria, red) and DAPI (nucleus, blue) in erythroblasts (bar, 5 μm) (C), BrightField (BF; gray); and quantification of mitochondrial localization index to a specific area of the cell (D). The LI is calculated (data supplement; supplemental Figure 1C) such that mitochondria localized in 1 area of the cell that display fewer peaks including all of the fluorescence result in greater LI, with gate 3 (supplemental Figure 1B) showing the highest index of mitochondrial localization (supplemental Figure 1). The peaks of intensity were defined as: height, minimal 50% of the distance from the minimum to the maximum intensity above baseline; width, >5 degrees. (E) ImageStream analyses of gate 2 and 3 cells (supplemental Figure 2D) stained with TER119 (erythroid marker, yellow) and MTG (mitochondria, green) are shown with either evenly distributed (top) or localized mitochondria (bottom). The distribution of mitochondria was determined quantitatively using morphology-masked mitochondria based on circularity, measured as the average radius divided by the variance in radius, and the ΔmitoC, measured as the distance from the center of the mitochondrial networks from the center of the cell. (F) The scatter plot of erythroblasts (from panel E) with either localized mitochondria (low circularitymito, high ΔmitoC) or evenly distributed mitochondria (high circularitymito, low ΔmitoC). Plotted ratio of localized to evenly distributed mitochondria compare mitochondrial localization in progressively maturing erythroblast stages (right panel). (G) Representative cells from ImageStream analysis identifying gate 3 erythroblasts stained with MTG (mitochondria, green), TER119 (erythroid marker, yellow), and DRAQ5 (nucleus, red), as enucleating (high ΔnucC) or nonenucleating (low ΔnucC) based on the distance between the center of the nucleus and the cell. (H) The percentage of enucleating cells in erythroblasts with either localized or evenly distributed mitochondria was determined. Enucleating cells were gated on cells with high Δ Centroid between the nucleus and the maturing erythroblast. (I) The reciprocal analysis was performed by determining the frequency of erythroblasts with localized mitochondria in enucleating (E) G3 erythroblasts or nonenucleating (NE) G3 erythroblasts. Mean ± standard deviation (n ≥ 3). *P < .05, **P < .01 by Student t test (C-D,H-I) or 1-way analysis of variance followed by Tukey multiple comparisons test (F).](https://ash.silverchair-cdn.com/ash/content_public/journal/bloodadvances/5/10/10.1182_bloodadvances.2021004259/1/m_advancesadv2021004259f1.png?Expires=1767706469&Signature=DarfElGG0Mpi3pyTr49k0LoneVRW27tMesW2J7lrQGg-uaebcbKww5odTNvOa9dH~TxfkG5Kl55dmdDzlEQqq6L3cJo7JQxH4Z3TtXkjRLzLqcCT~S~zf8QJ0lBL6wm6oD1UTrzEsfsLWvgNOJcf86AFJFl0SRDEn~lr1c8c97KjDgzFx7YMsP8vOfJ7sHL-z5Tz03WONrwyJsJ6pAhXvQahLiNnj1vXjXVjUy1s~NgX~vKPACfAWsv0GI9kr~SuRUHgisZpIqEp1OJKG5T4-pZz~4bgVYKkB4kcqtg1D1z0VtRGHDQXM608miSn~HQdXwem01r2valegkFpVr4vsg__&Key-Pair-Id=APKAIE5G5CRDK6RD3PGA)
Mitochondrial localization and nuclear polarization are synchronized during terminal maturation of mouse erythroblasts. (A) Snapshots of live confocal imaging of purified bone marrow erythroblasts to identify mitochondrial localization during increasing stages of maturation. Cells were stained with DRAQ5 (nucleus, blue), MitoTracker Green (MTG; mitochondria, green), and TER119 (erythroid marker, red). Arrows show mitochondrial localization. (B) Plots of Azimuthal average (also supplemental Figure 1C) integrate the signal intensity of TOM20 (mitochondria, red) around the center of the cell, displaying the normalized intensity around the whole cell counterclockwise starting at 0 degrees (evenly distributed [top], localized mitochondria [bottom]). (C-D) Representative confocal imaging of mitochondrial localization during erythroblast maturation was captured on Leica DM550 and analyzed by ImageJ; TOM20 (mitochondria, red) and DAPI (nucleus, blue) in erythroblasts (bar, 5 μm) (C), BrightField (BF; gray); and quantification of mitochondrial localization index to a specific area of the cell (D). The LI is calculated (data supplement; supplemental Figure 1C) such that mitochondria localized in 1 area of the cell that display fewer peaks including all of the fluorescence result in greater LI, with gate 3 (supplemental Figure 1B) showing the highest index of mitochondrial localization (supplemental Figure 1). The peaks of intensity were defined as: height, minimal 50% of the distance from the minimum to the maximum intensity above baseline; width, >5 degrees. (E) ImageStream analyses of gate 2 and 3 cells (supplemental Figure 2D) stained with TER119 (erythroid marker, yellow) and MTG (mitochondria, green) are shown with either evenly distributed (top) or localized mitochondria (bottom). The distribution of mitochondria was determined quantitatively using morphology-masked mitochondria based on circularity, measured as the average radius divided by the variance in radius, and the ΔmitoC, measured as the distance from the center of the mitochondrial networks from the center of the cell. (F) The scatter plot of erythroblasts (from panel E) with either localized mitochondria (low circularitymito, high ΔmitoC) or evenly distributed mitochondria (high circularitymito, low ΔmitoC). Plotted ratio of localized to evenly distributed mitochondria compare mitochondrial localization in progressively maturing erythroblast stages (right panel). (G) Representative cells from ImageStream analysis identifying gate 3 erythroblasts stained with MTG (mitochondria, green), TER119 (erythroid marker, yellow), and DRAQ5 (nucleus, red), as enucleating (high ΔnucC) or nonenucleating (low ΔnucC) based on the distance between the center of the nucleus and the cell. (H) The percentage of enucleating cells in erythroblasts with either localized or evenly distributed mitochondria was determined. Enucleating cells were gated on cells with high Δ Centroid between the nucleus and the maturing erythroblast. (I) The reciprocal analysis was performed by determining the frequency of erythroblasts with localized mitochondria in enucleating (E) G3 erythroblasts or nonenucleating (NE) G3 erythroblasts. Mean ± standard deviation (n ≥ 3). *P < .05, **P < .01 by Student t test (C-D,H-I) or 1-way analysis of variance followed by Tukey multiple comparisons test (F).
Mitochondrial localization and nuclear polarization are synchronized during terminal maturation of mouse erythroblasts. (A) Snapshots of live confocal imaging of purified bone marrow erythroblasts to identify mitochondrial localization during increasing stages of maturation. Cells were stained with DRAQ5 (nucleus, blue), MitoTracker Green (MTG; mitochondria, green), and TER119 (erythroid marker, red). Arrows show mitochondrial localization. (B) Plots of Azimuthal average (also supplemental Figure 1C) integrate the signal intensity of TOM20 (mitochondria, red) around the center of the cell, displaying the normalized intensity around the whole cell counterclockwise starting at 0 degrees (evenly distributed [top], localized mitochondria [bottom]). (C-D) Representative confocal imaging of mitochondrial localization during erythroblast maturation was captured on Leica DM550 and analyzed by ImageJ; TOM20 (mitochondria, red) and DAPI (nucleus, blue) in erythroblasts (bar, 5 μm) (C), BrightField (BF; gray); and quantification of mitochondrial localization index to a specific area of the cell (D). The LI is calculated (data supplement; supplemental Figure 1C) such that mitochondria localized in 1 area of the cell that display fewer peaks including all of the fluorescence result in greater LI, with gate 3 (supplemental Figure 1B) showing the highest index of mitochondrial localization (supplemental Figure 1). The peaks of intensity were defined as: height, minimal 50% of the distance from the minimum to the maximum intensity above baseline; width, >5 degrees. (E) ImageStream analyses of gate 2 and 3 cells (supplemental Figure 2D) stained with TER119 (erythroid marker, yellow) and MTG (mitochondria, green) are shown with either evenly distributed (top) or localized mitochondria (bottom). The distribution of mitochondria was determined quantitatively using morphology-masked mitochondria based on circularity, measured as the average radius divided by the variance in radius, and the ΔmitoC, measured as the distance from the center of the mitochondrial networks from the center of the cell. (F) The scatter plot of erythroblasts (from panel E) with either localized mitochondria (low circularitymito, high ΔmitoC) or evenly distributed mitochondria (high circularitymito, low ΔmitoC). Plotted ratio of localized to evenly distributed mitochondria compare mitochondrial localization in progressively maturing erythroblast stages (right panel). (G) Representative cells from ImageStream analysis identifying gate 3 erythroblasts stained with MTG (mitochondria, green), TER119 (erythroid marker, yellow), and DRAQ5 (nucleus, red), as enucleating (high ΔnucC) or nonenucleating (low ΔnucC) based on the distance between the center of the nucleus and the cell. (H) The percentage of enucleating cells in erythroblasts with either localized or evenly distributed mitochondria was determined. Enucleating cells were gated on cells with high Δ Centroid between the nucleus and the maturing erythroblast. (I) The reciprocal analysis was performed by determining the frequency of erythroblasts with localized mitochondria in enucleating (E) G3 erythroblasts or nonenucleating (NE) G3 erythroblasts. Mean ± standard deviation (n ≥ 3). *P < .05, **P < .01 by Student t test (C-D,H-I) or 1-way analysis of variance followed by Tukey multiple comparisons test (F).
In contrast, using the same approaches to examine mitochondria and measure their relative position to the nucleus in mature bone marrow erythroblasts before enucleation (Figure 1B bottom panel; Figure 1D; supplemental Figure 1C bottom panel; supplemental Figure 1D), the data showed a high LI (supplemental Figure 1D left), corresponding to low Shannon entropy values (supplemental Figure 1D right panel), confirming that the mitochondria were concentrated and localized opposite the emerging pyrenocyte. Mitochondria continued to trail behind the nucleus as it increasingly extruded from the nascent reticulocyte (Figure 1A-D) and accumulated (high LI) at one end of the cell as erythroblasts matured (gate 3: TER119+, CD44low, FSClow; Figure 1B-D; supplemental Figure 1D). These results were further confirmed by immunostaining of VDAC1, a specific marker of the outer mitochondrial membrane (supplemental Figure 2A). The mitochondrial position relative to the nucleus was also observed independently in mouse E14 fetal liver erythroid cell maturation (supplemental Figure 2B). Importantly, a similar pattern of mitochondrial positioning closely adjacent to the nucleus was observed in primary human erythroblasts (supplemental Figure 2Ci) generated from ex vivo differentiation of CD34+ cells (supplemental Figure 2Cii). Taken together, these results suggest that the progressive mitochondrial localization behind the expulsing nucleus is independent of the hematopoietic tissue (bone marrow vs fetal liver) and is likely conserved during human erythroid maturation.
To further evaluate mitochondrial positioning relative to the nucleus, we tracked mitochondrial distribution in maturing erythroblasts at a single-cell level using a high- throughput approach by imaging flow cytometry (supplemental Figure 2D). This was based on measuring circularity parameters. In addition, we applied a principle similar to that for measuring enucleation in erythroblasts26,27 and measured the distance between the center of the cell and the center of the mitochondrial networks, which we labeled as the mitochondrial ΔmitoC (Figure 1E-F). These measurements of mitochondrial localization permitted resolution of late-stage erythroblasts into 2 categories, with either evenly distributed or localized mitochondria (Figure 1E). ImageStream flow cytometric analyses showed that the proportion of erythroblasts with localized mitochondria increased as erythroblasts matured (Figure 1E-F), in line with our immunofluorescence data. To further address whether mitochondria localize with similar kinetics as nuclear polarization, we compared mitochondrial distribution in enucleating vs nonenucleating erythroblasts as classified by ΔnucC (which measures the distance between the center of the cell and the center of the nucleus25,26 ) (Figure 1G-I). On the basis of this analysis (Figure 1H-I), we found the frequency of enucleation was approximately fourfold higher in erythroblasts with localized mitochondria as compared with those with evenly distributed mitochondria (Figure 1H). Conversely, enucleating erythroblasts were more than twice as likely to display localized mitochondria than nonenucleating erythroblasts (Figure 1I). Given the association of mitochondrial localization with nuclear polarization and enucleation, we investigated whether mitochondrial localization precedes nuclear polarization (supplemental Figure 3A-C). As shown in Figure 1H (top panel), not all erythroblasts with localized mitochondria exhibited high ΔnucC polarized) nuclei or enucleation. We reasoned that if mitochondrial positioning occurs before nuclear polarization, (1) we would be able to distinguish populations of erythroblasts with low mitochondrial circularity (circularitymito [localized mitochondria]) and a nonpolarized (centered) nucleus (ΔnucC < 0.5), as in subgate b, from both erythroblasts with evenly distributed mitochondria (high circularitymito) and a nonpolarized (centered) nucleus (ΔnucC < 0.5), as in subgate a, and erythroblasts with localized mitochondria and a polarized nucleus (ΔnucC > 0.5 and < 1), as in subgate c; (2) the proportion of erythroblasts with low circularitymito (localized mitochondria) and a nonpolarized (centered) nucleus, as in subgate b, would decrease during maturation from gate 2 to 3; and (3) the proportion of erythroblasts with localized mitochondria and a polarized nucleus, as in subgate c, would increase with erythroblasts maturing from gate 2 to 3. We therefore performed FACS on gate 2 and 3 bone marrow erythroblasts and analyzed ΔnucC vs circularitymito in single cells using ImageStream flow cytometry. As observed previously (Figure 1E-I), we found that during erythroblast maturation, a centered (nonpolarized) nucleus was associated with both low or high circularitymito (supplemental Figure 3A-C). A significant proportion of erythroblasts in gates 2 and 3 contained a centered nucleus associated with relatively low mitochondrial circularity (subgate b; supplemental Figure 3B-C). Notably, the proportion of these erythroblasts (subgate b) decreased significantly during erythroblast maturation (from gate 2 to 3). As anticipated, the fraction of erythroblasts with a polarized nucleus and low circularitymito increased in gate 3 relative to gate 2, altogether suggesting that mitochondrial progression toward a localized position occurs before nuclear polarization. In contrast to mitochondria, the even distribution of the golgi around the nucleus did not significantly change with erythroid maturation (supplemental Figure 3D), further supporting the notion that mitochondrial positioning is not the result of a generic impact of polarized nucleus on organelles. Collectively, these findings suggest mitochondrial localization near the nucleus may be implicated in the enucleation process independently of the developmental stage or mammalian species.
To address whether mitochondrial localization relative to the nucleus has any influence on the enucleation process, we disrupted mitochondrial motility and assessed its potential impact on enucleation. The motor protein dynein regulates microtubules and nuclear positioning within the cell, and kinesin facilitates mitochondrial motility along microtubules28,29 (Figure 2A-B; supplemental Figure 4). The inhibition of dynein activity with ciliobrevin D30 had no noticeable effect on erythroblast mitochondria or enucleation (Figure 2A-C; supplemental Figure 4). However, monastrol inhibition of kinesin activity31 disrupted the localization of mitochondria and significantly reduced erythroblast enucleation (Figure 2A-C). The 4-hour monastrol or ciliobrevin D treatment did not significantly affect the relative distribution of erythroblasts at distinct stages of maturation (supplemental Figure 4A-B) or the percentages of orthochromatic erythroblasts with a polarized nucleus (supplemental Figure 4C). Notably, monastrol-mediated disruption of mitochondrial localization did not have an obvious effect on the whole cytoskeleton, because tubulin distribution and expression were not affected (supplemental Figure 4D), and was dose dependent (supplemental Figure 4E-G). These combined results support the concept that mitochondrial localization closely adjacent to the nucleus is necessary for erythroblast enucleation.

Mitochondrial aggregation in close proximity to the nucleus facilitates murine erythroblast enucleation. (A) Confocal analysis of mitochondrial localization in orthochromatic erythroblasts (G3) treated with monastrol or ciliobrevin D (CBD) for 4 hours. Cells were stained with TOM20 (mitochondria, red) and DAPI (nucleus, blue; bar, 5 μm). Grayscale images are also shown. (B) Mitochondrial positioning relative to the nucleus was quantified by measuring mitochondrial localization plotted against nuclear size. R2 values were calculated to test goodness of fit for correlation between maturation (nucleus size) and mitochondrial localization index. (C) Flow plots displaying proportion of enucleated erythroblasts (% of DRAQ5− cells) 18 hours post-FACS sorting, treated with indicated compound vs dimethyl sulfoxide (DMSO) control (top). Quantification of enucleation and viability with indicated treatment (bottom). Mean ± standard error of the mean (n ≥ 3). **P < .01 by Student t test.
Mitochondrial aggregation in close proximity to the nucleus facilitates murine erythroblast enucleation. (A) Confocal analysis of mitochondrial localization in orthochromatic erythroblasts (G3) treated with monastrol or ciliobrevin D (CBD) for 4 hours. Cells were stained with TOM20 (mitochondria, red) and DAPI (nucleus, blue; bar, 5 μm). Grayscale images are also shown. (B) Mitochondrial positioning relative to the nucleus was quantified by measuring mitochondrial localization plotted against nuclear size. R2 values were calculated to test goodness of fit for correlation between maturation (nucleus size) and mitochondrial localization index. (C) Flow plots displaying proportion of enucleated erythroblasts (% of DRAQ5− cells) 18 hours post-FACS sorting, treated with indicated compound vs dimethyl sulfoxide (DMSO) control (top). Quantification of enucleation and viability with indicated treatment (bottom). Mean ± standard error of the mean (n ≥ 3). **P < .01 by Student t test.
To further evaluate whether mitochondria function as necessary guides that empower nucleus expulsion, we measured mitochondrial activity based on the MMP in live erythroblasts. Using TMRE, a mitochondria-specific cationic probe that accumulates within the mitochondrial matrix proportional to MMP level,32 combined with MitoTracker Green, which measures total mitochondrial abundance independent of MMP,33 we found both mitochondrial abundance and activity decreased gradually as erythroblasts matured (Figure 3A-B). However, relative to their total abundance, mitochondria retained high levels of MMP in maturing erythroblasts (G1-G3) and did not fully depolarize until after enucleation (G4) (Figure 3B middle panel). These results were further confirmed using an additional JC-1 probe that simultaneously measures mitochondrial abundance and MMP34 (supplemental Figure 5A).
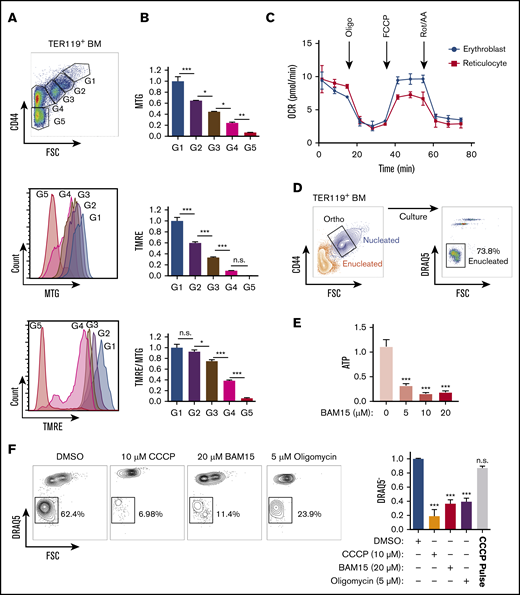
Mitochondrial metabolism is required for murine erythroblast enucleation. (A) Mitochondrial abundance and MMP was measured with MitoTracker Green (MTG) and TMRE, respectively, in erythroblasts. Gating strategy to identify erythroblasts (G1-G3), reticulocytes (G4), and RBCs (G5; top). Histograms display MTG (middle) and TMRE (bottom) intensities. (B) Quantification of the average intensities of MTG (top), TMRE (middle), and normalized TMRE to MTG (bottom) in distinct erythroblast populations. Fluorescence values normalized to values of gate 1. TMRE levels were normalized to MTG levels to determine the mitochondrial activity of the total mitochondria present within each erythroblast population. TMRE/MTG was calculated for each gate and values normalized to gate 1 value. (C) Oxygen consumption rate (OCR) as measured by the seahorse XF-96 of nucleated erythroblasts, reticulocytes, and RBCs undergoing FACS. Oligomycin (oligo), carbonyl cyanide-4-(trifluoromethoxy) phenylhydrazone (FCCP), and rotenone and antimycin A (Rot/AA) were added at the indicated time points. (D) Gating strategy for ex vivo enucleation assay. Orthochromatic erythroblasts (G3) undergoing FACS and cultured in StemSpan + 2% FBS were allowed to enucleate. Enucleation rates were assessed based on DRAQ5 staining vs forward scatter (FSC) properties. (E) ATP levels measured from cell lysates treated with increasing concentrations of the electron transport chain (ETC) uncoupler BAM15 at the 4-hour time point. (F) Flow plots of enucleation in response to various inhibitors at indicated concentrations on ETC after 18 hours in the ex vivo enucleation assay (left) and quantification of enucleation rates normalized to dimethyl sulfoxide (DMSO; right panel). CCCP pulse for 2 hours was followed with by washout. Mean ± standard error of the mean (n ≥ 3). *P < .05, **P < .01, ***P < .001 by 1-way analysis of variance followed by Tukey multiple comparisons test (B,E-F). BM, bone marrow; n.s., not significant.
Mitochondrial metabolism is required for murine erythroblast enucleation. (A) Mitochondrial abundance and MMP was measured with MitoTracker Green (MTG) and TMRE, respectively, in erythroblasts. Gating strategy to identify erythroblasts (G1-G3), reticulocytes (G4), and RBCs (G5; top). Histograms display MTG (middle) and TMRE (bottom) intensities. (B) Quantification of the average intensities of MTG (top), TMRE (middle), and normalized TMRE to MTG (bottom) in distinct erythroblast populations. Fluorescence values normalized to values of gate 1. TMRE levels were normalized to MTG levels to determine the mitochondrial activity of the total mitochondria present within each erythroblast population. TMRE/MTG was calculated for each gate and values normalized to gate 1 value. (C) Oxygen consumption rate (OCR) as measured by the seahorse XF-96 of nucleated erythroblasts, reticulocytes, and RBCs undergoing FACS. Oligomycin (oligo), carbonyl cyanide-4-(trifluoromethoxy) phenylhydrazone (FCCP), and rotenone and antimycin A (Rot/AA) were added at the indicated time points. (D) Gating strategy for ex vivo enucleation assay. Orthochromatic erythroblasts (G3) undergoing FACS and cultured in StemSpan + 2% FBS were allowed to enucleate. Enucleation rates were assessed based on DRAQ5 staining vs forward scatter (FSC) properties. (E) ATP levels measured from cell lysates treated with increasing concentrations of the electron transport chain (ETC) uncoupler BAM15 at the 4-hour time point. (F) Flow plots of enucleation in response to various inhibitors at indicated concentrations on ETC after 18 hours in the ex vivo enucleation assay (left) and quantification of enucleation rates normalized to dimethyl sulfoxide (DMSO; right panel). CCCP pulse for 2 hours was followed with by washout. Mean ± standard error of the mean (n ≥ 3). *P < .05, **P < .01, ***P < .001 by 1-way analysis of variance followed by Tukey multiple comparisons test (B,E-F). BM, bone marrow; n.s., not significant.
These combined findings suggest that mitochondria remain active during the enucleation process up to the postenucleation phase, even as total mitochondrial abundance declines (Figure 3B bottom panel). Seahorse measurement of mitochondrial oxygen consumption rate further confirmed that mitochondria remain active in erythroblasts up to the reticulocyte stage (Figure 3C). Together these results raise the possibility that mitochondrial metabolic activity contributes to the erythroblast enucleation process. Therefore, we determined whether mitochondrial ATP produced through oxidative phosphorylation was required for enucleation. To specifically measure the impact on the process of enucleation and exclude any confounding effects that erythroblast maturation might have on nuclear expulsion, we performed FACS on nucleated erythroblasts at the terminally differentiating orthochromatic stage, which occurs immediately before enucleation, for all ex vivo enucleation assays. Approximately 70% of nucleated orthochromatic erythroblasts that underwent FACS and were cultured under optimal conditions had enucleated by 18 hours (Figure 3D; supplemental Figure 5B). This assay enables specific probing of mitochondrial function immediately before enucleation in orthochromatic erythroblasts, when mitochondria are mostly localized in close proximity to the protruding nucleus. Treatment with sublethal doses of BAM15,35 a compound that uncouples ATP production from ETC activity, led to a significant decrease in ATP (Figure 3E). Importantly, inhibition of mitochondrial activity with BAM15, with another uncoupler, CCCP, or with the ATP synthase inhibitor oligomycin reduced erythroblast enucleation by at least 65% (Figure 3F; supplemental Figure 5B-C). Notably, although mitochondrial mass was modulated, inhibition of mitochondrial activity did not significantly affect viability at the doses used and was reversible, because a 2-hour pulse with CCCP followed by washout restored optimal enucleation (Figure 3F right panel; supplemental Figure 5C-D). Collectively, these data support an active role for oxidative phosphorylation during nuclear expulsion.
We further explored mitochondrial involvement in erythroblast maturation and enucleation by subdividing orthochromatic erythroblasts based on their MMP to identify erythroblasts with the 20% lowest and highest TMRE intensities (Figure 4A). Studies in our laboratory and others have uncovered functional differences in otherwise homogeneous highly purified T- and stem cell populations that displayed distinct MMP levels, suggesting mitochondrial heterogeneity may identify functional diversity within an otherwise pure hematopoietic cell population.36-41 In this context, the 20% gating allows for a wide enough separation between MMP levels to identify functional differences while being sufficiently inclusive to represent real populations of erythroblasts that exclude outliers. Mitochondria were highly localized near the nucleus in MMP-low and -high fractions of orthochromatic relative to early erythroblasts (supplemental Figure 6A). Although cellular size was overall similar between MMP-low and -high terminally maturing erythroblasts (gate 3; Figure 4B; supplemental Figure 6Bi-iii), CD44 levels were reduced in the MMP-low vs -high cells, suggesting a more mature phenotype (Figure 4C). In addition, MMP-high terminally maturing erythroblasts appeared to undergo one more cell division relative to MMP-low erythroblasts based on cell count, ploidy analysis, and Ki67 staining (Figure 4D-E; supplemental Figure 6C). Furthermore, the size of the nucleus was significantly smaller in the MMP-low as compared with the MMP-high fraction of orthochromatic erythroblasts, pointing toward a more condensed nucleus in the (gate 3) MMP-low fraction (Figure 4F). Histone acetylation marks H3K27 and H3K9, both associated with open chromatin and both reduced during nuclear condensation,42-44 were less abundant in MMP-low relative to MMP-high erythroblasts (Figure 4G). In contrast, the heterochromatin histone mark H3K9me3, a known barrier to reprogramming of the nucleus, expression of which increases with nuclear condensation and heterochromatin formation,45 appeared to be greatly concentrated in the MMP-high orthochromatic erythroblasts as compared with the MMP-low fraction (Figure 4H). Notably, H3K9me3 association with DAPI-bright regions of heterochromatin in MMP-high appeared to be lost in the MMP-low fraction, where H3K9me3 was mislocalized or remained only in residual islands of heterochromatic regions (Figure 4H). Loss of properly localized H3K9me3 in the MMP-low fraction is consistent with a nucleus in transition before enucleation.45 Mass spectrometry analysis of MMP-low vs -high orthochromatic erythroblasts further supported that levels of mitochondrial activity are associated with subpopulations, with distinct expression of histone-related, ribosomal, and metabolic proteins (supplemental Figure 6D). Overall, these studies suggest that the MMP-low fraction is at a later stage of maturation relative to the MMP-high fraction that is still dividing, raising the possibility that enucleating erythroblasts are enriched in the MMP-low as compared with the MMP-high fraction.
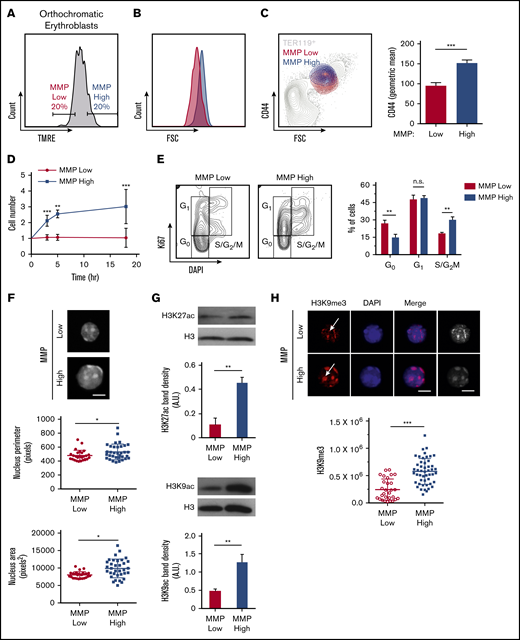
Mitochondrial activity identifies subpopulations of murine orthochromatic erythroblasts at distinct stages of maturation. (A) Flow plot displaying the gating used to segregate 20% of the lowest and highest MMP orthochromatic erythroblasts (TMRE− cells were excluded). (B) Flow plot displaying MMP-low and -high orthochromatic fractions plotted onto the total TER119+ parent population (also supplemental Figure 6Bi). (C) Histogram comparing CD44 expression between MMP-low and -high fractions (left) and quantification based on average intensities (right). (D) Ex vivo enucleation assay kinetics over 3 time points (3, 5, and 18 hours). Cell counts of MMP-low and -high fractions normalized to cell number at the start of plating. (E) Cell cycle analysis of MMP-low and -high fractions undergoing FACS with Ki67 and DAPI staining; gating strategy (left) and quantification (right). (F) Confocal imaging of DAPI-stained MMP-low and -high orthochromatic erythroblast fractions (top) and quantification of nucleus perimeter (middle) and area (bottom) as determined by ImageJ (bar, 5 μm). (G) Western blot analyses of acetylation marks H3K27 and H3K9 comparing MMP-low and -high fractions undergoing FACS; 1 representative blot of 3 independent experiments is shown (top); quantification (bottom). (H) Confocal images of H3K9me3 (top) and quantification of H3K9me3 intensity (bottom). Note arrows show H3K9me3 in DAPI bright regions of MMP-high and mislocalized H3K9me3 in MMP-low cells; mean ± standard error of the mean (n ≥ 3 each from 3 mice except for H3K9me3 from 2 experiments with 3 mice each; bar, 5 μm). *P < .05, **P < .01, ***P < .001 by Student t test (C-H).
Mitochondrial activity identifies subpopulations of murine orthochromatic erythroblasts at distinct stages of maturation. (A) Flow plot displaying the gating used to segregate 20% of the lowest and highest MMP orthochromatic erythroblasts (TMRE− cells were excluded). (B) Flow plot displaying MMP-low and -high orthochromatic fractions plotted onto the total TER119+ parent population (also supplemental Figure 6Bi). (C) Histogram comparing CD44 expression between MMP-low and -high fractions (left) and quantification based on average intensities (right). (D) Ex vivo enucleation assay kinetics over 3 time points (3, 5, and 18 hours). Cell counts of MMP-low and -high fractions normalized to cell number at the start of plating. (E) Cell cycle analysis of MMP-low and -high fractions undergoing FACS with Ki67 and DAPI staining; gating strategy (left) and quantification (right). (F) Confocal imaging of DAPI-stained MMP-low and -high orthochromatic erythroblast fractions (top) and quantification of nucleus perimeter (middle) and area (bottom) as determined by ImageJ (bar, 5 μm). (G) Western blot analyses of acetylation marks H3K27 and H3K9 comparing MMP-low and -high fractions undergoing FACS; 1 representative blot of 3 independent experiments is shown (top); quantification (bottom). (H) Confocal images of H3K9me3 (top) and quantification of H3K9me3 intensity (bottom). Note arrows show H3K9me3 in DAPI bright regions of MMP-high and mislocalized H3K9me3 in MMP-low cells; mean ± standard error of the mean (n ≥ 3 each from 3 mice except for H3K9me3 from 2 experiments with 3 mice each; bar, 5 μm). *P < .05, **P < .01, ***P < .001 by Student t test (C-H).
To investigate this question directly, primary orthochromatic erythroblasts with distinct MMP levels underwent FACS analyses, and fractions of enucleated cells using identical gates were monitored temporally in our ex vivo enucleation assay (as in Figure 3D). Although a progressively increasing rate of enucleation was observed at 0, 3, 6, 9, and 18 hours in both MMP-low and -high fractions (Figure 5A), MMP-low orthochromatic erythroblasts displayed consistently greater enucleation rates as compared with MMP-high cells (Figure 5A). To capture the dynamic continuum of the enucleation process, we used ImageStream flow cytometry to visualize at the single-cell level ΔnucC, which reflects nuclear polarization and increases during the enucleation process of late-maturing erythroblasts (Figure 5B; ΔnucC >1 in total enucleating vs ΔnucC >3 in late enucleating). We anticipated that this approach would expose subtle differences between the sequential events and enable the quantification of ΔnucC under homeostatic conditions. We found MMP-low orthochromatic erythroblasts displayed significantly greater medium values of ΔnucC as compared with MMP-high terminally maturing erythroblasts (Figure 5C). Moreover, the violin plots (Figure 5D) of MMP-low as compared with MMP-high cells revealed more extended distribution and/or higher frequency toward greater ΔnucC values (above medium; Figure 5D). These studies demonstrate that the MMP-low fraction of orthochromatic erythroblasts exhibits higher enucleation rates than its MMP-high counterpart. These combined findings indicate that although mitochondrial activity is necessary for erythroblast enucleation (Figures 3 and 4), optimal erythroblast enucleation occurs in erythroblasts in which mitochondrial activity is relatively tempered (Figure 5).
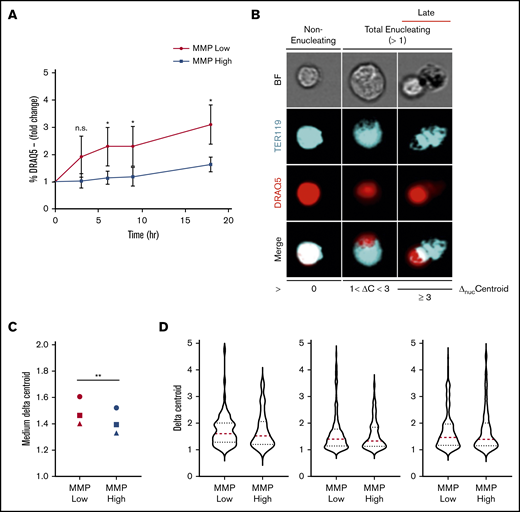
Enucleation is greater in MMP-low relative to MMP-high murine orthochromatic erythroblasts. (A) Enucleation rates (percentage of DRAQ5− cells of total viable TER119+ cells) of freshly sorted, using the same flow cytometer, MMP-low and -high orthochromatic erythroblasts (G3) subjected to ex vivo enucleation assay. Progression of enucleation at multiple time points was measured in identical gates and plotted as fold changes normalized to time 0. (B) Representative ImageStream micrographs of nonenucleating, total enucleating, and late stage enucleating orthochromatic erythroblasts gated according to ΔnucC = 0, 1 < ΔnucC < 3, or ΔnucC ≥ 3. BrightField (BF; gray), TER119 (erythroblast, blue), DRAQ5 (nucleus, red), and overlapping (white). (C) Medium ΔnucC values of enucleating (ΔnucC > 1) MMP-low and -high orthochromatic erythroblasts (n = 3 independent experiments). Cell doublets or dividing cells with 2 nuclei were excluded. (D) Violin plots of ΔnucC values of enucleating cells (of panel C). Red dotted lines, medium; blue dotted lines, quartiles. Mean ± standard deviation (n = 3). *P < .05, **P < .01 Student t test.
Enucleation is greater in MMP-low relative to MMP-high murine orthochromatic erythroblasts. (A) Enucleation rates (percentage of DRAQ5− cells of total viable TER119+ cells) of freshly sorted, using the same flow cytometer, MMP-low and -high orthochromatic erythroblasts (G3) subjected to ex vivo enucleation assay. Progression of enucleation at multiple time points was measured in identical gates and plotted as fold changes normalized to time 0. (B) Representative ImageStream micrographs of nonenucleating, total enucleating, and late stage enucleating orthochromatic erythroblasts gated according to ΔnucC = 0, 1 < ΔnucC < 3, or ΔnucC ≥ 3. BrightField (BF; gray), TER119 (erythroblast, blue), DRAQ5 (nucleus, red), and overlapping (white). (C) Medium ΔnucC values of enucleating (ΔnucC > 1) MMP-low and -high orthochromatic erythroblasts (n = 3 independent experiments). Cell doublets or dividing cells with 2 nuclei were excluded. (D) Violin plots of ΔnucC values of enucleating cells (of panel C). Red dotted lines, medium; blue dotted lines, quartiles. Mean ± standard deviation (n = 3). *P < .05, **P < .01 Student t test.
Lastly, we sought to identify the critical substrates that fuel mitochondria in orthochromatic erythroblasts and are required for enucleation. Because of a lack of mitochondria, mature RBCs are solely reliant on anaerobic glycolysis,46,47 which suggests a gradual transition toward increased glucose uptake and use during erythroblast maturation. Glucose is catabolized to pyruvate in the cytosol, which enters mitochondria and is further broken down via the tricarboxylic acid (TCA) cycle to generate reducing power for the ETC. Alternatively, glucose can be catabolized anaerobically via glycolysis to lactate (Figure 6A). Given the active mitochondrial respiration during the last steps of terminal erythroid maturation (Figure 3B-C), we anticipated that glucose, through the conversion to pyruvate, is the main substrate fueling the TCA cycle and powering the ETC of mitochondria. To evaluate this, we first examined our published RNA sequencing data10 profiling global transcriptome changes that occur with erythroblast maturation. Surprisingly, transcripts of glycolytic enzymes were mostly found to decrease rather than increase during erythroblast maturation (supplemental Figure 7A). Consistent with these results, seahorse analysis found a very low glycolytic rate in orthochromatic erythroblasts relative to total bone marrow cells (supplemental Figure 7B). Furthermore, the direct inhibition of glucose use by 2-deoxyglucose had no effect on viability or enucleation of orthochromatic erythroblasts (supplemental Figure 7C). These results suggest that glucose might not be the main substrate of mitochondria during the enucleation process in maturing erythroblasts.
![Identification of the main metabolic pathway fueling mitochondria during murine erythroblast enucleation. (A) Diagram depicting main cellular metabolic pathways, the substrates feeding into mitochondria and TCA cycle and their inhibitors. (B) Cluster of genes that are upregulated as erythroblasts mature identified through published RNA sequencing data.10 Normalized fragments per kilobase million (FPKM) values for various genes from cluster, which were identified to be important for use of fatty acids, pyruvate, and other monocarboxylates. (C-E) Ex vivo enucleation assay testing the effect of indicated inhibitors of fatty acid (sulfo-N-succinimidyl oleate [SSO]) (C) or pyruvate (D-E) metabolism. Plots display quantification of viability (top), enucleation (middle), and mitochondrial activity (bottom). Plots display quantification of viability and enucleation. Mean ± standard error of the mean (n ≥ 3). **P < .01, ***P < .001, ****P < .0001. cFBS, charcoal-stripped FBS; CHC, α-cyano-4-hydroxycinnamic acid; DMSO, dimethyl sulfoxide; DON, 6-diazo-5-oxo-L-norleucine.](https://ash.silverchair-cdn.com/ash/content_public/journal/bloodadvances/5/10/10.1182_bloodadvances.2021004259/1/m_advancesadv2021004259f6.png?Expires=1767706469&Signature=XUHeN2UYo9AuS1NtxQt~mkHMagBTaS9f2uWFASO~WLdjCYbcftU8P62Jp~OV~CXG4XtZgyMKLmHysp3Vlngz33q4WsdWJaKOzomQrTXI8fclv53sJY55iIkMQITuj9rNnRZwzbvvEOF7DIdUqaCQkvJxGjKgoL1ZgZFT7uRB6tvEJc~c9RpwiTKDhb9Jpn2QqGl80d~jB3~H~uh2euCDfs-BZpYUfXgm8pFhIaU6nX436A5UyBHGbsUovIjYmVbf~4ZUie3vufFBO9I3UqMHc6IGLW9KJU4rjPeCN~zs~Bk5UO-CCjkSdkyifnWYeZmKkMSvZ8t~Otfd9fHREyAHbg__&Key-Pair-Id=APKAIE5G5CRDK6RD3PGA)
Identification of the main metabolic pathway fueling mitochondria during murine erythroblast enucleation. (A) Diagram depicting main cellular metabolic pathways, the substrates feeding into mitochondria and TCA cycle and their inhibitors. (B) Cluster of genes that are upregulated as erythroblasts mature identified through published RNA sequencing data.10 Normalized fragments per kilobase million (FPKM) values for various genes from cluster, which were identified to be important for use of fatty acids, pyruvate, and other monocarboxylates. (C-E) Ex vivo enucleation assay testing the effect of indicated inhibitors of fatty acid (sulfo-N-succinimidyl oleate [SSO]) (C) or pyruvate (D-E) metabolism. Plots display quantification of viability (top), enucleation (middle), and mitochondrial activity (bottom). Plots display quantification of viability and enucleation. Mean ± standard error of the mean (n ≥ 3). **P < .01, ***P < .001, ****P < .0001. cFBS, charcoal-stripped FBS; CHC, α-cyano-4-hydroxycinnamic acid; DMSO, dimethyl sulfoxide; DON, 6-diazo-5-oxo-L-norleucine.
Identification of the main metabolic pathway fueling mitochondria during murine erythroblast enucleation. (A) Diagram depicting main cellular metabolic pathways, the substrates feeding into mitochondria and TCA cycle and their inhibitors. (B) Cluster of genes that are upregulated as erythroblasts mature identified through published RNA sequencing data.10 Normalized fragments per kilobase million (FPKM) values for various genes from cluster, which were identified to be important for use of fatty acids, pyruvate, and other monocarboxylates. (C-E) Ex vivo enucleation assay testing the effect of indicated inhibitors of fatty acid (sulfo-N-succinimidyl oleate [SSO]) (C) or pyruvate (D-E) metabolism. Plots display quantification of viability (top), enucleation (middle), and mitochondrial activity (bottom). Plots display quantification of viability and enucleation. Mean ± standard error of the mean (n ≥ 3). **P < .01, ***P < .001, ****P < .0001. cFBS, charcoal-stripped FBS; CHC, α-cyano-4-hydroxycinnamic acid; DMSO, dimethyl sulfoxide; DON, 6-diazo-5-oxo-L-norleucine.
One gene cluster that was significantly upregulated as erythroblasts matured contained transmembrane transporters and metabolic enzymes for fatty acids48-50 and monocarboxylates49,51 (pyruvate and many amino acids; Figure 6A-B). Specifically, fatty acids, pyruvate, and amino acids are funneled into the TCA cycle within the mitochondria, whereas they would serve a much less obvious function within mature RBCs that lack mitochondria. This points toward a potential transient and specialized role for these genes during terminal erythroblast maturation. To determine if these pathways are implicated in the enucleation process, use of metabolic substrates involved in these pathways was repressed with corresponding inhibitory drugs and combinations of media lacking the specific substrate of interest (Figure 6A). Whereas inhibition of the CD36 fatty acid transporter52 with sulfo-N-succinimidyl oleate negatively affected both erythroblast enucleation and survival, which was further enhanced when fatty acid availability was limited using charcoal-stripped FBS (Figure 6C), etomoxir inhibition of fatty acid transport into mitochondria53 had no effect on enucleation rates (supplemental Figure 7D). Similarly, 6-diazo-5-oxo-L-norleucine–mediated inhibition of glutamine catabolism did not have much effect on enucleation, either alone or in combination with etomoxir or 2-deoxyglucose, excluding potential compensatory effects of these pathways (supplemental Figure 7E-F). Notably, erythroblast viability was not affected by culture in charcoal-stripped FBS (Figure 6C).
In contrast, inhibition of pyruvate transport into the cytoplasm and mitochondria by blocking both monocarboxylate transporter and mitochondrial pyruvate carrier (MPC) with α-cyano-4-hydroxycinnamic acid49 negatively affected enucleation rates, associated with a drop in MMP without significantly affecting erythroblast survival (Figure 6D). Blocking pyruvate transport only into mitochondria using a potent MPC inhibitor (UK-5099 at 100 μM)54 also significantly inhibited enucleation without compromising survival (Figure 6E), whereas specific disruption of transport across the plasma membrane (AR- C155858) had no effect, potentially because the drug only affected monocarboxylate efflux55 (supplemental Figure 7G).
We next focused on pyruvate regulation of erythroblast enucleation; to confirm the effect of pyruvate vs glucose metabolism on enucleation rates relative to other pathways, we limited substrate availability in the enucleation assay (as in Figure 3D) and tested the use of pyruvate vs glucose and glutamine, all fuels feeding into the TCA cycle (Figures 6A and 7A). Whereas pyruvate alone was both necessary and sufficient to maintain enucleation and the corresponding optimal MMP levels (Figure 7A), neither glucose nor glutamine, alone or in combination, had any significant effect on the enucleation process (Figure 7A). Notably, pyruvate alone was sufficient to sustain viability, whereas glucose and glutamine, either alone or in combination, were not. Accordingly, inhibiting mitochondrial pyruvate carrier by UK-5099 (100 μM) compromised erythroblast ATP production, and addition of pyruvate alone but not glucose and glutamine together in minimal media mediated ATP generation (supplemental Figure 7H). Activation of the TCA cycle (downstream of pyruvate) by dimethyl 2-oxoglutarate or methyl pyruvate had a similar effect on erythroid enucleation and survival as pyruvate alone, further supporting these results (Figure 7B). Lactate, generated from pyruvate by lactated hydrogenase, also supported, although only partially, erythroid survival and enucleation when used as a single substrate (Figure 7C). Importantly, selective inhibition of lactate dehydrogenase by NHI-2 had an adverse effect on both erythroid enucleation and viability, further supporting the notion that lactate partly mediates the pyruvate effect on erythroid enucleation (Figure 7D). These surprising results suggest pyruvate but not glucose or glutamine is a major source of fuel for mitochondria during the enucleation process.
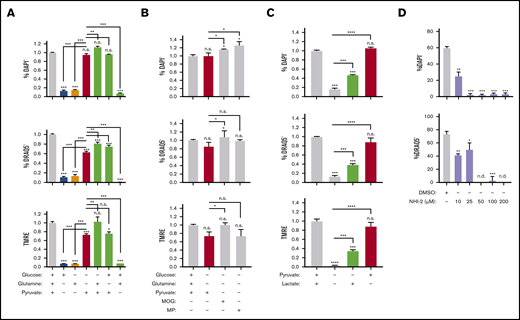
Pyruvate but not in situ glycolysis is required for mitochondrial metabolism during murine erythroblast enucleation. (A-C) Graphs displaying the viability (top), enucleation rate (middle), and mitochondrial activity (bottom) of orthochromatic erythroblasts in the presence or absence of glucose (10 mM), glutamine (4 mM), pyruvate (4 mM), dimethyl α-ketoglutarate (MOG; 1 mM), or methyl pyruvate (MP; 1 mM) (B) or lactate (2 mM) determined in the ex vivo enucleation assay at the 18-hour time point. (D) Graphs of the viability (top) and enucleation rate (bottom), of orthochromatic erythroblasts in the presence of dimethyl sulfoxide (DMSO) control or lactate dehydrogenase inhibitor (NHI-2) at indicated concentrations determined in the ex vivo enucleation assay at the 18-hour time point. Mean ± standard error of the mean (n ≥ 3). *P < .05, **P < .01, ***P < .001, ****P < .0001 by Student t test.
Pyruvate but not in situ glycolysis is required for mitochondrial metabolism during murine erythroblast enucleation. (A-C) Graphs displaying the viability (top), enucleation rate (middle), and mitochondrial activity (bottom) of orthochromatic erythroblasts in the presence or absence of glucose (10 mM), glutamine (4 mM), pyruvate (4 mM), dimethyl α-ketoglutarate (MOG; 1 mM), or methyl pyruvate (MP; 1 mM) (B) or lactate (2 mM) determined in the ex vivo enucleation assay at the 18-hour time point. (D) Graphs of the viability (top) and enucleation rate (bottom), of orthochromatic erythroblasts in the presence of dimethyl sulfoxide (DMSO) control or lactate dehydrogenase inhibitor (NHI-2) at indicated concentrations determined in the ex vivo enucleation assay at the 18-hour time point. Mean ± standard error of the mean (n ≥ 3). *P < .05, **P < .01, ***P < .001, ****P < .0001 by Student t test.
Discussion
Here we demonstrate that the precise localization and metabolic fueling of mitochondria are critical for the erythroid enucleation process. Our results suggest that while mitochondria are required for nuclear expulsion, mitochondrial positioning precedes nuclear polarization. Although we found that mitochondrial respiration is required for erythroblast enucleation, levels of mitochondrial activity compatible with optimal nuclear compaction and enucleation are relatively low. These results, consistent with early electron microscopic analyses of erythroblast enucleation,12-14,56 indicate that mitochondria are implicated in regulating the process of terminal erythroblast maturation.
Mitochondrial contributions to erythroblast maturation have only begun to be explored.57,58 In addition to providing ATP during nuclear expulsion and membrane resolution by a range of cytoskeletal proteins,5,6,10,59,60 mitochondria may remodel the environment by, for example, metabolic compartmentalization to localize ATP production where it is the most needed.61 As in hematopoietic stem cells,62 mitochondria are also likely to generate intermediate metabolites that modulate the epigenetic landscape and/or coordinate a range of metabolic processes, including iron metabolism and heme synthesis with erythroid nuclear condensation, enucleation, and terminal maturation.63
Our finding of pyruvate as a direct substrate fueling mitochondrial metabolism independently of in situ glucose oxidation during late-stage erythroblast enucleation is intriguing but in line with recent evidence that extracellular lactate (and pyruvate) but not in situ glycolysis fuels a majority of cells on a physiological level.64 Whether erythroblast mitochondria have a substrate preference or specific mechanisms of pyruvate use, including potential function for the selective increased expression of MPC2 (BRP44) with erythroid maturation,10 and/or whether glucose is diverted to the pentose phosphate pathway, potentially to prepare erythroblast transition to mature RBCs, requires further investigation. Given the current limitations of metabolomics in cells undergoing FACS65,66 and challenges associated with measuring oxygen consumption in cultured primary late-maturing erythroblasts (data not shown), ongoing work is focused on developing suitable ex vivo protocols to employ this approach to reveal precise pathways used in erythroblasts. While this work was under review, several reports highlighted the importance of regulation of mitochondria and their clearance to terminal human erythroid maturation.67-70
Our results serve as a new model of mitochondrial compartmentalization within the cell to provide essential metabolites in a precise spatial and temporal manner. These findings may be explored to improve in vitro RBC production.
The authors will make their protocols available to the scientific community without unreasonable restrictions; please contact saghi.ghaffari@mssm.edu.
Acknowledgments
The authors thank Saadi Khochbin (INSERM, Centre National de la Recherche Scientifique, Grenoble, France) and Drew Jones (Metabolomics Laboratory, New York University Langone Health, New York, NY) for invaluable discussions. They also thank the Flow Cytometry CoRE and Microscopy CoRE at the Icahn School of Medicine at Mount Sinai for technical help.
R.L. was partially supported by an American Heart Association Fellowship and National Institutes of Health (NIH) grant T32 HD075735 from the Eunice Kennedy Shriver National Institute of Child Health and Human Development. This work was supported by NIH grants R01HL136255 from the National Heart, Lung, and Blood Institute and R01CA205975 from the National Cancer Institute and by funds from NYSTEM Investigator Initiated Research Project award C32602GG (S.G.).
Authorship
Contribution: R.L. and S.G. conceived the project, analyzed the data, and wrote the manuscript; R.L., V.M., J.Q., T.A., S.R., M.L., and R.N. designed and performed experiments and analyzed data; V.M. assisted with writing/editing the manuscript; B.H., N.T., D.L.B., J.E.C., M.F., A.P., and V.F. provided additional required expertise and/or key reagents; and V.F. provided supplemental Figure 2B.
Conflict-of-interest disclosure: The authors declare no competing financial interests.
The current affiliation for R.L. is HemoGenyx Pharmaceuticals, New York, NY.
The current affiliation for V.M. is Department of Therapeutic Radiology, Yale University, New Haven, CT.
The current affiliation for S.R. and A.P. is Laboratory Medicine and Pathology, Center for Individualized Medicine, Mayo Clinic, Rochester, MN.
The current affiliation for B.H. is Institute for Veterinary Disease Control, Austrian Agency for Health and Food Safety, Mödling, Austria.
The current affiliation for V.F. is Department of Biological Sciences, University of Delaware, Wilmington, DE.
Correspondence: Saghi Ghaffari, Department of Cell, Developmental and Regenerative Biology, Icahn School of Medicine at Mount Sinai, New York, NY 10029; e-mail: saghi.ghaffari@mssm.edu.

