

Key Points
Hydroxyurea use promoted a reduction in mean TRV over a 2-year period.
Reticulocytosis was the strongest predictor of TRV elevation among patients not receiving any DMT.

Abstract
Elevated tricuspid regurgitant velocity (TRV) ≥2.5 m/s is a predictor of disease severity in adults and children with sickle cell anemia (SCA), but how disease-modifying therapies (DMTs) affect this biomarker is incompletely understood. We investigated the effect of DMTs on TRV elevation in children. In a prospective single-center study, 204 subjects with HbSS or HbSβ0 thalassemia (mean age, 10.6 years; range, 5-18) had echocardiograms with assessment of TRV, with repeat evaluations after 2 years of observation. One-hundred and twelve participants received DMTs (hydroxyurea, n = 72; monthly erythrocyte transfusions, n = 40), 58 did not receive any DMT, and 34 were begun on hydroxyurea during this observation period. In the entire cohort, an increase in hemoglobin of 1.0 g/dL was associated with a 0.03-m/s decrease in TRV (P = .024), and a decrease in absolute reticulocyte count of 1.0 × 10⁶/mL was associated with a 0.34-m/s decrease in TRV (P = .034). Compared with baseline, hydroxyurea exposure (continuous or newly started) was associated with an average 5% decline in mean TRV at the 2-year evaluation. Among participants newly started on hydroxyurea (mean treatment duration 1.2 ± 0.6 years), an increase in hemoglobin of 1.0 g/dL was associated with a 0.06-m/s decrease in TRV (P = .05). We conclude that hydroxyurea therapy may mitigate TRV elevation in children with SCA, possibly as a result of a reduction in hemolysis and improvement in anemia.
Introduction
A Doppler-derived tricuspid regurgitant velocity (TRV) value ≥2.5 m/s is a noninvasive marker of pulmonary hypertension (PH) in sickle cell anemia (SCA), with an estimated positive predictive value of 62% for PH, when used in conjunction with the 6-minute walk test and NT-probrain natriuretic peptide (NT-proBNP).1 In adult and pediatric SCA studies, TRV ≥2.5 m/s has been shown to be associated with such clinical complications as proteinuria,2-4 leg ulcers,5,6 decreased exercise capacity,7-9 and acute chest syndrome10,11 Furthermore, elevated TRV (≥2.5 m/s) is an independent predictor of early mortality in adults with SCA, with multiple studies showing a fourfold to 10-fold increase in the risk of death.12-15 In children, elevated TRV correlates with decreased exercise tolerance.16 Recently, increased TRV was reported to be significantly associated with death in adolescents and young adults with SCA who were followed for a median of 3.6 years; 20% of those who died had TRV ≥2.7 m/s.17 Collectively, these findings highlight the importance of elevated TRV as a biomarker of disease severity in adults and children with SCA.18 Investigation of treatments that affect TRV progression and its correlates is needed.
Anemia, hemolysis, and hypoxemia have all been demonstrated to be associated with elevated TRV in children19-21 and adults2,12,13 with SCA. Our group recently showed that, in individuals with HbSS or HbSβ0 thalassemia not on disease-modifying therapies (DMTs), TRV elevation was strongly influenced by the degree of anemia.22 Use of DMTs, such as hydroxyurea and chronic erythrocyte transfusions, have impacted the natural history of SCA by improving laboratory parameters of anemia and hemolysis, preventing acute complications, and preserving organ function.23-30 However, data regarding their effect on TRV are conflicting.2,11-13,16,27,31-35
To better understand the effect of DMTs on TRV and to help elucidate the underlying mechanism of this effect, we prospectively evaluated the effects of hydroxyurea and monthly erythrocyte transfusions on TRV in 2 longitudinal cohorts of children with SCA who underwent screening echocardiograms (NCT00842621 and NCT02098863).22,36 Our primary objective was to compare the changes in TRV according to DMT exposure. We tested the hypothesis that, over a period of 2 years, treatment with DMTs (hydroxyurea or monthly erythrocyte transfusions) would be associated with a reduction in TRV from baseline. The secondary objective was to identify predictive factors (laboratory biomarkers of hemolysis and inflammation) of TRV change in patients with SCA treated with DMTs.
Materials and methods
Participant selection
We included participants in the Long Term Effects of Erythrocyte Lysis (ELYSIS; NCT00842621)22 and the Sickle Cell Clinical and Intervention Program (SCCRIP; NCT02098863)36 who had SCA (HbSS or HbSβ0 thalassemia), were between the ages of 5 and 18 years at the time of their first screening echocardiogram, and had a subsequent screening echocardiogram 2 years from baseline. Individuals with a history of cardiac surgery, structural heart defects, or left ventricular systolic dysfunction (shortening fraction <28%) were excluded.
ELYSIS was a single-institution longitudinal observational study conducted at St Jude Children’s Research Hospital from 2009 to 2016 that investigated the role of hemolysis and elevated TRV in children (aged 5-18 years) with sickle cell disease (all genotypes) and other forms of hemolytic anemia.22 For the current analysis, only subjects with HbSS or HbSβ0 thalassemia genotypes (n = 170) were included. SCCRIP is a multicenter lifespan prospective cohort initiated in 2014 for children and adults with sickle cell disease (all genotypes), unselected for disease severity, that investigates disease progression.36 At the time of this analysis, 34 SCCRIP participants met the inclusion criteria and were included in this analysis.
All subjects underwent prospective screening measurement of TRV by Doppler-echocardiography at 2 time points, 24 months apart. The Institutional Review Board at St Jude Children’s Research Hospital approved the studies, and all participants (or their legal guardians, in case of minors) provided written informed consent prior to any study-related activity.
Study evaluations
Participants underwent the initial and 2-year follow-up study evaluations (laboratory and echocardiogram) at steady-state (≥30 days from an acute illness or hospitalization or emergent blood transfusion). All of the laboratory tests were obtained on the same day or within 7 days from the baseline and the 2-year echocardiogram. Among individuals on monthly transfusion therapy, evaluations were performed on the same day, but prior to the scheduled blood transfusion. Laboratory measures included hematologic and inflammatory markers: hemoglobin (Hb), absolute reticulocyte count (ARC), lactate dehydrogenase (LDH), total bilirubin, fetal hemoglobin (HbF), mean corpuscular volume (MCV), von Willebrand factor antigen, serum ferritin, C-reactive protein (CRP), white blood cell count (WBC), and factor VIII levels.22 Additionally, the cytokines that were previously shown to decrease significantly with hydroxyurea treatment were included: E-selectin, soluble vascular cell adhesion molecule (sVCAM), epidermal growth factor (EGF), interleukin-7 (IL-7), macrophage inflammatory protein (MIP-1α), MIP-1β, soluble CD40 ligand (sCD40L), interferon-α2 (IFN-α2), and IL-4.37 Finally, clinical markers, NT-proBNP and urine protein-creatinine ratio (UPCR), were obtained at baseline and the 2-year time points. The frequency of acute chest syndrome (ACS) and acute pain events during the 2-year interval prior to baseline and during the 2-year study period were also included.
Echocardiography
Complete 2-dimensional transthoracic echocardiography was obtained using a Vivid 7 machine with the EchoPAC picture archive software (GE Medical Systems, Milwaukee, WI). Echocardiograms were obtained as a screening test and not prompted by a clinical concern. All measurements were performed according to the American Society of Echocardiography guidelines.38 TRV was evaluated in the parasternal and apical views. The best-quality highest-velocity signal was selected after ≥5 samples of continuous wave Doppler TRV tracings. All echocardiograms were performed by a single experienced research sonographer and read by a single experienced cardiologist blinded to the participant’s clinical data.
Statistical considerations
Participants were divided into 4 strata according to their exposure to DMTs: group 1, untreated during the entire 2-year interval; group 2, untreated at baseline with hydroxyurea initiated during the 2-year interval; group 3, treated with hydroxyurea for the entire 2-year interval; and group 4, treated with chronic transfusions for the entire 2-year interval. A TRV ≥2.5 m/s was considered elevated. Although some studies in children with SCA have used other cutoffs (≥2.6-2.7 m/s) to define elevated TRV,16,17,19 we used the traditional threshold of ≥2.5 m/s, which has been confirmed in multiple pediatric studies to be significantly associated with complications of SCA-related organ injury.4,10,11 The Shapiro-Wilk test was used to test for data normality. Fisher’s exact test was used to compare group differences in categorical variables. Analysis of variance (2-sample Student t test) or the Kruskal-Wallis (Wilcoxon rank sum) test was used to compare group differences in continuous variables. The 1-sample Student t test or the Wilcoxon signed-rank test was used to compare TRV and laboratory values between baseline and year 2, and McNemar’s test was performed to compare the proportions of patients with elevated TRV at baseline and at year 2.
Linear mixed models (LMMs) were used to investigate the association between laboratory markers and TRV over time. LMMs were adjusted for baseline age, sex, and time point (baseline or year 2), as well as treatment group (for the entire sample only). Using the same variables for adjustments, generalized LMMs with binomial link function were used to investigate the association between biomarkers and elevated TRV. Linear regression modeling was also used to test the association between covariates and the change in TRV between baseline and year 2 as the dependent variable, adjusting for baseline TRV, baseline age, sex, and treatment group (for the entire sample only). With the exception of Hb, ARC, and CRP, the cubic root function was applied to transform the remaining laboratory data before fitting any model. All P values were 2-sided and significant at <.05. False discovery rate (FDR)−adjusted P values (PFDR) were also produced to adjust for multiple comparisons. Analyses were conducted using R 3.5.3 and SAS 9.4.
Results
Patient characteristics
Two hundred and four individuals (170 from the ELYSIS cohort, 34 from the SCCRIP cohort) were followed longitudinally for 2 years. There were 108 females (53%), with a mean age of 10.6 ± 3.7 years at baseline, and the pooled cohort included 191 individuals with HbSS thalassemia and 13 individuals with HbSβ0 thalassemia (Table 1). No demographic differences were seen between the ELYSIS and SCCRIP cohorts at baseline. However, participants from the ELYSIS cohort had higher baseline TRV (PFDR = .03) and a lower rate of splenectomy (PFDR = .03) (supplemental Table 1). The demographics of the participants in the 4 subgroups were generally similar, although the children who were maintained on hydroxyurea (group 3) or monthly transfusions (group 4) throughout the 2-year interval were significantly older than the children who did not receive either (group 1) (PFDR < .0001) (Table 1). In group 4 (continuous transfusion therapy), individuals from the ELYSIS cohort (n = 25) were older (PFDR = .03) compared with individuals from the SCCRIP cohort (n = 15) and had higher baseline TRV (PFDR = .03) (supplemental Table 2).
Patient characteristics
| All (N = 204) | Group 1 (n = 58) | Group 2 (n = 34) | Group 3 (n = 72) | Group 4 (n = 40) | Raw P | PFDR | |
|---|---|---|---|---|---|---|---|
| Age, y | 10.60 (3.65) | 8.75 (2.85) | 9.92 (3.33) | 12.05 (3.51) | 11.25 (3.99) | <.0001 | <.0001 |
| Sex, n (%) | .78 | .89 | |||||
| Male | 96 (47.06) | 28 (48.28) | 16 (47.06) | 36 (50) | 16 (40) | ||
| Female | 108 (52.94) | 30 (51.72) | 18 (52.94) | 36 (50) | 24 (60) | ||
| Genotype, n (%) | .23 | .32 | |||||
| HbSS | 191 (93.63) | 54 (93.10) | 31 (91.18) | 66 (91.67) | 40 (100) | ||
| HbS/β0 | 13 (6.37) | 4 (6.90) | 3 (8.82) | 6 (8.33) | 0 (0) | ||
| Splenectomy, n (%) | .27 | .33 | |||||
| Yes | 35 (17.16) | 8 (13.79) | 3 (8.82) | 14 (19.44) | 10 (25) | ||
| No | 169 (82.84) | 50 (86.21) | 31 (91.18) | 58 (80.56) | 30 (75) | ||
| Duration of therapy, y | 6.09 (4.21) | N/A | 1.20 (0.69) | 7.77 (3.84) | 7.23 (3.39) | <.001 | <.0001 |
| Dose of HU, mg/kg per day | 23.96 (4.06) | N/A | 22.72 (4.28) | 24.62 (3.8) | N/A | .03 | .04 |
| MCV at baseline, fL | 92.81 (14.34) | 84.21 (9.38) | 85.69 (10.35) | 106.16 (13.45) | 87.63 (3.83) | <.0001 | <.0001 |
| MCV at year 2, fL | 94.39 (14.75) | 82.91 (9.58) | 99.94 (11.54) | 104.86 (14.55) | 87.19 (3.53) | <.0001 | <.0001 |
| HbF at baseline, % | 12.99 (9.26) | 13.97 (8.17) | 9.72 (5.89) | 19.45 (8.08) | 3.04 (3.07) | <.0001 | <.0001 |
| HbF at year 2, % | 13.48 (9.25) | 11.79 (6.09) | 19.83 (9.38) | 17.75 (7.33) | 2.80 (2.36) | <.0001 | <.0001 |
| Hb at baseline, g/dL | 9.01 (1.21) | 8.59 (0.92) | 8.35 (1.17) | 9.31 (1.25) | 9.64 (1.06) | <.0001 | <.0001 |
| Hb at year 2, g/dL | 9.28 (1.14) | 8.78 (0.90) | 9.37 (1.22) | 9.44 (1.20) | 9.68 (1.07) | <.01 | <.01 |
| TRV at baseline, m/s | 2.40 (0.29) | 2.37 (0.34) | 2.41 (0.27) | 2.41 (0.26) | 2.41 (0.29) | .98 | .98 |
| TRV at baseline ≥2.5 m/s, n (%) | 69 (33.82) | 18 (31.03) | 12 (35.29) | 24 (33.33) | 15 (37.50) | .92 | .98 |
| TRV at year 2, m/s | 2.34 (0.28) | 2.39 (0.24) | 2.28 (0.25) | 2.30 (0.31) | 2.39 (0.27) | .02 | .04 |
| TRV at year 2 ≥2.5 m/s, n (%) | 56 (27.45) | 18 (31.03) | 7 (20.59) | 16 (22.22) | 15 (37.50) | .24 | .32 |
Unless otherwise noted, data are mean (standard deviation). Group differences were tested using Fisher’s exact test for categorical variables and analysis of variance or the Kruskal-Wallis test for continuous variables. Group 1: not on disease modifying therapy at baseline and 2-y evaluation; group 2: not on disease modifying therapy at baseline evaluation, but initiated hydroxyurea prior to the 2-y evaluation; group 3: on hydroxyurea at both baseline and 2-y evaluation; group 4: on monthly blood transfusions at both baseline and 2-y evaluation. HU, hydroxyurea; N/A, not applicable.
Participants in group 3 received the maximum tolerated dose of hydroxyurea at a mean dose of 24.6 3.8 mg/kg per day for a mean of 7.7 ± 3.8 years, whereas children who were begun on hydroxyurea during the study period (group 2) had received treatment for 1.2 ± 0.69 years. As expected, group 3 participants maintained on a stable hydroxyurea dose had significantly higher MCV and HbF levels at the initial evaluation (PFDR < .0001). Participants in group 4 had been on monthly transfusions for a mean of 7.2 ± 3.4 years, most frequently for abnormal transcranial Doppler velocity or secondary stroke prevention.
Change in TRV over 2 years
In the entire study population, there was a significant decrease in the continuous TRV over time (−0.06 m/s ± 0.36; PFDR = .02) (Figure 1; Table 2), with no significant change in the prevalence of elevated TRV over time (Figure 2; Table 2).

Mean TRV at baseline and 2-year follow-up evaluation. Change in mean TRV in the entire cohort and within each subgroup at baseline and at the 2-year follow-up evaluation. Group 1: not on DMT at baseline or at 2-year evaluation; group 2: not on DMT at baseline evaluation but started on hydroxyurea prior to the 2-year evaluation; group 3: on hydroxyurea at baseline and 2-year evaluation; group 4: on monthly blood transfusion at baseline and 2-year evaluation. One outlier in group 1 at baseline with TRV of 0.05 m/s is not shown. *P ≤ .05, **P ≤ .01. NS, not significant.
Mean TRV at baseline and 2-year follow-up evaluation. Change in mean TRV in the entire cohort and within each subgroup at baseline and at the 2-year follow-up evaluation. Group 1: not on DMT at baseline or at 2-year evaluation; group 2: not on DMT at baseline evaluation but started on hydroxyurea prior to the 2-year evaluation; group 3: on hydroxyurea at baseline and 2-year evaluation; group 4: on monthly blood transfusion at baseline and 2-year evaluation. One outlier in group 1 at baseline with TRV of 0.05 m/s is not shown. *P ≤ .05, **P ≤ .01. NS, not significant.
Change in TRV and laboratory and clinical markers over the 2-y study period
| Group 1 | Group 2 | Group 3 | Group 4 | All | ||||||
|---|---|---|---|---|---|---|---|---|---|---|
| Mean change | P* | Mean change | P* | Mean change | P* | Mean change | P* | Mean change | P* | |
| TRV, m/s | 0.02 (0.40) | .96 | −0.14 (0.33) | .02* | −0.11 (0.35) | <.01† | −0.01 (0.30) | .82 | −0.06 (0.36) | <.01* |
| TRV ≥2.5 m/s, n (%) | 0 (0.00) | >.99 | 5 (14.71) | .17 | 8 (11.11) | .10 | 0 (0.00) | >.99 | 13 (6.37) | .12 |
| MCV, fL | −1.30 (3.72) | <.01† | 14.26 (9.09) | <.0001† | −1.30 (9.3) | .64 | −0.42 (3.10) | .41 | 1.51 (9.13) | .13 |
| HbF, % | −2.37 (3.54) | <.0001† | 10.11 (6.31) | <.0001† | −1.71 (5.42) | .01† | −0.28 (2.10) | .68 | 0.48 (6.45) | .77 |
| Hb, g/dL | 0.19 (0.68) | .08 | 1.02 (1.04) | <.0001† | 0.10 (0.88) | .36 | 0.06 (0.83) | .65 | 0.28 (0.91) | <.001† |
| ARC, ×109/L | 0.00 (0.07) | .66 | −0.13 (0.11) | <.0001† | 0.01 (0.08) | .37 | 0.02 (0.10) | .33 | −0.02 (0.10) | .03 |
| LDH, U/L | −12.78(91.09) | .29 | −182.75 (150.92) | <.0001† | −50.19 (196.5) | .02 | 17.93 (169.06) | .52 | −49.27 (170.68) | <.0001† |
| Bilirubin, mg/dL | 0.23 (0.88) | .01 | −1.09 (1.21) | <.0001† | 0.01 (1.16) | .69 | 0.77 (1.40) | <.01 | 0.03 (1.28) | .79 |
| WBC, ×109/L | −0.14 (3.42) | .97 | −3.95 (4.98) | <.0001† | 0.30 (3.03) | .40 | 1.09 (4.26) | .13 | −0.41 (4.10) | .38 |
| Platelets, ×109/L | 3.22 (77.06) | .55 | −29.29 (146.16) | .06 | 46.61 (170.54) | <.01† | −22.28 (102.58) | .01 | 8.19 (135.14) | .81 |
| VWF, % | 7.52 (25.4) | <.01 | −23.30 (32.21) | <.001† | 2.90 (35.77) | .55 | 14.73 (41.20) | .11 | 0.72 (34.87) | .83 |
| FVIII, % | 15.08 (46.23) | .02 | −8.86 (42.44) | .24 | 10.77 (50.19) | .12 | 5.41 (57.58) | .66 | 7.48 (48.84) | .05 |
| CRP, mg/dL | −0.01 (0.65) | .37 | −0.38 (1.36) | .24 | 0.08 (0.73) | .99 | 0.04 (0.23) | .44 | −0.05 (0.84) | .76 |
| Ferritin, ng/mL | −4.75 (232.29) | .06 | −10.40 (121.02) | .62 | 16.50 (380.26) | .17 | −18.72 (1997.42) | .59 | −1.01 (894.75) | .75 |
| E-selectin | 2.20 (41.35) | .75 | −69.20 (63.22) | <.001† | −4.82 (34.4) | .39 | −6.15 (26.65) | .37 | −13.92 (48.85) | <.01† |
| sVCAM | −69.33 (271.66) | .18 | −312.03 (409.08) | <.01† | −188.43 (443.89) | <.001† | 61.26 (335.69) | .87 | −133.99 (385.52) | <.0001† |
| EGF | 27.07 (186.32) | .39 | −47.73 (114.59) | .09 | −3.91 (164.54) | .74 | 68.08 (302.16) | .56 | 9.25 (191.43) | .83 |
| IL-7 | −0.44 (12.01) | .67 | −2.85 (9.88) | .31 | −8.27 (26.35) | <.01† | −1.30 (8.93) | .21 | −3.72 (18.00) | <.01† |
| MIP-1α | −12.01 (107.38) | .45 | 60.58 (1114.29) | .18 | −139.31 (649.01) | .10 | −68.58 (259.56) | .21 | −52.04 (608.13) | <.01† |
| MIP-1β | 8.75 (63.74) | .58 | −17.90 (44.03) | .10 | −15.87 (51.44) | .09 | −4.92 (34.48) | .94 | −6.48 (53.32) | .10 |
| sCD40L | −1189.1 (7659.9) | .38 | −8280.4 (9301.3) | <.01† | −494.6 (6620.05) | .63 | −1606.8 (8174.92) | .75 | −2244.4 (8102.34) | <.01† |
| IFN-α2 | 19.65 (78.35) | .30 | −6.82 (34.59) | .13 | −35.06 (164.91) | <.01† | −2.25 (28.81) | .76 | −7.25 (110.17) | .17 |
| IL-4 | 3.58 (19.39) | .49 | 0.63 (9.26) | .94 | −6.16 (19.31) | .03 | −0.54 (9.49) | .82 | −0.94 (17.13) | .27 |
| NT-proBNP, pg/mL | −33.60 (100.41) | .03 | −13.93 (159.38) | .04 | −28.19 (86.48) | .03 | −42.45 (95.72) | <.05 | −29.34 (108.58) | <.0001† |
| UPCR | −17.04 (106.19); P = .16 | −36.15 (80.61); <.01† | −17.40 (184.03); .01† | −21.86 (155.29); P = .49 | −21.36 (143.74); <.001† | |||||
| ACS‡, event counts | 0.07 (0.45); P = .39 | −0.29 (0.52); <.01† | −0.11 (0.83); P = .17 | −0.05 (0.39); P = .69 | −0.08 (0.62); P = .03 | |||||
| VOC‡, event counts | 0.12 (1.11); P = .53 | −0.06 (2.01); P = .79 | 0.04 (1.76); P = .55 | −0.28 (0.75); P = .03 | −0.01 (1.48); P = .74 | |||||
| ACS + VOC‡, event counts | 0.19 (1.15); P = .32 | −0.35 (2.01); P = .31 | −0.07 (2.27); P = .99 | −0.33 (0.86); P = .03 | −0.09 (1.73); P = .53 | |||||
Data are mean (standard deviation) or n (%), except TRV ≥2.5 m/s is presented as n (%). Change between baseline and year 2 follow-up was calculated and tested from a difference of 0 using the 1-sample Student t test or the Wilcoxon signed-rank test for continuous variables and McNemar’s test for categorical variable.
Group 1: not on disease modifying therapy at baseline and 2-y evaluation; group 2: not on disease modifying therapy at baseline evaluation, but initiated hydroxyurea prior to the 2-y evaluation; group 3: on hydroxyurea at both baseline and 2-y evaluation; group 4: on monthly blood transfusions at both baseline and 2-y evaluation. FVIII, factor VIII; VOC, vaso-occlusive (acute pain) crisis; VWF, von Willebrand factor.
Raw P value.
PFDR < .05.
Mean change in event counts between the 2-y interval prior to baseline and the 2-y study period.
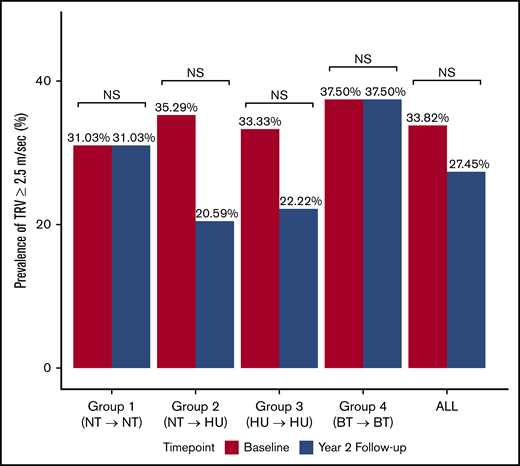
Prevalence of TRV ≥2.5 m/s at baseline and at 2-year follow-up evaluation. Proportion of participants with elevated TRV (≥2.5 m/s) in the entire cohort and within each subgroup at baseline and 2-year follow-up evaluation. Group 1: not on DMT at baseline or 2-year evaluation; group 2: not on DMT at baseline evaluation, but started on hydroxyurea prior to the 2-year evaluation; group 3: on hydroxyurea at baseline and at 2-year evaluation; group 4: on monthly blood transfusion at baseline and at 2-year evaluation. NS, not significant.
Prevalence of TRV ≥2.5 m/s at baseline and at 2-year follow-up evaluation. Proportion of participants with elevated TRV (≥2.5 m/s) in the entire cohort and within each subgroup at baseline and 2-year follow-up evaluation. Group 1: not on DMT at baseline or 2-year evaluation; group 2: not on DMT at baseline evaluation, but started on hydroxyurea prior to the 2-year evaluation; group 3: on hydroxyurea at baseline and at 2-year evaluation; group 4: on monthly blood transfusion at baseline and at 2-year evaluation. NS, not significant.
We then compared the TRV at baseline and at 2 years among the 4 subgroups. At baseline, TRV was not significantly different among the 4 subgroups. However, at the 2-year follow-up echocardiogram, the hydroxyurea-treated groups (groups 2 and 3) had significantly lower mean TRV compared with groups 1 and 4 (PFDR = .04) (Table 1). We then looked at the change in TRV as a continuous variable within each group over the 2-year study period. Treatment with hydroxyurea resulted in a significant decrease in TRV over time (group 2, difference −0.14 m/s ± 0.33, PFDR = .04; group 3, difference −0.11 m/s ± 0.35; PFDR = .04; Figure 1; Table 2). TRV remained stable in groups 1 and 4 with no significant change over time (Figure 1; Table 2). When TRV was analyzed as a categorical variable dichotomized at 2.5 m/s, the prevalence of elevated TRV (≥2.5 m/s) did not differ among the subgroups at the baseline or 2-year evaluation (Table 1).
Finally, we looked at the proportion of participants in each subgroup who developed a persistently elevated TRV (TRV ≥2.5 m/s at baseline and 2-year evaluation) or a newly elevated TRV (TRV <2.5 m/s at baseline and TRV ≥2.5 m/s at 2-year evaluation) over the 2-year period. Twenty-two percent (9/40) of patients on monthly blood transfusion (group 4) had persistently elevated TRV compared with 10.3% (11/106) of patients who were treated with hydroxyurea (groups 2 and 3 combined) and 12% (7/58) of patients in group 1 (untreated). However, 18.5% (11/58) of participants in group 1 (untreated) developed elevated TRV during the study period vs 11.3% (12/106) of patients on hydroxyurea (groups 2 and 3 combined) and 15.0% of patients (6/40) in group 4 (continuous transfusion) (Table 3).
Frequency of TRV category status changes from baseline to year 2 among participants
| Baseline TRV, m/s | 2-y TRV, m/s | All (N = 204) | Group 1 (n = 58) | Group 2 (n = 34) | Group 3 (n = 72) | Group 4 (n = 40) | P |
|---|---|---|---|---|---|---|---|
| ≥2.5 | ≥2.5 | 27 (13) | 7 (12) | 3 (9) | 8 (11) | 9 (22.5) | .32 |
| ≥2.5 | <2.5 | 42 (21) | 11 (19) | 9 (26) | 16 (22) | 6 (15) | .64 |
| <2.5 | ≥2.5 | 29 (14) | 11 (19) | 4 (12) | 8 (11) | 6 (15) | .61 |
| <2.5 | <2.5 | 106 (52) | 29 (50) | 18 (53) | 40 (56) | 19 (47.5) | .85 |
Changes in the percentages of participants with (TRV ≥2.5 m/s) or without (<2.5 m/s) elevated TRV between baseline and year 2 are shown for all patients and by study strata. Data are n (%). Group differences between each TRV threshold status were tested using Fisher’s exact test.
Change in laboratory biomarkers over the study period
We next examined the change in laboratory markers of hemolysis and inflammation and clinical markers (NT-proBNP and UPCR), as well as the frequency of ACS and pain events, within the whole group and in each subgroup over the 2-year period (Table 2). In the entire study population, there was a significant increase in Hb and a decrease in LDH and inflammation (denoted by decreased levels of E-selectin, sVCAM, IL-7, sCD40L, and MIP-1α) over the 2-year period. Group 2 experienced a significant decrease in hemolysis with a corresponding increase in Hb, HbF, and MCV, as well as a decrease in inflammatory markers, all likely attributable to hydroxyurea therapy. In groups 3 and 4, where Hb was stable under hydroxyurea or transfusion exposure, a further improvement in hemolysis or most inflammatory markers was not seen. Group 1 did not have significant worsening of anemia, hemolysis, or inflammatory markers, despite the lack of DMT.
In the entire study population, there were significant decreases in NT-proBNP and UPCR over time (Table 2). Hydroxyurea use was associated with a significant decrease in UPCR in groups 2 and 3. Furthermore, in group 2, with recent hydroxyurea initiation, ACS events decreased by 0.29 (PFDR = .01), whereas in groups 1, 3, and 4, as well as the entire study population, there were no significant changes in the frequency of ACS or pain events.
Correlates of TRV change over time
We next evaluated the association between hemolysis/inflammation markers and the mean TRV trajectory over the 2-year observation period, after adjusting for age at baseline, sex, time point, and group (Table 4). In the overall study population, a 1-g/dL increase in Hb was associated with a 0.03 m/s decrease in TRV (P = .02), and a decrease in ARC of 1.0 × 10⁶/mL was associated with a 0.34-m/s decrease in TRV (P = .03). The magnitude of TRV decrease seen with a decrease in the levels of bilirubin, LDH, and cytokines (E-selectin, IL-4, IFN-α2, MIP-1β), although marginal, was significant at P < .05. However, when corrected for multiple comparisons at PFDR < .05, these hemolysis and inflammation variables were not associated with TRV change.
Associations between each laboratory or clinical marker and TRV as a continuous variable in each group and the entire cohort
| Group 1 | Group 2 | Group 3 | Group 4 | All | |||||||||||
|---|---|---|---|---|---|---|---|---|---|---|---|---|---|---|---|
| Est | SE | Section 1.01 P | Est | SE | Section 1.02 P | Est | SE | Section 1.03 P | Est | SE | Section 1.04 P | Est | SE | Section 1.05 P | |
| Hb* | −0.06 | 0.03 | .04 | −0.06 | 0.03 | .05 | 0.01 | 0.02 | .54 | −0.05 | 0.04 | .17 | −0.03 | 0.01 | .02 |
| ARC* | 0.76 | 0.33 | .02 | 0.15 | 0.36 | .67 | 0.15 | 0.32 | .63 | −0.08 | 0.32 | .81 | 0.34 | 0.16 | .03 |
| LDH | 0.08 | 0.03 | .02 | 0.02 | 0.04 | .57 | 0.03 | 0.03 | .25 | 0.05 | 0.04 | .25 | 0.05 | 0.02 | <.01 |
| Bilirubin | 0.08 | 0.10 | .43 | 0.10 | 0.13 | .46 | 0.09 | 0.09 | .31 | 0.16 | 0.12 | .17 | 0.12 | 0.05 | .02 |
| WBC | 0.20 | 0.12 | .09 | −0.17 | 0.15 | .25 | −0.10 | 0.10 | .34 | −0.18 | 0.14 | .23 | 0.02 | 0.06 | .73 |
| Platelet | 0.02 | 0.04 | .61 | 0.03 | 0.04 | .48 | 0.01 | 0.02 | .77 | 0.04 | 0.04 | .40 | 0.02 | 0.02 | .19 |
| VWF | 0.02 | 0.05 | .63 | −0.02 | 0.06 | .70 | 0.04 | 0.05 | .40 | 0.04 | 0.07 | .62 | 0.03 | 0.03 | .29 |
| FVIII | −0.01 | 0.05 | .81 | 0.01 | 0.06 | .82 | 0 | 0.05 | .95 | 0.01 | 0.07 | .83 | 0.01 | 0.03 | .73 |
| CRP* | 0.01 | 0.05 | .87 | −0.06 | 0.03 | .07 | −0.01 | 0.05 | .81 | 0.04 | 0.21 | .84 | −0.02 | 0.02 | .37 |
| Ferritin | −0.01 | 0.02 | .70 | −0.06 | 0.03 | .06 | −0.01 | 0.01 | .33 | 0 | 0.01 | .66 | −0.01 | 0.01 | .32 |
| E-selectin | 0.05 | 0.04 | .25 | 0.01 | 0.06 | .92 | 0.08 | 0.04 | .06 | 0.12 | 0.08 | .15 | 0.06 | 0.02 | <.01 |
| EGF | −0.02 | 0.02 | .48 | 0.01 | 0.03 | .77 | 0 | 0.02 | .84 | −0.01 | 0.03 | .82 | 0 | 0.01 | .83 |
| IL7 | 0 | 0.07 | .94 | 0.21 | 0.09 | .04 | −0.05 | 0.04 | .15 | −0.01 | 0.06 | .90 | −0.01 | 0.03 | .64 |
| sVCAM | 0.08 | 0.04 | .06 | 0.05 | 0.04 | .25 | −0.01 | 0.03 | .69 | 0.02 | 0.04 | .68 | 0.03 | 0.02 | .15 |
| MIP-1α | 0.01 | 0.01 | .35 | 0 | 0.01 | .85 | −0.01 | 0.01 | .49 | 0.01 | 0.01 | .59 | 0 | 0 | .83 |
| MIP-1β | 0.07 | 0.04 | .07 | 0.06 | 0.06 | .36 | 0.03 | 0.04 | .36 | 0.13 | 0.05 | .02 | 0.06 | 0.02 | <.01 |
| sCD40L | 0 | 0.01 | .70 | 0 | 0.01 | .92 | 0 | 0.01 | .89 | 0 | 0.01 | .81 | 0 | 0.01 | .94 |
| IFN-α2 | 0.03 | 0.02 | .22 | 0.10 | 0.03 | <.01 | −0.01 | 0.02 | .74 | 0.05 | 0.03 | .09 | 0.02 | 0.01 | .04 |
| IL-4 | 0.05 | 0.03 | .13 | 0.08 | 0.04 | .06 | 0 | 0.03 | .88 | 0.04 | 0.03 | .21 | 0.03 | 0.02 | .05 |
| NT-proBNP | 0.04 | 0.02 | .05 | 0.03 | 0.03 | .37 | 0 | 0.02 | .88 | −0.05 | 0.03 | .14 | 0.01 | 0.01 | .31 |
| UPCR | 0.02 | 0.03 | .60 | 0.04 | 0.05 | .41 | 0.04 | 0.02 | .08 | 0.04 | 0.04 | .32 | 0.04 | 0.02 | .01 |
| ACS† | 0.01 | 0.08 | .87 | −0.08 | 0.08 | .27 | 0.01 | 0.04 | .84 | −0.06 | 0.09 | .53 | 0.01 | 0.03 | .86 |
| VOC† | 0.00 | 0.02 | .86 | 0.02 | 0.01 | .04 | 0.00 | 0.01 | .84 | −0.01 | 0.03 | .65 | 0.00 | 0.01 | .55 |
| ACS + VOC† | 0.00 | 0.02 | .89 | 0.02 | 0.01 | .06 | 0.00 | 0.01 | .89 | −0.01 | 0.02 | .56 | 0.00 | 0.01 | .55 |
Slope estimate (Est), standard error (SE), and P values were calculated using LMMs, adjusting age at baseline, sex, time point, and group (only for All). PFDR > .05 for all tests.
VOC, acute (vaso-occlusive) pain crisis; VWF, von Willebrand factor.
With the exception of Hb, ARC, and CRP, the cube root of laboratory values were used in LMMs.
The effect of event counts on TRV, where the estimate is the slope of the regression curve.
In group 1, a decrease in Hb by 1 g/dL was associated with a 0.06-m/s increase in TRV (P = .04). Additionally, worsening hemolysis, based on an increase in ARC by 1.0 × 10⁶/mL, was associated with a 0.76-m/s increase in TRV (P = .02). In group 2, with hydroxyurea initiation, improvement in anemia by 1 g/dL was associated with a 0.06-m/s decrease in TRV (P = .05). Additionally, decreases in the inflammatory cytokines IL-7 and IFN-α2 were associated with a decrease in TRV (P = .04 and P < .01, respectively). However, none of the evaluated variables were found to be associated with the TRV change seen with continuous hydroxyurea therapy (group 3). On the other hand, increases in MIP-1β in group 4 were significantly associated with an increase in TRV (P = .02). Associations between the same biological correlates were made with TRV, but the outcomes were categorized as elevated (TRV ≥2.5 m/s) and nonelevated (TRV <2.5 m/s) (supplemental Table 3). Similar findings related to Hb elevation and ARC decline were observed: a 1-g/dL increase in Hb was associated with a 0.04-unit decrease in the log odds of having elevated TRV (P < .05), and 1.0 × 10⁹/L decrease in ARC was associated with a 0.75-unit decrease in the log odds of having elevated TRV (P < .01) in the entire group. Additionally, increases in LDH (P < .01) and the inflammatory cytokines MIP-1β (P = .01) and IFN-α2 (P = .03) were associated with a small, but significant, increase in the log odds of having TRV ≥2.5 m/s. Similar results were observed in the subgroups analyses, but they were not significant after multiple-comparisons adjustments.
Association between TRV trend and other clinical markers
Finally, we looked at the association between the change in TRV and other clinical markers, including NT-proBNP, UPCR, and the frequency of pain and ACS events. In our entire study population, worsening renal injury was associated with elevated TRV: a 1 cubic root unit increase in UPCR was associated with a 0.04-m/s increase in TRV (P = .01) (Table 4) and a 0.06-unit increase in the log odds of having TRV ≥2.5 m/s (P = .02) (supplemental Table 3). UPCR was associated with a change in the prevalence of elevated TRV only in group 3, whereas under continuous hydroxyurea therapy, a cubic root unit decrease in UPCR was associated with a 0.40-unit decrease in the log odds of having TRV ≥2.5 m/s (P = .04) (supplemental Table 3). In group 2, a decrease in the frequency of acute pain events was associated with a 0.02-m/s decrease in TRV (P = .04; Table 4). However, none of these were significant at PFDR < .05.
Discussion
The poor prognostic implications of elevated TRV in SCA12,13,15,17 underscores the need to evaluate the effectiveness of currently available treatment modalities in reversing or slowing the progression of TRV in SCA as early as in childhood. Our study is one of the largest pediatric prospective longitudinal analyses of the effect of DMTs on the TRV trajectory in SCA. Here, we showed that hydroxyurea use was associated with a small, but significant, decrease in mean TRV over a 2-year period.
At baseline, the prevalence of elevated TRV (≥2.5 m/s) in our patient population was 34%, which is similar to that reported in other pediatric studies (∼30%).19,20,39-41 In this study, the subgroup of untreated HbSS and HbSβ0 thalassemia patients served as the comparison group for the other groups that received DMTs. Although the mean TRV of the untreated subgroup did not change significantly over the observation period, ∼20% of subjects not receiving any DMT developed elevated TRV at the 2-year evaluation compared with 12.3% of subjects who received DMTs. A positive correlation between the degree of hemolysis and TRV elevation has been reported.11,20,31,39,41,42 Furthermore, reticulocytosis has also been associated with cerebrovascular risk, among other SCA complications.43-45 In our study, elevated ARC was the strongest predictor of TRV elevation ≥2.5 m/s (PFDR = .05) among the untreated participants, consistent with prior studies and suggesting that decreasing hemolysis might mitigate TRV progression.
In our previous work, we reported that SCA patients on monthly blood transfusion had a higher prevalence of elevated TRV (51%).22 In this study, the addition of a younger transfusion group of patients (SCCRIP participants) likely explains the lower prevalence of elevated TRV (37.5%) at the baseline evaluation. However, despite transfusion therapy, this subgroup did not experience any decline in TRV over the 2-year study period. These findings are consistent with a previous pediatric longitudinal study in which monthly transfusions were not associated with TRV changes over time.16 Because children in our study received transfusions for primary or secondary stroke prevention, signifying a severe disease phenotype, monthly blood transfusion might not be sufficient to reduce TRV values in 2 years, especially in the setting of irreversible fibrovascular changes secondary to the hemolysis-associated impaired NO bioavailability.42 Monocyte chemokine MIP-1β, which was proposed to have a potential role in SCA vasculopathy,46 appeared to be associated with TRV elevation in this patient subgroup (although the association was not significant after correction for multiple comparisons).
Prior studies have demonstrated the reversibility of TRV elevation with hydroxyurea initiation.31,32,47 However, most of these studies were restricted by their sample size, selection bias, and concomitant use of other clinical therapies, which limited the assessment of the effect of hydroxyurea. We confirmed these findings in our large pediatric cohort, stratified by DMT exposure; a 0.14-m/s decrease in TRV from baseline evaluation was seen in the patient group that was started on hydroxyurea during the study period and had a mean 1.2 years of hydroxyurea exposure. LMMs indicated that the improvement in anemia and decrease in inflammation (IL-7, IFN-α1) seen with hydroxyurea initiation was associated with this decline in mean TRV. Our findings are consistent with prior studies that showed a negative correlation between Hb concentration and TRV elevation.20,31,40 Upregulation of inflammation via abnormal expression of endothelial adhesion molecules (sVCAM, E-selectin),48 platelet activation (sCD40L),49 or angiogenic factors50 has been shown to contribute to the pathogenesis of the vasculopathy in SCA.51 Although we found a decrease in the levels of sVCAM, E-selectin, and sCD40L with the introduction of hydroxyurea, they did not appear to be driving the decrease in TRV. The immune/macrophage signature (IL-7, endothelial injury via recruitment of monocyte/macrophage; IFN-α1, neutrophil activation)52,53 was also decreased with hydroxyurea use and may contribute to a decline in TRV. Finally, a decrease in the frequency of acute pain events during hydroxyurea initiation was associated with an improvement in TRV.
In our previous cross-sectional analyses of the ELYSIS cohort, we reported that children treated with hydroxyurea for a mean of 5.7 years at maximum tolerated dose had a prevalence of elevated TRV that was similar to that seen in untreated children.22 On longitudinal follow-up of this patient subgroup, a 0.11-m/s decrease in mean TRV was seen over the study period. This decline in TRV with continued hydroxyurea therapy was seen in the setting of stable Hb and hemolysis markers, but significantly lower HbF levels (PFDR= .045), at the 2-year-evaluation. The inability of hydroxyurea to decrease TRV, despite reducing hemolysis,16,21,35,54 has been suggested to be secondary to the high HbF levels resulting from hydroxyurea use, which may cause hypoxia-induced vascular remodeling.21 However, in our study, none of the evaluated hematological and inflammatory variables appeared to be predictive of TRV elevation in patients on stable hydroxyurea dose. Additionally, the decrease in the prevalence of elevated TRV in this patient subgroup was associated with an improvement in UPCR. This positive association between proteinuria and TRV elevation confirms prior reports2,4 and highlights the effect of improving the overall disease status with hydroxyurea.
The interpretation of our results is limited by the lack of randomization to DMT and age-matching across the subgroups. The mean age of the untreated subgroup was significantly lower and they had high HbF levels (>10%) in the absence of hydroxyurea treatment, which may reflect an intrinsic ability to produce HbF as a result of favorable genetic variants and might have selected this subgroup for lower disease severity. Furthermore, the size of our study cohort and the median follow-up of 2 years, although more extensive than most longitudinal studies in this age group, might not be sufficient to determine the significance of the modest TRV decrease that we observed with hydroxyurea use. An extended follow-up period might demonstrate the ability of longer exposure to hydroxyurea to slow the rate of TRV progression over time. Additionally, the clinical meaningfulness of the small decrease in TRV that we report is unclear, especially in young patients with SCA, and needs to be studied further. Finally, because all participants had echocardiograms performed at only 2 time points, the reliability of our data is limited by the intrapatient variability in TRV.
In summary, this prospective longitudinal study of TRV showed a potential benefit of DMT in attenuating elevated TRV among children with SCA, particularly with hydroxyurea therapy. TRV elevation is a surrogate marker of disease severity and might be used as a treatment end point during hydroxyurea therapy, because reductions in TRV values correlated with improvements in acute pain and proteinuria. Because the magnitude of this effect was modest, a longer period of observation is necessary to evaluate the long-term effects that reduced hemolysis and inflammation with DMT exposure might have on TRV stabilization or reduction. Although reticulocytosis appeared to be the strongest predictor of TRV elevation, further studies are needed to confirm whether it can be used as a surrogate marker in place of, or in combination with, TRV.
Data sharing requests should be sent to Parul Rai (e-mail: parul.rai@stjude.org).
Acknowledgments
The authors thank Devi Govindaswamy for performing the screening echocardiograms; Courtney Davis, Jason Hodges, Martha Barton, and Jola Dowdy for help with data collection and regulatory matters; Julia Hurwitz for support with analyzing the cytokines; and Russell Ware for support with assembling the ELYSIS study cohort.
This work was supported by National Institutes of Health, National Heart, Lung, and Blood Institute grant U01HL133996 to St Jude Children's Research Hospital.
Authorship
Contribution: P.R. and J.S.H. wrote the manuscript; G.K. and V.I.O. analyzed the data; and J.E.G., V.M.J., K.I.A., A.M.Y., and R.P. critically reviewed the data and edited the manuscript.
Conflict-of-interest disclosure: The authors declare no competing financial interests.
Correspondence: Parul Rai, St Jude Children’s Research Hospital, Division of Pediatric Hematology, 262 Danny Thomas Pl, Mail Stop 800, Memphis, TN 38105; e-mail: parul.rai@stjude.org.

