

Key Points
High VWF plasma levels are associated with increased risk of venous thromboembolism.
The association is strongest for unprovoked events.

Abstract
Several case-control studies have reported elevated plasma von Willebrand factor (VWF) levels in patients with venous thromboembolism (VTE) compared with controls. However, because few studies have investigated the association in a prospective design, it is unclear whether elevated plasma VWF is a risk factor or a consequence of the VTE event. Therefore, we aimed to investigate the prospective association between plasma VWF levels and risk of VTE, as well as to perform subgroup analyses of deep vein thrombosis (DVT) and pulmonary embolism. We established a population-based nested case-control study of 414 VTE cases and 843 age- and sex-matched controls based on the Tromsø study cohort (1994-2007). Blood samples were collected at cohort baseline (1994-1995). Odds ratios (ORs) with 95% confidence intervals (CIs) for VTE were estimated across quartiles of VWF levels. We found that the risk of VTE increased linearly across quartiles of VWF levels (P for trend = .023). Participants with VWF in the highest quartile had an OR of 1.45 (95% CI, 1.03-2.03) for VTE compared with those in the lowest quartile. The association was strongest for unprovoked VTE (OR, 2.74; 95% CI, 1.66-4.54) and unprovoked DVT in particular (OR, 6.73; 95% CI, 3.07-14.76). Further adjustment for body mass index, C-reactive protein, hypertension, estrogen use, and smoking had a modest effect on the risk estimates. To conclude, we found a dose-dependent relationship between plasma VWF levels and future risk of incident VTE, and unprovoked events in particular. Our findings suggest that VWF may represent a promising biomarker for future risk of incident VTE.
Introduction
Venous thromboembolism (VTE), a collective term for deep vein thrombosis (DVT) and pulmonary embolism (PE), is a common disease with important short- and long-term complications, such as recurrence, postthrombotic syndrome, chronic thromboembolic pulmonary hypertension, and death.1-6 In contrast to the declining incidence of arterial cardiovascular disease (CVD), a slight increase in VTE incidence has been observed over the last decades.7-10 This trend is expected to persist as a result of the increasing prevalence of major VTE risk factors, such as advancing age, cancer, and obesity.11,12 To reduce the burden of VTE in the population, it is imperative to identify individuals at high risk and provide targeted prevention. Hence, there is an urgent need to identify novel biomarkers and increase the understanding of causal pathogenic pathways of VTE.
von Willebrand factor (VWF) is a multimer glycoprotein that is synthesized by endothelial cells and megakaryocytes. Endothelial cells are the major cellular source of circulating VWF; therefore, VWF is regarded as a reliable marker of endothelial cell activation.13 Platelets release α-granules containing VWF when activated, whereas endothelial cells combine constitutive secretion and release from Weibel-Palade bodies upon stimulation.14-16 Thrombin generation and acute-phase reactions are among the stimuli that induce release of VWF.17,18 VWF has a dual role in hemostasis: it promotes adhesion and cohesion of platelets by acting as a ligand for their glycoproteins and serves as the carrier and protector for coagulation factor VIII (FVIII).19 Plasma levels of VWF and FVIII are strongly interrelated, and both are associated with the risk of VTE.20-23 However, the majority of data on VWF and VTE risk arises from case-control studies,24-30 which may be susceptible to bias because of reverse causation and selection of controls. Few studies have investigated the relationship between VWF and VTE using a prospective design.21 In the Longitudinal Investigation of Thromboembolism Etiology (LITE) study, a cohort of 19 231 participants with 159 VTE events, VWF and FVIII were linearly associated with increased VTE risk.21 To confirm a temporal relationship between increased levels of VWF and VTE risk, there is a need for more prospective data from unselected populations. Insight into the nature of the association may increase our understanding of the VTE pathophysiology and improve strategies for prevention.
In the present study, we sought to investigate the prospective association between plasma VWF levels and risk of incident VTE, including the subtypes DVT and PE, in a nested case-control study derived from a general population. We hypothesized that individuals with elevated VWF levels would be at higher risk for VTE.
Methods
Study population
The Tromsø Study is a single-center population-based cohort with repeated health surveys of the inhabitants of Tromsø, Norway.31 The present nested case-control study is derived from the fourth survey (Tromsø 4), which was conducted in 1994-1995. All inhabitants aged ≥25 years were invited to participate in this survey; 27 158 individuals (77% of those invited) took part. Participants were followed from the date of inclusion until an incident VTE, migration, death, or end of follow-up (1 September 2007). During follow-up, 462 participants experienced a VTE event. For each case, 2 age- and sex-matched controls were randomly sampled from the parent cohort, and these had to be alive at the index date of the corresponding VTE event. Insufficient quality of plasma samples led to exclusion of 48 cases and 81 controls, resulting in 414 cases and 843 controls in the final analytical sample. A flowchart of study participants is depicted in Figure 1. All participants gave their informed written consent to participate, and the regional committee for medical and health research ethics approved the study.
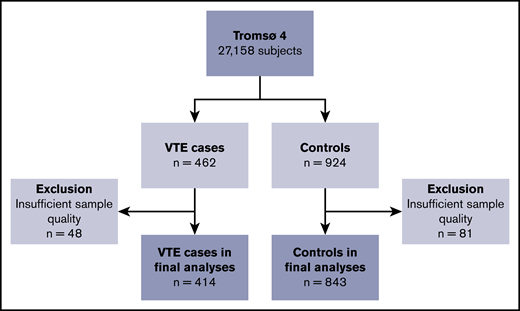
Flowchart of the study population. The chart illustrates the nested case-control design. Subjects were sampled from the general population, aged ≥25 years. Controls were age- and sex-matched with the cases.
Flowchart of the study population. The chart illustrates the nested case-control design. Subjects were sampled from the general population, aged ≥25 years. Controls were age- and sex-matched with the cases.
Identification and adjudication of VTE events
All first lifetime VTE events were identified using the hospital discharge diagnosis registry, the radiology procedure registry, and the autopsy registry at the University Hospital of North Norway, which is the only hospital in the study region. Trained personnel reviewed the medical record of each potential case, and VTE was only registered when clinical signs and symptoms were combined with objective radiological confirmation and resulted in a diagnosis of VTE requiring treatment (unless contraindications were specified). VTE identification and adjudication have been described in detail.32 All events were classified as a DVT or PE and as provoked or unprovoked. In case of simultaneous evidence of DVT and PE, the event was classified as a PE. An event was classified as provoked if it occurred in the presence of ≥1 provoking factor. Surgery or trauma within 8 weeks prior to the event, an acute medical condition (myocardial infarction, ischemic stroke, or infectious disease), active cancer, and marked immobilization (wheelchair confinement or >3 days bed rest) were regarded as provoking factors. Other factors, such as venous catheters, were also recognized as provoking when specifically accentuated by a physician in the medical record.
Baseline measurements
Baseline information was collected through physical examinations, blood samples, and questionnaires. Height (to the nearest centimeter) and weight (to the nearest 0.5 kg) were measured with participants in light clothing and no shoes. Body mass index (BMI) was calculated as weight in kilograms divided by the square of height in meters. Specially trained personnel used an automatic device (Dinamap Vital Signs Monitor) to perform 3 consecutive blood pressure measurements on the upper right arm of all participants. Participants rested in a sitting position for 2 minutes before and between the measurements, and the last 2 measurements were used to calculate the mean systolic and diastolic blood pressure. History of CVD (myocardial infarction, stroke, or angina pectoris) and cancer, as well as estrogen use and smoking, was obtained through self-administered questionnaires.
At baseline, nonfasting blood was collected from an antecubital vein into 5-mL Vacutainers (Becton Dickinson, Le Pont-de-Claix, France) containing EDTA (K3-EDTA 40 µL, 0.37 mol/L per tube) as an anticoagulant. Centrifugation at 3000g at room temperature was done for 10 minutes to prepare platelet-poor plasma. Thereafter, the supernatant was transferred into cryovials (Greiner Laboratechnik, Nürtringen, Germany) in 1-mL aliquots and stored at −80°C until further analysis.
Laboratory analyses
Measurement of VWF and C-reactive protein (CRP) was performed at the Research Institute of Internal Medicine at Oslo University Hospital, Rikshospitalet. Plasma samples were thawed in a water bath for 5 minutes at 37°C before platelet-free plasma was obtained by centrifugation at 13 500g for 2 minutes. Commercially available reagents (R&D Systems, Minneapolis, MN) by enzyme immunoassay (EIA) in a 384 format were used with a SELMA pipetting robot (Jena, Germany) and a BioTek (Winooski, VT) dispenser/washer (EL406) to measure high-sensitivity CRP. Absorption was read at 450 nm using an EIA plate reader (Synergy H1 Hybrid; BioTek) with a wavelength correction set to 540 nm. The intra- and interassay coefficients of variation were 2.6% and 9.1%, respectively.
Plasma VWF levels were measured by EIAs with antibodies (A0082, P02256) obtained from Dako (Glostrup, Denmark) using a polyclonal antibody for coat (A0082) and a horseradish peroxidase–conjugated polyclonal antibody for detection (P02256). Parallel-diluted pooled human plasma from 20 healthy individuals was used as standard, and the mean value in the control population was set to 100%. All other values were adjusted accordingly. The intra- and interassay coefficients of variation were 2.6% and 10.8%, respectively.
Statistical analyses
Statistical analyses were carried out with STATA version 16.0 (Stata Corporation, College Station, TX) and R version 3.6.3 (The R Foundation for Statistical Computing, Vienna, Austria).
Participants were categorized according to quartiles of plasma VWF levels, with cutoffs determined in the control population. Baseline characteristics according to quartiles of VWF were expressed as mean (± standard deviation) or median (25th-75th percentile) for continuous variables and as percentages (quantity) for categorical variables.
Unconditional logistic regression was used to estimate odds ratios (ORs) with 95% confidence intervals (CIs) for VTE according to quartiles of VWF plasma levels. The lowest quartile was used as the reference category. We performed analyses for overall VTE and in subgroups according to VTE location (DVT or PE) and presence of provoking factors (provoked or unprovoked). The P value for linear trend of VTE risk was estimated across increasing quartiles of VWF. The associations were adjusted for age and sex in model 1, with the addition of BMI in model 2 and the further addition of CRP in model 3.
VWF is a modifiable risk factor, and a long follow-up (average follow-up was 7 years) could introduce regression dilution bias and result in underestimated associations.33 To address this, we performed logistic regression analyses with restriction of time from baseline to the VTE event, while keeping all controls in the analyses. These analyses generated ORs at every 0.1-year increase in time from baseline and plotted them as a function of this maximum time. Analyses were set to require ≥10 VTE events.
Results
The distribution of baseline characteristics across quartiles of plasma VWF levels is shown in Table 1. The mean age, proportion of women, and participants with hypertension increased across the quartiles. In the lowest quartile, history of CVD was less frequent, whereas smoking was more common compared with the other quartiles. Mean BMI, median CRP, history of cancer, and daily estrogen use were similar across VWF quartiles.
Distribution of baseline characteristics according to quartiles of plasma levels of VWF
| Plasma VWF, % | ||||
|---|---|---|---|---|
| Quartile 1 (<88.5) | Quartile 2 (88.5-94.6) | Quartile 3 (94.7-104.7) | Quartile 4 (≥104.7) | |
| n | 298 | 305 | 315 | 339 |
| Age, y | 56.4 ± 14.1 | 58.9 ± 14.1 | 61.3 ± 12.8 | 63.9 ± 13.0 |
| Males | 49.7 (148) | 47.9 (146) | 46.7 (147) | 44.5 (151) |
| BMI, kg/m2 | 25.5 ± 3.8 | 26.8 ± 4.5 | 26.1 ± 3.7 | 27.0 ± 4.8 |
| CRP, mg/L | 1.29 (0.65-2.35) | 1.05 (0.59-1.90) | 1.14 (0.65-1.88) | 1.36 (0.72-2.36) |
| Hypertension* | 49.8 (148) | 55.6 (169) | 54.9 (173) | 62.2 (211) |
| Cancer† | 4.8 (12) | 6.2 (15) | 8.1 (20) | 4.3 (11) |
| CVD† | 10.1 (30) | 17.4 (53) | 18.7 (59) | 16.8 (57) |
| Estrogen use‡ | 4.4 (13) | 4.3 (13) | 5.7 (18) | 4.7 (16) |
| Smoking‡ | 45.3 (135) | 28.2 (86) | 23.5 (74) | 26.3 (89) |
Continuous variables are shown as mean (± standard deviation) or median (25th-75th percentile). Categorical variables are shown as percentages (n).
Defined as systolic blood pressure ≥140 mm Hg or diastolic blood pressure ≥90 mm Hg.
Self-reported history of cancer or myocardial infarction, angina, or stroke (CVD) at baseline.
Self-reported daily use of oral contraceptives or hormonal replacement therapy (estrogen use) or smoking of cigarettes or cigars (smoking).
Characteristics of the VTE events are reported in Table 2. Mean age at the VTE event was 67.5 ± 13.6 years, and the proportion of men was 48.3%. DVTs constituted 62.6% of all VTE events, and 58.2% were classified as provoked VTEs.
Characteristics of VTE events (n = 414)
| Characteristics | Data |
|---|---|
| Age at VTE, y | 67.5 ± 13.6* |
| Males | 48.3 (200) |
| DVT | 62.6 (259) |
| PE | 37.4 (155) |
| Unprovoked VTE | 41.8 (173) |
| Provoked VTE | 58.2 (241) |
| Characteristics | Data |
|---|---|
| Age at VTE, y | 67.5 ± 13.6* |
| Males | 48.3 (200) |
| DVT | 62.6 (259) |
| PE | 37.4 (155) |
| Unprovoked VTE | 41.8 (173) |
| Provoked VTE | 58.2 (241) |
Unless otherwise noted, data are % (n).
Mean ± standard deviation.
The ORs for VTE by quartiles of plasma VWF levels are shown in Table 3. For overall VTE, the ORs increased across quartiles of VWF in the age- and sex-adjusted model (model 1: P for trend = .023). Subjects with plasma VWF levels in the highest quartile had a 1.5-fold higher OR for VTE (OR, 1.45; 95% CI, 1.03-2.03) compared with subjects with plasma VWF levels in the lowest quartile. Further adjustment for BMI and CRP (model 2) and hypertension, estrogen use, and smoking (model 3) attenuated the ORs only slightly.
ORs with 95% CIs for overall VTE and subgroups according to quartiles of VWF plasma levels
| VTE subgroup | Controls (n = 843) | Cases | Model 1 | Model 2 | Model 3 |
|---|---|---|---|---|---|
| Overall VTE | n = 414 | ||||
| VWF Q1 | 210 | 88 | Ref. | Ref. | Ref. |
| VWF Q2 | 211 | 94 | 1.07 (0.75-1.51) | 1.03 (0.72-1.46) | 1.03 (0.72-1.48) |
| VWF Q3 | 210 | 105 | 1.20 (0.85-1.70) | 1.20 (0.85-1.69) | 1.20 (0.84-1.71) |
| VWF Q4 | 212 | 127 | 1.45 (1.03-2.03) | 1.35 (0.96-1.90) | 1.36 (0.96-1.92) |
| P value for trend | .02 | .05 | .05 | ||
| Provoked VTE | n = 241 | ||||
| VWF Q1 | 210 | 62 | Ref. | Ref. | Ref. |
| VWF Q2 | 211 | 56 | 0.89 (0.59-1.34) | 0.86 (0.56-1.30) | 0.87 (0.57-1.33) |
| VWF Q3 | 210 | 62 | 0.97 (0.65-1.46) | 0.96 (0.64-1.45) | 0.98 (0.65-1.49) |
| VWF Q4 | 212 | 61 | 0.94 (0.62-1.41) | 0.88 (0.58-1.34) | 0.90 (0.59-1.37) |
| P value for trend | .9 | .7 | .8 | ||
| Unprovoked VTE | n = 173 | ||||
| VWF Q1 | 210 | 26 | Ref. | Ref. | Ref. |
| VWF Q2 | 211 | 38 | 1.50 (0.88-2.57) | 1.49 (0.86-2.57) | 1.46 (0.84-2.52) |
| VWF Q3 | 210 | 43 | 1.75 (1.03-2.97) | 1.78 (1.04-3.03) | 1.72 (1.00-2.94) |
| VWF Q4 | 212 | 66 | 2.74 (1.66-4.54) | 2.59 (1.55-4.32) | 2.52 (1.51-4.22) |
| P value for trend | <.001 | <.001 | <.001 |
Model 1: adjusted for age and sex. Model 2: model 1 + BMI and CRP. Model 3: model 2 + smoking, hypertension, and estrogen use.
Q, quartile; Ref., reference.
Subgroup analyses revealed that elevated plasma levels of VWF were associated with an increased risk for unprovoked VTE (Table 3) and DVT (Table 4), whereas no association was observed for provoked VTE and PE. Compared with the lowest quartile, plasma VWF levels in the highest quartile yielded age- and sex-adjusted ORs of 2.74 (95% CI, 1.66-4.54; P for trend < .001) for unprovoked VTE, 1.63 (95% CI, 1.09-2.43; P for trend = .011) for DVT, and 6.73 (95% CI, 3.07-14.76; P for trend < .001) for unprovoked DVT. Similar to overall VTE, additional adjustment for BMI, CRP, hypertension, estrogen use, and smoking did not influence the risk estimates substantially.
ORs with 95% CIs for overall, provoked, and unprovoked DVT and PE, according to quartiles of plasma VWF level
| VTE subgroup | Controls (n = 843) | Cases | Model 1 | Model 2 | Model 3 |
|---|---|---|---|---|---|
| Overall DVT | n = 259 | ||||
| VWF Q1 | 210 | 53 | Ref. | Ref. | Ref. |
| VWF Q2 | 211 | 57 | 1.08 (0.71-1.65) | 1.07 (0.70-1.64) | 1.06 (0.69-1.63) |
| VWF Q3 | 210 | 65 | 1.26 (0.83-1.90) | 1.26 (0.83-1.90) | 1.23 (0.81-1.87) |
| VWF Q4 | 212 | 84 | 1.63 (1.09-2.43) | 1.52 (1.01-2.29) | 1.49 (0.99-2.25) |
| P value for trend | 0.01 | 0.03 | 0.04 | ||
| Provoked DVT | n = 156 | ||||
| VWF Q1 | 210 | 45 | Ref. | Ref. | Ref. |
| VWF Q2 | 211 | 36 | 0.79 (0.49-1.27) | 0.78 (0.48-1.27) | 0.78 (0.48-1.27) |
| VWF Q3 | 210 | 38 | 0.82 (0.51-1.33) | 0.83 (0.51-1.33) | 0.83 (0.51-1.34) |
| VWF Q4 | 212 | 37 | 0.78 (0-48-1.28) | 0.74 (0.45-1.21) | 0.74 (0.45-1.22) |
| P value for trend | .4 | .3 | .3 | ||
| Unprovoked DVT | n = 103 | ||||
| VWF Q1 | 210 | 8 | Ref. | Ref. | Ref. |
| VWF Q2 | 211 | 21 | 2.73 (1.18-6.33) | 2.78 (1.19-6.47) | 2.73 (1.17-6.40) |
| VWF Q3 | 210 | 27 | 3.74 (1.65-8.47) | 3.79 (1.66-8.62) | 3.59 (1.57-8.23) |
| VWF Q4 | 212 | 47 | 6.73 (3.07-14.76) | 6.40 (2.90-14.12) | 6.18 (2.78-13.70) |
| P value for trend | <.001 | <.001 | <.001 | ||
| Overall PE | n = 155 | ||||
| VWF Q1 | 210 | 35 | Ref. | Ref. | Ref. |
| VWF Q2 | 211 | 37 | 1.04 (0.63-1.72) | 0.96 (0.58-1.61) | 0.99 (0.59-1.67) |
| VWF Q3 | 210 | 40 | 1.12 (0.68-1.84) | 1.10 (0.67-1.83) | 1.15 (0.69-1.92) |
| VWF Q4 | 212 | 43 | 1.18 (0.72-1.93) | 1.11 (0.67-1.84) | 1.14 (0.69-1.91) |
| P value for trend | .5 | .6 | .5 | ||
| Provoked PE | n = 85 | ||||
| VWF Q1 | 210 | 17 | Ref. | Ref. | Ref. |
| VWF Q2 | 211 | 20 | 1.15 (0.59-2.27) | 1.05 (0.53-2.10) | 1.14 (0.56-2.31) |
| VWF Q3 | 210 | 24 | 1.36 (0.70-2.63) | 1.32 (0.68-2.56) | 1.43 (0.72-2.83) |
| VWF Q4 | 212 | 24 | 1.33 (0.69-2.57) | 1.24 (0.63-2.42) | 1.33 (0.67-2.64) |
| P value for trend | .4 | .4 | .3 | ||
| Unprovoked PE | n = 70 | ||||
| VWF Q1 | 210 | 18 | Ref. | Ref. | Ref. |
| VWF Q2 | 211 | 17 | 0.94 (0.47-1.88) | 0.90 (0.44-1.83) | 0.88 (0.43-1.80) |
| VWF Q3 | 210 | 16 | 0.89 (0.44-1.80) | 0.89 (0.43-1.82) | 0.89 (0.43-1.84) |
| VWF Q4 | 212 | 19 | 1.04 (0.52-2.08) | 0.98 (0.49-1.98) | 0.97 (0.48-1.96) |
| P value for trend | .9 | .9 | .9 |
Model 1: adjusted for age and sex. Model 2: model 1 + BMI and CRP. Model 3: model 2 + smoking, hypertension, and estrogen use.
To assess whether the risk estimates were subjected to regression dilution bias, we estimated ORs for VTE in those with high (quartile 4) vs low (quartile 1) plasma VWF as a function of time between baseline blood sampling and the VTE events. As depicted in Figure 2, the association between plasma levels of VWF and VTE risk was not substantially diluted during follow-up.
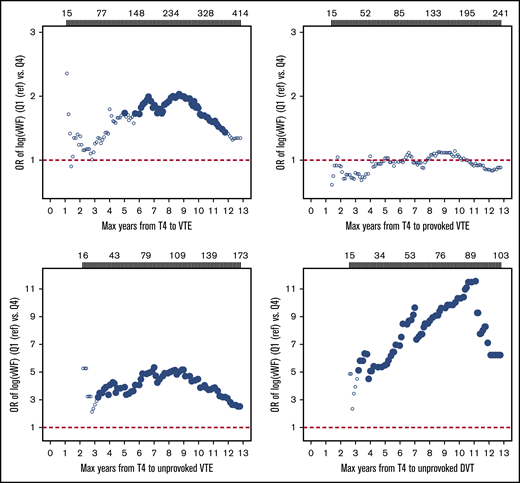
Plots of estimated ORs for overall, provoked, and unprovoked VTE and unprovoked deep vein thrombosis as a function of time from baseline (1994-1995) to VTE events. Participants with plasma VWF levels in the highest quartile were compared with those with levels in the lowest quartile (Q4 vs Q1). Analyses were adjusted for age and sex. Filled symbols indicate ORs with P < .05. Number of VTE events according to time of follow-up are provided above the plots. Max, maximum; T4, Tromsø 4 survey.
Plots of estimated ORs for overall, provoked, and unprovoked VTE and unprovoked deep vein thrombosis as a function of time from baseline (1994-1995) to VTE events. Participants with plasma VWF levels in the highest quartile were compared with those with levels in the lowest quartile (Q4 vs Q1). Analyses were adjusted for age and sex. Filled symbols indicate ORs with P < .05. Number of VTE events according to time of follow-up are provided above the plots. Max, maximum; T4, Tromsø 4 survey.
Discussion
In this population-based nested case-control study, we observed a dose-dependent association between plasma levels of VWF and future risk of incident VTE. Participants in the highest quartile had a 1.5-fold higher OR for VTE than did those in the lowest quartile after adjustment for age and sex. The association was strongest for unprovoked DVT, with an OR of 6.7 in the highest quartile. The risk estimates were only slightly attenuated after adjustment for BMI, CRP, hypertension, estrogen use, and smoking. Analyses with restricted follow-up time showed that the association remained throughout the 13-year study period. Our findings suggest that VWF may serve as a biomarker to predict first lifetime VTE and implies a role for early platelet and endothelial cell activation in the pathogenesis of VTE.
The association between VWF and VTE risk was first recognized in 1995, when Koster and colleagues reported a higher OR for DVT among participants with elevated levels of VWF in the Leiden Thrombophilia case-control study.28 The association was replicated in several case-control studies,24,26,27,29,34 most recently in the MEGA study, in which a dose-dependent relationship was also demonstrated at extreme plasma levels of VWF.30 On a general basis, case-control studies have the important drawback that plasma samples are collected after the VTE event. Although data from the MEGA study suggested that plasma VWF levels remain stable after the initial treatment period,30 it is still debated whether these VWF levels reflect a higher risk for VTE or merely a consequence of the acute event itself.28,30 Few prospective studies have investigated the association between VWF and VTE risk. In the LITE study, a dose-dependent relationship between plasma VWF levels and future risk of VTE was observed in middle-aged participants (age 45-64 years at baseline) from the Atherosclerosis Risk in the Community cohort across 8 years of follow-up, whereas results from the Cardiovascular Health Study cohort with older individuals (age > 65 years at baseline) were inconclusive.21 Although there were few events (n = 65) in the Cardiovascular Health Study, it may be speculated that elevated VWF levels better reflect VTE risk in the younger population. Notably, the association between VWF and VTE risk in the Atherosclerosis Risk in the Community also remained after 13 years of follow-up.35 In a prospective nested case-control study from the Women’s Health Initiative trials, an association with VTE was observed when VWF was modeled continuously but not when it was dichotomized at the 75th percentile.36 In the present study, we add important prospective evidence on the association between plasma VWF and the risk of incident VTE in men and women of a wider age range and extend previous knowledge by showing that the association appears to be mainly driven by unprovoked events and DVT in particular.
Although plasma levels of VWF are influenced by environmental factors, it is estimated that genetic variation accounts for up to 65% of the interindividual variability.37 Genome-wide association studies have shown that VWF levels are regulated by several genetic loci; 19 loci have been identified so far.38,39 In recent years, VWF has been explored as a causal risk factor for VTE. Mendelian randomization analyses of a recent INVENT consortium meta-analysis of genome-wide association study results from 46 354 individuals reported that a 1 standard deviation increase in genetically predicted VWF levels was associated with a 2.4-fold increased OR for VTE, supporting a causal association.38,40 At the individual level, plasma VWF levels are highly modifiable and influenced by several factors, such as menstrual cycle, pregnancy, exercise, aging, circadian rhythm, cigarette smoke, and air pollution.37 Because of the fluctuating nature of VWF, prospective studies with a long follow-up period may be subject to regression dilution and underestimation of the true association.33 However, in the present study we found that the association between plasma VWF levels and VTE risk persisted throughout the entire follow-up period (average duration was 7.1 years). Interestingly, the Women’s Health Initiative study found that a larger 1-year increase in VWF levels was not associated with VTE risk.36 This may imply that basal plasma levels, rather than short-term fluctuations in plasma levels, of VWF (eg, due to acute-phase reactions) are important for the VTE risk. Taken together, this underscores that VWF is a reliable biomarker and suggests that genetic predisposition likely outweighs the modification through environmental and acquired factors. Notably, recent findings imply that VWF may represent a promising therapeutic target,13,41 as well as a biomarker that may be part of a comprehensive risk-assessment model.
VWF is an unspecific biomarker, and elevated levels indicate platelet activation and, in particular, endothelial cell activation.13 In recent years, VWF has been recognized as a risk factor for several conditions, in the presence and absence of inflammation.42-45 Although the role of VWF in hemostasis is well described, its etiological role in thrombogenesis remains to be fully understood. In their case-control study, Koster and colleagues reported that the univariate association between VWF and VTE risk disappeared after adjustment for FVIII.28 On this basis, it was concluded that the association between VWF and VTE probably is biologically mediated through increased FVIII levels.28 Currently, no locus has been identified to influence VWF levels independent of FVIII; therefore, this hypothesis could not be tested in a Mendelian randomization design.38 Because circulating FVIII is primarily determined by VWF, FVIII and VWF have been proposed as reasonable targets for prevention and treatment of VTE.41 On the contrary, the VWF-platelet interaction has been suggested to be of importance primarily in arterial thromboses, and there are ongoing trials investigating the effect of selective VWF antagonists on coronary artery disease and stroke.46 Interestingly, mouse studies have recently suggested a critical role for VWF in venous thrombus formation also in the absence of FVIII,47 suggesting that VWF may represent a promising therapeutic target also in venous thrombosis.13
In subgroup analyses, we observed that VWF was primarily associated with the risk of DVT and unprovoked VTE events. Higher levels of FVIII have been observed in patients with unprovoked VTE,34 and elevated FVIII levels were more prevalent in patients with DVT compared with PE.48 However, we are not aware of any previous studies investigating VWF and VTE risk according to these subgroups. The association with unprovoked events suggests that elevated plasma VWF levels relate to VTE risk in the absence of known provoking factors, which may strengthen the interpretation of a causal association.49 Although PE and DVT are regarded as 2 entities of the same disease, there are several examples of risk factors with a differential impact on the presenting location of VTE.50 Of these, the most prominent is the factor V Leiden (FVL) paradox; the FVL mutation increases the risk of DVT but not PE.51 A proposed mechanism hypothesized from experiments in mice is that FVL is associated with enhanced thrombin generation, resulting in larger and more stable thrombi that are less prone to embolization.51,52 This hypothesis may also pertain to VWF, because individuals with elevated plasma VWF levels are likely to have a higher endogenous thrombin potential because of the concomitantly elevated FVIII levels.53 Another potential mechanism is that elevated VWF levels facilitate more stable thrombi through the adhesion to integrin αIIbβ3 on activated platelets,54 resulting in a tighter anchorage of the platelets to each other and to the endothelial wall.13
The strengths of this study include the nested case-control design with a large sample of VTE patients and age- and sex-matched controls recruited from the same population-based cohort. The prospective design provided the possibility to gain insight into the temporal sequence between VWF and VTE risk. Because there is only 1 hospital in the study area providing VTE diagnostics and treatment, it is likely that a negligible amount of VTE cases were missed. This study also has some limitations that need mentioning. The vast majority of study participants were white; therefore, we encourage caution when extrapolating these findings to other ethnicities. Blood samples were drawn in 1994-1995 and stored for >20 years. This long storage time may have affected the plasma VWF levels, but it is likely that such an effect would be similar in cases and controls and not influence the relative differences between them. Moreover, because the intraindividual plasma VWF levels may have changed during the long follow-up (mean 7.1 years), a single baseline measurement of VWF at baseline could yield results subjected to regression dilution bias and underestimated associations. However, we did not observe evidence of regression dilution in our analyses, and the ORs for VTE according to quartiles of plasma VWF levels remained significant throughout the entire study period.
In conclusion, we found that higher plasma levels of VWF were associated with increased risks of incident VTE. The association was particularly strong for unprovoked DVT, and the increased VTE risk remained throughout the study period. Our findings suggest that VWF may serve as a reliable biomarker for future risk of VTE.
Data sharing requests should be sent to Magnus S. Edvardsen (magnus.s.edvardsen@uit.no).
Acknowledgment
The K. G. Jebsen Thrombosis Research and Expertise Center is supported by an independent grant from Stiftelsen Kristian Gerhard Jebsen.
Authorship
Contribution: M.S.E. performed statistical analyses, interpreted data, and wrote the manuscript; K.H. and L.H.E. performed statistical analyses, interpreted data, and revised the manuscript; E.-S.H., V.M.M., and S.K.B. revised the manuscript; T.U. and P.A. performed laboratory analyses and revised the manuscript; and J.-B.H. conceived and designed the study, interpreted data, and revised the manuscript.
Conflict-of-interest disclosure: The authors declare no competing financial interests.
Correspondence: Magnus S. Edvardsen, K. G. Jebsen Thrombosis Research and Expertise Center, Department of Clinical Medicine, The University of Tromsø–The Arctic University of Norway, PO Box 6050, N-9037 Tromsø, Norway; e-mail: magnus.s.edvardsen@uit.no.

