

Key Points
RAC2, a known regulator of cell adhesion, was suppressed at both the RNA and protein levels by ibrutinib only in ibrutinib-sensitive MCL cells.
RAC2 links a BCR-signaling pathway to cell adhesion, partially through its physical association with BLNK, a BCR adaptor protein.

Abstract
Inhibition of the B-cell receptor (BCR) signaling pathway is highly effective in B-cell neoplasia through Bruton tyrosine kinase inhibition by ibrutinib. Ibrutinib also disrupts cell adhesion between a tumor and its microenvironment. However, it is largely unknown how BCR signaling is linked to cell adhesion. We observed that intrinsic sensitivities of mantle cell lymphoma (MCL) cell lines to ibrutinib correlated well with their cell adhesion phenotype. RNA-sequencing revealed that BCR and cell adhesion signatures were simultaneously downregulated by ibrutinib in the ibrutinib-sensitive, but not ibrutinib-resistant, cells. Among the differentially expressed genes, RAC2, part of the BCR signature and a known regulator of cell adhesion, was downregulated at both the RNA and protein levels by ibrutinib only in sensitive cells. RAC2 physically associated with B-cell linker protein (BLNK), a BCR adaptor molecule, uniquely in sensitive cells. RAC2 reduction using RNA interference and CRISPR impaired cell adhesion, whereas RAC2 overexpression reversed ibrutinib-induced cell adhesion impairment. In a xenograft mouse model, mice treated with ibrutinib exhibited slower tumor growth, with reduced RAC2 expression in tissue. Finally, RAC2 was expressed in ∼65% of human primary MCL tumors, and RAC2 suppression by ibrutinib resulted in cell adhesion impairment. These findings, made with cell lines, a xenograft model, and human primary lymphoma tumors, uncover a novel link between BCR signaling and cell adhesion. This study highlights the importance of RAC2 and cell adhesion in MCL pathogenesis and drug development.
Introduction
B-cell receptor (BCR) signaling is chronically active in several mature B-cell malignancies, including chronic lymphocytic leukemia (CLL), mantle cell lymphoma (MCL), and the ABC subtype of diffuse large B-cell lymphoma (DLBCL).1 The signal starts at the cell membrane with ligation of BCRs by antigen. Through a cascade of tyrosine phosphorylation events, LYN, SYK, and, subsequently, Bruton tyrosine kinase (BTK) and phospholipase Cγ2 (PLCγ2) are activated. B-cell linker protein (BLNK), an adaptor molecule, provides a platform for interactions between SYK, BTK, and PLCγ2 to facilitate the kinase reactions. Downstream AKT serine/threonine kinase 1 (AKT), extracellular signal-regulated kinase (ERK), and NF-κB are then activated to promote cell survival, proliferation, and differentiation. Inhibition of the BCR pathway is highly effective in B-cell neoplasia and can be achieved at the cellular level through LYN inhibition by dasatinib,2-4 SYK inhibition by fostamatinib and GS-9973,5-7 BTK inhibition by ibrutinib and acalabrutinib,8 and phosphatidylinositol 3-kinase (PI3K) inhibition through idelalisib or duvelisib.9,10
In addition to BCR signaling, cell adhesion has been increasingly recognized as playing an important role in the pathogenesis of lymphoma. Using an established mouse model of B-cell lymphoma, an in vivo RNA interference loss-of-function screening found that genes involved in cell adhesion and cell migration are among the most essential genes lymphoma cells rely on for tumor growth.11
Interestingly, the importance of cell adhesion is also shown in patients receiving ibrutinib treatment. Ibrutinib is an inhibitor of BTK, a key component of the proximal BCR signaling pathway. Ibrutinib binds to BTK through the C481 residue, and loss of BTK binding via mutation at C481 confers drug resistance.8,12-17 Shortly after ibrutinib initiation, patients experience transient peripheral lymphocytosis that is accompanied by a later reduction in lymphadenopathy. This phenomenon is seen in both CLL and MCL patients receiving ibrutinib.18,19 The lymphocytosis is believed to be a result of compartment shifts of tumor cells from lymphoid tissue to the periphery as a consequence of the inhibitory effects of ibrutinib on tumor cell adhesion to tissue stroma. Impaired homing of circulating CLL cells back to tissue also contributes to lymphocytosis.20 In vitro, the BTK inhibitor affects anti– immunoglobulin M (IgM)-induced CLL cell adhesion to fibronectin and to VCAM-1, which is mediated through very late antigen-4 (VLA-4) integrin on tumor cells. The drug also inhibits, to a lesser degree, chemokine CXCL12-induced cell adhesion to VCAM-1.21 Cell adhesion impairment was also observed in vivo. Using serial blood samples collected from patients with CLL before and after ibrutinib treatment, ex vivo adhesion of collected CLL cells to fibronectin was rapidly and completely inhibited, and this action is accompanied by the downregulation of surface VLA-4 on CLL cells.22
Notably, drug-induced peripheral lymphocytosis is not unique to ibrutinib; it seems to be a common phenomenon related to several anti–BCR-targeted therapies, including inhibitors of LYN,23 SYK,5,6 and PI3Kδ.9,10 This class action raised a question regarding whether the BCR pathway is connected to the cell adhesion phenotype, and if yes, how it occurs. Understanding the molecular mechanism of how these 2 pathways are linked is of significant biologic, pharmacologic, and clinical interest at the present time.
Methods
Drug, antibodies, and other reagents
Dimethyl sulfoxide (DMSO), methylcellulose, and goat anti-RAC2 antibody were purchased from Sigma-Aldrich (St Louis, MO). Ibrutinib was purchased from Selleck Chemicals (Houston, TX).
Patient samples
A total of 29 MCL, 5 tonsil formalin-fixed, paraffin-embedded samples, and 12 frozen samples were used for the study. Formalin-fixed, paraffin-embedded samples were retrieved from the archives of the Department of Pathology, Fudan University Shanghai Cancer Center. The use of human samples was approved by the ethical committee of Fudan University Shanghai Cancer Center. Six frozen MCL samples were obtained from the Cancer Cytogenetic Laboratory at the University of Chicago, and 6 other frozen samples were obtained from the MD Anderson Cancer Center after institutional review board review and approval. Viability of the freeze-thawed samples varies from case to case; only samples with >60% viability were selected for the current study.
Cell lines and culture conditions
Authenticated human MCL cell lines JeKo-1, Mino, Granta-519, JVM-2, Rec-1, and MAVER-1 were purchased from Deutsche Sammlung von Mikroorganismen and Zellkulturen GmbH (Braunschweig, Germany) and American Type Culture Collection (Manassas, VA), respectively. All cell lines were cultured in RPMI 1640 medium supplemented with 10% fetal bovine serum and 100 µg/mL penicillin/streptomycin in a humidified 37°C and 5% carbon dioxide incubator. Primary cells were cocultured with NKTert or HS-5 stromal cell lines.
Statistical analyses
Comparisons of continuous variables were analyzed by using an unpaired Student t test or Mann-Whitney U test. All analyses were performed by using Stata program version 11.0 (StataCorp LP, College Station, TX) or otherwise indicated. A value of P < .05 was considered significant.
Additional methods
The supplemental Methods provides details on cell metabolic activity and cell growth assays, cell adhesion assay, stable expression of tdTomato-hCD40L-BMF, immunofluorescence and confocal microscopy, RNA sequencing (RNA-Seq) and data analyses, immunohistochemistry, immunoblotting and coimmunoprecipitation, immunofluorescence and confocal microscopy, RAC2 plasmid construction, small interfering RNA (siRNA) and nucleofection, CRISPR-Cas9 knockout, and xenograft analysis.24-30
Results
MCL cell lines have variable intrinsic sensitivity to ibrutinib
Previously, we showed that MCL cell lines display variable intrinsic sensitivity to ibrutinib.31 The 50% inhibitory concentration (IC50) values of ibrutinib in 6 individual MCL cell lines, determined according to MTT assay, ranged from 0.60 to 8.26 µmol/L (supplemental Figure 1A). Clinically achievable concentrations of ibrutinib were used to define and categorize cell line sensitivity to ibrutinib. Because the maximum serum concentration of ibrutinib in patients is ∼0.4 µmol/L,19,31 the cell line JeKo-1was defined as sensitive with an IC50 of 0.60 µmol/L; Mino, Rec-1, and JVM-2 as intermediate with an IC50 of 1.1 to 1.5 µmol/L; and MAVER-1 and Granta-519 as resistant with an IC50 >2.7 µmol/L. This sensitivity profile of MCL cell lines is largely consistent with what has been reported by others.32 In the current study, we first determined drug sensitivity to ibrutinib in the MCL lines with respect to cell growth (supplemental Figure 1B). The results were largely consistent with the MTT data, and the same designations of sensitivity for these cell lines are thus maintained for the current study (Figure 1A).
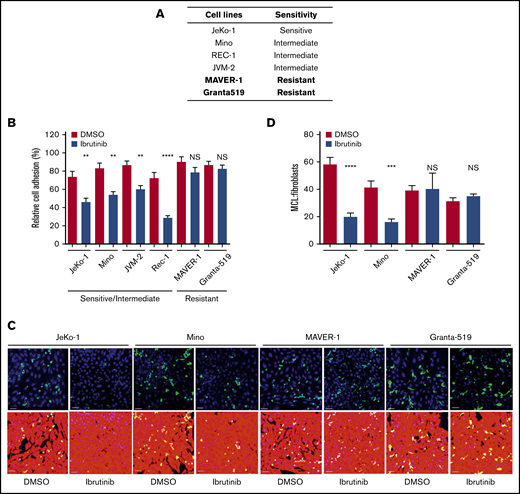
Cell adhesion is impaired by ibrutinib in ibrutinib-sensitive cell lines, but not in ibrutinib-resistant cell lines. (A) Sensitivity of MCL cell lines to ibrutinib according to both cell growth and MTT assay.33 (B) Cell adhesion assay of various MCL cell lines treated with ibrutinib. MCL cells were fluorescently labeled with anti-IgM antibody and allowed to adhere to unlabeled pre-plated NKTert cells in the presence or absence of ibrutinib 400 nM. After 24 hours of culture, plates were washed with saline, and attached and labeled MCL cells were then counted. Data shown represent 1 of the 3 independent experiments. Error bars represent mean ± SEM of 6 replicate reactions. (C) Confocal microscopy images of MCL (green) cells and BMF (red) cells after treatment with DMSO or ibrutinib 400 nM for 24 hours. DAPI staining was added to aid with cell counting. Scale bar, 50 µm. A 3 × 3 montage with z-stack was performed for 4 random fields per treatment. The assay was repeated twice in duplicate. (D) Quantitation of confocal images using the ImageJ cell counter (National Institutes of Health, Bethesda, MD). MCL and BMFs were counterstained with DAPI, and all nuclei were counted. The MCL cells were manually counted by using the cell counter plug-in. The number of BMFs per field was determined by subtracting the number of MCL (green) cells from the total number of nuclei. The ratio of MCL:BMFs was then calculated as a measure of cell adhesion. Error bars represent mean ± SEM. Statistical analysis was done by using an unpaired Student t test. **P < .01; ***P < .0005; ****P < .0001. NS, not significant.
Cell adhesion is impaired by ibrutinib in ibrutinib-sensitive cell lines, but not in ibrutinib-resistant cell lines. (A) Sensitivity of MCL cell lines to ibrutinib according to both cell growth and MTT assay.33 (B) Cell adhesion assay of various MCL cell lines treated with ibrutinib. MCL cells were fluorescently labeled with anti-IgM antibody and allowed to adhere to unlabeled pre-plated NKTert cells in the presence or absence of ibrutinib 400 nM. After 24 hours of culture, plates were washed with saline, and attached and labeled MCL cells were then counted. Data shown represent 1 of the 3 independent experiments. Error bars represent mean ± SEM of 6 replicate reactions. (C) Confocal microscopy images of MCL (green) cells and BMF (red) cells after treatment with DMSO or ibrutinib 400 nM for 24 hours. DAPI staining was added to aid with cell counting. Scale bar, 50 µm. A 3 × 3 montage with z-stack was performed for 4 random fields per treatment. The assay was repeated twice in duplicate. (D) Quantitation of confocal images using the ImageJ cell counter (National Institutes of Health, Bethesda, MD). MCL and BMFs were counterstained with DAPI, and all nuclei were counted. The MCL cells were manually counted by using the cell counter plug-in. The number of BMFs per field was determined by subtracting the number of MCL (green) cells from the total number of nuclei. The ratio of MCL:BMFs was then calculated as a measure of cell adhesion. Error bars represent mean ± SEM. Statistical analysis was done by using an unpaired Student t test. **P < .01; ***P < .0005; ****P < .0001. NS, not significant.
Cell adhesion is impaired by ibrutinib in ibrutinib-sensitive cell lines but not in ibrutinib-resistant cell lines
Previously, we showed that MCL cell lines display differential survival and cell cycle responses to ibrutinib treatment. We found that genetic reduction of BTK decreases growth, survival, and proliferation of sensitive but not resistant MCL cells. Other investigators have shown that ibrutinib impairs cell adhesion in CLL.34,35 Based on these findings, our goal was to determine if cell line sensitivity to ibrutinib is related to their adhesion to the NKTert stromal cell line.
To obtain clinically relevant results, 400 nM (0.4 µmol/L), which is the maximal achievable concentration in patients, was selected to conduct this and all subsequent experiments. At this concentration, BTK activity, measured by phosphorylation of BTK at tyrosine 223, was effectively inhibited, as we reported previously.31 As shown in Figure 1B, ibrutinib treatment reduced MCL adhesion to stromal cells in the ibrutinib–sensitive/intermediate cell lines (JeKo-1, Mino, JVM-2, and Rec-1) but not in the ibrutinib-resistant cell lines (MAVER-1 and Granta-519). During ibrutinib treatment, no overt cell death in either MCL cells (supplemental Figure 1B) or NKTert cells (data not shown) was observed. Therefore, the reduced cell adhesion was not due to death of either tumor or stromal cells.
To confirm these results, we further characterized the effects of ibrutinib on adhesion of MCL cells to patient-derived bone marrow fibroblasts (BMFs) by using confocal microscopy. Carboxyfluorescein diacetate succinimidyl ester–labeled MCL cells were plated on preseeded tdTomato-labeled, hCD40L-transduced BMFS. Cells were cocultured with or without ibrutinib treatment, followed by cell fixation and 4′,6-diamidino-2-phenylindole (DAPI) staining to show the individual nuclei of each cell (Figure 1C). Ibrutinib significantly diminished the adhesion of the sensitive JeKo-1 and intermediate Mino cells to BMFs and had essentially no effect on adhesion of the resistant MAVER-1 and Granta-519 cells (DMSO vs ibrutinib). By determining the ratio of MCL cells to BMFs by using DAPI nuclear staining for live cells, we were able to show that the effect was a result of decreased cell adhesion rather than decreased cell viability. The reduction of cell adhesion in JeKo-1 and Mino was significant, and no such reduction was observed with MAVER-1 and Granta-519 cells (Figure 1D).
With these 2 independent adhesion assays, we established that ibrutinib disrupts the direct interaction between sensitive MCL cells and stromal cells of 2 different origins (NKTert and BMFs). Notably, these results on cell adhesion correlate well with cell line sensitivity to ibrutinib (Figure 1A).
BCR signaling and cell adhesion transcriptional programs are inhibited in a coordinated fashion by ibrutinib in drug-sensitive but not drug-resistant cells
To elucidate the molecular mechanisms underlying intrinsic ibrutinib sensitivity/resistance in MCL cell adhesion, we performed RNA-Seq analyses on a pair of ibrutinib-sensitive (JeKo-1) and resistant (MAVER-1) cell lines. This approach was used to screen for pathways that are suppressed by ibrutinib in sensitive JeKo-1 and unaffected in resistant MAVER-1. JeKo-1 and MAVER-1 were treated with either ibrutinib or vehicle, and changes in gene transcription were analyzed by using RNA-Seq. The analyses revealed that several oncogenic pathways were downregulated in JeKo-1 in response to ibrutinib treatment but unchanged in MAVER-1. These include NF-κB, noncanonical NF-κB, PI3K, and MYC pathways. Enrichment plots and heatmaps are summarized in supplemental Figures 2 to 5. These findings are consistent with previous literature.31,32,36 RAS and STAT3 pathways, conversely, were not as significantly affected by ibrutinib treatment in JeKo-1 cells, suggesting that these may not represent downstream effectors of the BCR inhibition in this cellular context.
As expected, the BCR signature was significantly downregulated in ibrutinib-sensitive JeKo-1 (false discovery rate [FDR] = 0.003; P < .001) (Figure 2A) but not in ibrutinib-resistant MAVER-1 cells (FDR = 0.53; P = .01). Because we focused on the cell adhesion phenotype, the signature of cell adhesion molecules (CAMs) was also analyzed (Figure 2B). In correlation with the changes in the BCR signature, CAMs were significantly downregulated in ibrutinib-sensitive JeKo-1 (FDR = 0.008; P < .001) but not significantly changed in MAVER-1 (FDR = 0.01; P = .9). In the adhesion signature, leukocyte function–associated antigen-1 (LFA-1 or integrin αLβ2, represented by ITGAL and ITGB2 in Figure 2B) and its ligand ICAM-1 were among genes that were downregulated in JeKo-1. This finding is consistent with previous literature showing that LFA-1 and ICAM-1 play important roles in the adhesion, migration, and invasion of lymphoma cells.37-42
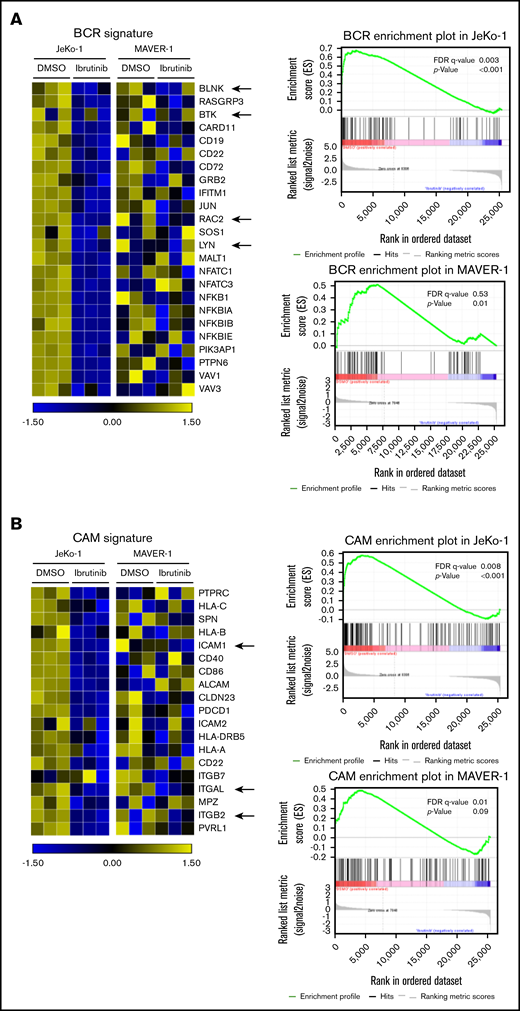
BCR signaling and cell adhesion transcriptional programs are inhibited in a coordinated fashion by ibrutinib in drug-sensitive cells but not drug-resistant cells. (A) Left: heatmap representing changes in the BCR gene signature cataloged in the Kyoto Encyclopedia of Genes and Genomes (KEGG) database. JeKo-1 vs MAVER-1. JeKo-1 and MAVER-1 cells were treated with DMSO or ibrutinib 400 nM for 16 hours. Biological triplicate experiments, represented by 3 columns for each condition, were conducted and shown. A few representative genes are indicated with arrows. Right: enrichment plot of the BCR gene signature analyzed by using Gene Set Enrichment Analysis. P values and FDR are indicated. (B) Left: heatmap representing changes in the CAM gene signature, JeKo-1 vs MAVER-1. Biological triplicate experiments, represented by 3 columns for each condition, were conducted and shown. A few representative genes are indicated with arrows. Right: enrichment plot of the CAM gene signature analyzed using Gene Set Enrichment Analysis. P values and FDR are indicated.
BCR signaling and cell adhesion transcriptional programs are inhibited in a coordinated fashion by ibrutinib in drug-sensitive cells but not drug-resistant cells. (A) Left: heatmap representing changes in the BCR gene signature cataloged in the Kyoto Encyclopedia of Genes and Genomes (KEGG) database. JeKo-1 vs MAVER-1. JeKo-1 and MAVER-1 cells were treated with DMSO or ibrutinib 400 nM for 16 hours. Biological triplicate experiments, represented by 3 columns for each condition, were conducted and shown. A few representative genes are indicated with arrows. Right: enrichment plot of the BCR gene signature analyzed by using Gene Set Enrichment Analysis. P values and FDR are indicated. (B) Left: heatmap representing changes in the CAM gene signature, JeKo-1 vs MAVER-1. Biological triplicate experiments, represented by 3 columns for each condition, were conducted and shown. A few representative genes are indicated with arrows. Right: enrichment plot of the CAM gene signature analyzed using Gene Set Enrichment Analysis. P values and FDR are indicated.
Expression and BLNK association of RAC2 are downregulated by ibrutinib in sensitive cells but not in resistant cells
From the RNA-Seq screening, we noted that among the BCR genes, RAC2 was decreased by ibrutinib in JeKo-1 but not in MAVER-1 (Figure 3A). RAC2 is a small Rho guanosine triphosphatase (GTPase) specifically expressed in hematopoietic tissue, and it acts as a cell adhesion regulator in normal B cells.43,44 In normal B cells, RAC2, as opposed to RAC1, plays an essential role in cell adhesion triggered by antigen ligation.43 Because RAC2 is not only a component of the BCR signature in the MCL tumor cells but also a regulator of cell adhesion, we hypothesized that RAC2 may serve as the link between the BCR signaling and the cell adhesion phenotype. In addition, tool compounds inhibiting RAC2 are available, making RAC2 a potential “druggable” target. We thus focused our subsequent studies on RAC2.
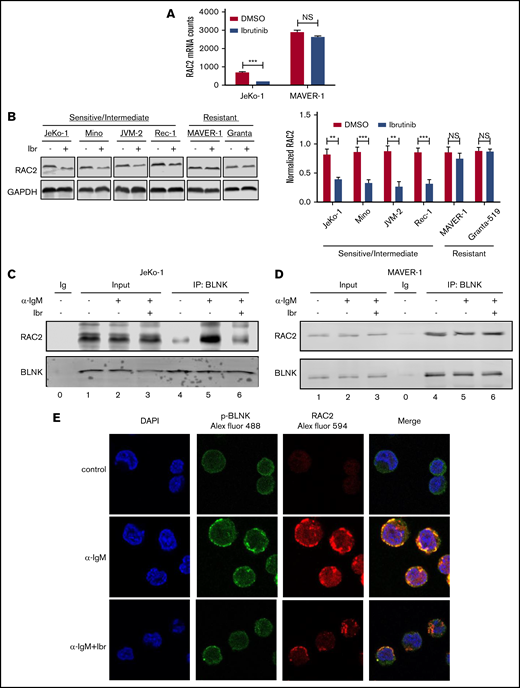
Expression and BLNK association of RAC2 are downregulated by ibrutinib in sensitive cells but not in resistant cells. (A) Expression of RAC2 mRNA in JeKo-1 vs MAVER-1, extracted from the RNA-Seq data. (B) Immunoblot of RAC2 in MCL cell lines. Cells were treated with either 400 nM of ibrutinib or DMSO for 24 hours. Gel picture in the left panel represents 1 of the 3 independent experiments that were quantified by the bar graph shown on the right. Integrated optical density of RAC2 is normalized to that of glyceraldehyde-3-phosphate dehydrogenase (GAPDH). (C-D) Immunoblotting of coimmunoprecipitation products. Cells were preincubated with or without 400 nM of ibrutinib for 1 hour and stimulated with or without anti-IgM antibody for 15 minutes before cell lysis. Immunoblotting was performed for at least 3 times using either whole-cell extracts (Input) or anti-BLNK pull-downs in JeKo-1 (C), and MAVER-1 (D). (E) Colocalization of p-BLNK and RAC2 by confocal microscopy in JeKo-1 cells. Immunofluorescent-labeled antibodies and cell treatment conditions are indicated. Cells were treated with ibrutinib for 6 hours before the αIgM stimulation. **P < .01; ***P < .001.
Expression and BLNK association of RAC2 are downregulated by ibrutinib in sensitive cells but not in resistant cells. (A) Expression of RAC2 mRNA in JeKo-1 vs MAVER-1, extracted from the RNA-Seq data. (B) Immunoblot of RAC2 in MCL cell lines. Cells were treated with either 400 nM of ibrutinib or DMSO for 24 hours. Gel picture in the left panel represents 1 of the 3 independent experiments that were quantified by the bar graph shown on the right. Integrated optical density of RAC2 is normalized to that of glyceraldehyde-3-phosphate dehydrogenase (GAPDH). (C-D) Immunoblotting of coimmunoprecipitation products. Cells were preincubated with or without 400 nM of ibrutinib for 1 hour and stimulated with or without anti-IgM antibody for 15 minutes before cell lysis. Immunoblotting was performed for at least 3 times using either whole-cell extracts (Input) or anti-BLNK pull-downs in JeKo-1 (C), and MAVER-1 (D). (E) Colocalization of p-BLNK and RAC2 by confocal microscopy in JeKo-1 cells. Immunofluorescent-labeled antibodies and cell treatment conditions are indicated. Cells were treated with ibrutinib for 6 hours before the αIgM stimulation. **P < .01; ***P < .001.
To validate the finding at the RNA level, we examined RAC2 protein expression in additional cell lines treated with or without ibrutinib. As shown by immunoblotting analyses (Figure 3B), ibrutinib treatment of 24 hours significantly downregulated RAC2 protein in ibrutinib–sensitive/intermediate cell lines (JeKo-1, Mino, JVM-2, and Rec-1) by >50% but did not affect the RAC2 levels in ibrutinib-resistant cell lines (MAVER-1 and Granta-519). These results are well correlated with the RNA-Seq findings and are further correlated with the cell adhesion responses to ibrutinib among these different cell lines (Figure 1).
We hypothesized that RAC2 plays a key role in connecting the cell adhesion phenotype with the BCR signaling pathway. We next investigated if any components of the BCR pathway interact with RAC2. During normal B-cell activation, BLNK, an adaptor protein situated in the proximal BCR pathway, provides a platform for the interactions of several BCR signaling components.45 We thus tested to see if BLNK interacts with RAC2 in the cellular contexts of MCL. The coimmunoprecipitation assay showed that RAC2 in whole-cell inputs did not change when cells were preincubated with ibrutinib for 1 hour and subsequently stimulated with anti-IgM (lane 3 vs 2 in Figure 3C-D showing JeKo-1 and MAVER-1; supplemental Figure 6 showing Mino and Granta-519). In contrast, in the BLNK pull-downs, IgM stimulation increased the binding between BLNK and RAC2 in the ibrutinib-sensitive cell line JeKo-1 (lane 4 vs 5 in Figure 3C; supplemental Figure 6A showing Mino), suggesting the association of RAC2 with BLNK is induced by the BCR ligation. Notably, this interaction was reduced down to the baseline level when cells were preincubated with ibrutinib (lane 5 vs 6 in Figure 3C showing JeKo-1; supplemental Figure 6A showing Mino). In contrast, in the ibrutinib-resistant cell lines MAVER-1 and Granta-519, neither IgM stimulation nor ibrutinib preincubation affected BLNK-RAC2 association (lanes 4-6 in Figure 3D showing MAVER-1; supplemental Figure 6B showing Granta-519).
The association between BLNK and RAC2 was further corroborated by the fluorescent confocal microscopic observation. Figure 3E shows that anti-IgM stimulation enhanced the cell surface expression of phosphorylated-BLNK (p-BLNK) and RAC2 in JeKo-1 (Figure 3E, middle row, second and third panels), and p-BLNK and RAC2 colocalize on the cell membrane (Figure 3E, middle row, fourth panel). Ibrutinib treatment significantly decreased both surface expression and association (Figure 3E, last row). In the resistant MAVER-1, anti-IgM failed to induce membrane p-BLNK. No association with RAC2 was formed, and ibrutinib had no effects (supplemental Figure 7). These data together suggest that ibrutinib exerts its effect by diminishing the interaction between BLNK and RAC2. In sensitive cells, the weakened interaction may subsequently contribute to the downregulation of RAC2-dependent cell adhesion (discussed in the following section).
RAC2 regulates cell adhesion in MCL
To establish that RAC2 plays a role in regulating MCL cell adhesion, we first knocked down RAC2 in the sensitive JeKo-1 and Mino cells via RNA interference and measured cell adhesion. RAC2 targeting siRNA markedly reduced the abundance of RAC2 protein in JeKo-1 (Figure 4A). Compared with cells that received control siRNA, cells that received RAC2 siRNA displayed significantly lower levels of cell adhesion between MCL cells and the NKTert stroma. These findings were even more pronounced in Mino cells (Figure 4B). To further corroborate the role of RAC2 in cell adhesion, we constructed and delivered a His-tagged RAC2 gene expression vector into the sensitive MCL lines (Figure 4C-D). Exogenous overexpression of RAC2 did not change the baseline cell adhesion in vehicle-treated controls. However, suppression of cell adhesion via ibrutinib treatment was reversed by RAC2 overexpression in both JeKo-1 and Mino cells. Meanwhile, cell viability was not significantly affected by transfection of siRNA or RAC2 expression vector (supplemental Figure 8), suggesting that cell viability was not a factor contributing to the observed phenotypic decrease in cell adhesion.
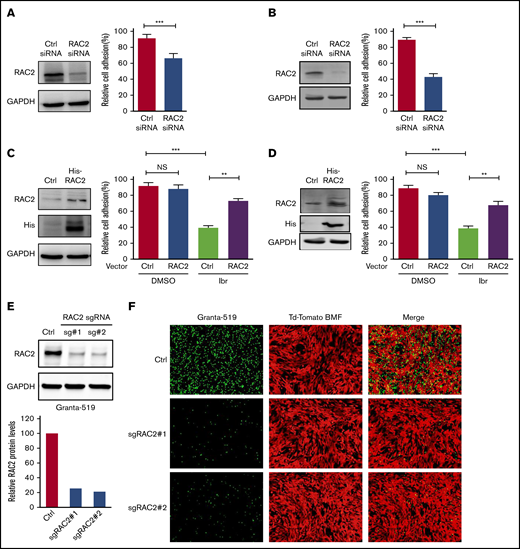
RAC2 regulates cell adhesion in MCL. (A) JeKo-1 cells. Left: RAC2 siRNA effectively reduced RAC2 protein level compared with control siRNA. Right: cell adhesion to NKTert cells was significantly compromised. Cells were cocultured with NKTert and allowed to adhere for 24 hours before washing. Error bar represents mean ± SEM of 6 replicate reactions. (B) Same experiment as in panel A with Mino cells. (C) JeKo-1 cells. Left: exogenous expression of His-tagged RAC2 in JeKo-1 cells. Immunoblots for RAC2 and His-tag are shown. Glyceraldehyde-3-phosphate dehydrogenase (GAPDH) was included as the loading control. Right: exogenous RAC2 reversed ibrutinib-induced cell adhesion impairment. (D) Same experiment as in panel A with Mino cells. Error bar represents mean ± SEM of 6 replicate reactions. (E) RAC2 single-guide RNAs (sgRNAs) effectively reduced RAC2 protein levels in Granta-519 cells compared with control cells. (F) Representative fluorescent microscopic photos showing that RAC2 knockout significantly compromised adhesion of Granta-519 cells (green) to tdTomato-BMF cells (red). **P < .01; ***P < .001.
RAC2 regulates cell adhesion in MCL. (A) JeKo-1 cells. Left: RAC2 siRNA effectively reduced RAC2 protein level compared with control siRNA. Right: cell adhesion to NKTert cells was significantly compromised. Cells were cocultured with NKTert and allowed to adhere for 24 hours before washing. Error bar represents mean ± SEM of 6 replicate reactions. (B) Same experiment as in panel A with Mino cells. (C) JeKo-1 cells. Left: exogenous expression of His-tagged RAC2 in JeKo-1 cells. Immunoblots for RAC2 and His-tag are shown. Glyceraldehyde-3-phosphate dehydrogenase (GAPDH) was included as the loading control. Right: exogenous RAC2 reversed ibrutinib-induced cell adhesion impairment. (D) Same experiment as in panel A with Mino cells. Error bar represents mean ± SEM of 6 replicate reactions. (E) RAC2 single-guide RNAs (sgRNAs) effectively reduced RAC2 protein levels in Granta-519 cells compared with control cells. (F) Representative fluorescent microscopic photos showing that RAC2 knockout significantly compromised adhesion of Granta-519 cells (green) to tdTomato-BMF cells (red). **P < .01; ***P < .001.
We next depleted RAC2 in the resistant Granta-519 cells via CRISPR-Cas9 technology using 2 different single-guide RNA oligos. As shown in Figure 4E, both single-guide RNA oligos effectively reduced the abundance of RAC2 protein in the tumor cells (quantification shown at the bottom). Consequently, RAC2 knockout resulted in a significant impairment in adhesion of the MCL cells to the BMF as evidenced by fluorescence microscopy (Figure 4F). Together, the knock-down/knock-out and overexpression data indicate in both directions that RAC2 regulates the cell adhesion phenotype in MCL.
RAC2 suppression by ibrutinib is correlated with slower tumor growth in a xenograft mouse model
To validate the cell line findings that ibrutinib inhibits RAC2, we established a xenograft mouse model using the Mino cell line. Oral administration of ibrutinib suppressed tumor growth in SCID mice (P < .05) (Figure 5A). This action was accompanied by significantly reduced levels of RAC2 protein in xenograft tumor tissues compared with vehicle-treated mice at both low- and high-power views (Figure 5B). The aggregate results of the immunohistochemical staining (IHC) from either ibrutinib- or vehicle-administered mice are presented in Figure 5C (N = 6 per group; P < .01). Thus, RAC2 expression is inhibited by ibrutinib in vivo, and this downregulation of RAC2 expression is correlated with slower tumor growth.
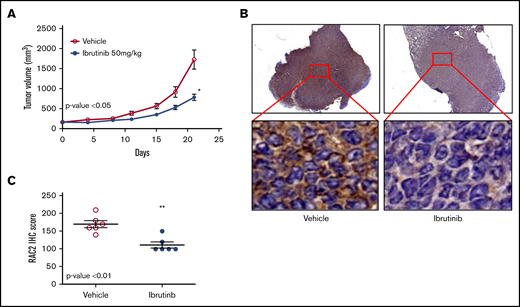
RAC2 suppression by ibrutinib is correlated with slower tumor growth in a xenograft mouse model. (A) Ibrutinib treatment resulted in growth inhibition of Mino xenografts. Tumor-bearing animals were administered 50 mg/kg ibrutinib orally (n = 6) or vehicle consisting of 0.5% methylcellulose (n = 6). Error bar represents mean ± SEM of 6 mice. The dose of 50 mg/kg was selected according to the pharmacology review of ibrutinib published by the FDA Center for Drug Evaluation and Research (accessible at https://www.accessdata.fda.gov/drugsatfda_docs/nda/2013/205552Orig1s000PharmR.pdf). (B) Immunostaining of RAC2 of Mino xenografts treated with vehicle (left) or ibrutinib (right). High-power views show cytoplasmic staining of RAC2 in individual cells. (C) RAC2 staining in 6 xenografts from either vehicle or ibrutinib group analyzed by using an unpaired Student t test. *P < .05; **P < .01.
RAC2 suppression by ibrutinib is correlated with slower tumor growth in a xenograft mouse model. (A) Ibrutinib treatment resulted in growth inhibition of Mino xenografts. Tumor-bearing animals were administered 50 mg/kg ibrutinib orally (n = 6) or vehicle consisting of 0.5% methylcellulose (n = 6). Error bar represents mean ± SEM of 6 mice. The dose of 50 mg/kg was selected according to the pharmacology review of ibrutinib published by the FDA Center for Drug Evaluation and Research (accessible at https://www.accessdata.fda.gov/drugsatfda_docs/nda/2013/205552Orig1s000PharmR.pdf). (B) Immunostaining of RAC2 of Mino xenografts treated with vehicle (left) or ibrutinib (right). High-power views show cytoplasmic staining of RAC2 in individual cells. (C) RAC2 staining in 6 xenografts from either vehicle or ibrutinib group analyzed by using an unpaired Student t test. *P < .05; **P < .01.
RAC2 expression is enriched in the aggressive subtypes of primary MCL tissues, and RAC2 suppression by ibrutinib is accompanied by reduced cell adhesion
To ensure that RAC2 is relevant in human MCL disease, we examined RAC2 protein expression in human primary MCL tissues. IHC of RAC2 was performed on primary tonsillar (n = 5) and tumor (n = 29) tissues. In tonsillar tissues from benign lymphoid hyperplasia, RAC2 staining revealed a topographic pattern at the low-power view (Figure 6A). It was moderately expressed but restricted to the mantle zone and paracortex area. The protein was only scarcely expressed in B cells at the germinal centers of the follicles. In the high-power view, a cytoplasmic staining pattern was observed, consistent with the fact that RAC2 is a small G protein located in the cytoplasm. In classic MCL, RAC2 was weakly positive in neoplastic cells in 14 of 22 tumors examined. In comparison, in aggressive subtypes of MCL (blastoid or pleomorphic type), RAC2 was positive in the cytoplasm of 5 of 7 tumors. The IHC staining results are also summarized in Figure 6A. Overall, 19 (65%) of 29 MCL tissues stained positive for the RAC2 protein.
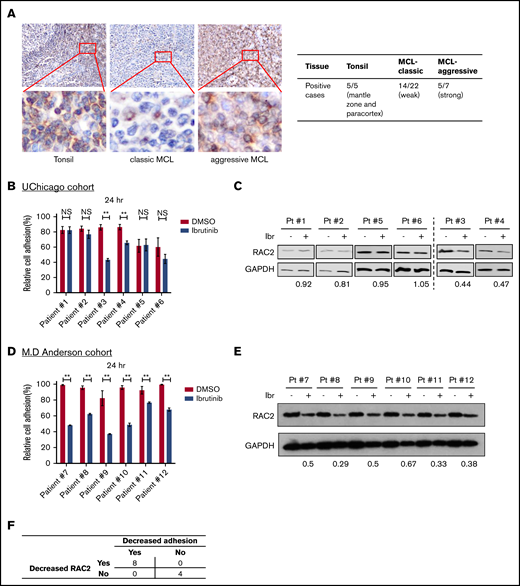
RAC2 expression is enriched in the aggressive subtypes of primary MCL tissues, and RAC2 suppression by ibrutinib is accompanied by reduced cell adhesion. (A) Immunohistochemical staining (400×) shows RAC2 positivity in the mantle zone and paracortex area of benign lymphoid hyperplasia in tonsils, weak scattered positivity in classic MCL tissues, and strong diffuse positivity in pleomorphic MCL. Insets show enlarged photos of individual cells, revealing a cytoplasmic staining pattern. Summary of RAC2 immunostaining in archived primary tissues is shown on the right. (B) Effect of ibrutinib 400 nM on cell adhesion in six thawed primary MCL samples from the University of Chicago (UChicago) cohort. Error bars represent mean ± SEM of 6 replicate reactions. (C) Effects of ibrutinib 400 nM on the RAC2 protein level in the primary MCL cells. For quantification, RAC2 protein levels were first normalized to the loading control glyceraldehyde-3-phosphate dehydrogenase (GAPDH), and RAC2/GAPDH was then normalized to the DMSO control as a ratio. (D) Effect of ibrutinib 400 nM on cell adhesion in 6 thawed primary MCL samples from the MD Anderson cohort. Error bars represent mean ± SEM of 6 replicate reactions. (E) Effects of ibrutinib 400 nM on the RAC2 protein level in the MD Anderson primary MCL samples. For quantification, RAC2 protein levels were first normalized to the loading control GAPDH, and RAC2/GAPDH was then normalized to the DMSO control as a ratio. (F) Summary of the association between decreased RAC2 and decreased adhesion. Numbers represent number of cases. **P < .01.
RAC2 expression is enriched in the aggressive subtypes of primary MCL tissues, and RAC2 suppression by ibrutinib is accompanied by reduced cell adhesion. (A) Immunohistochemical staining (400×) shows RAC2 positivity in the mantle zone and paracortex area of benign lymphoid hyperplasia in tonsils, weak scattered positivity in classic MCL tissues, and strong diffuse positivity in pleomorphic MCL. Insets show enlarged photos of individual cells, revealing a cytoplasmic staining pattern. Summary of RAC2 immunostaining in archived primary tissues is shown on the right. (B) Effect of ibrutinib 400 nM on cell adhesion in six thawed primary MCL samples from the University of Chicago (UChicago) cohort. Error bars represent mean ± SEM of 6 replicate reactions. (C) Effects of ibrutinib 400 nM on the RAC2 protein level in the primary MCL cells. For quantification, RAC2 protein levels were first normalized to the loading control glyceraldehyde-3-phosphate dehydrogenase (GAPDH), and RAC2/GAPDH was then normalized to the DMSO control as a ratio. (D) Effect of ibrutinib 400 nM on cell adhesion in 6 thawed primary MCL samples from the MD Anderson cohort. Error bars represent mean ± SEM of 6 replicate reactions. (E) Effects of ibrutinib 400 nM on the RAC2 protein level in the MD Anderson primary MCL samples. For quantification, RAC2 protein levels were first normalized to the loading control GAPDH, and RAC2/GAPDH was then normalized to the DMSO control as a ratio. (F) Summary of the association between decreased RAC2 and decreased adhesion. Numbers represent number of cases. **P < .01.
We then validated the cell adhesion findings in 6 thawed frozen primary MCL samples retrieved from the archives of the University of Chicago. Cell adhesion was not affected by ibrutinib in patients 1, 2, 5, and 6 but was impaired in patients 3 and 4 (Figure 6B). Immunoblotting showed that RAC2 protein levels in patients 3 and 4 were reduced by ibrutinib treatment, but this reduction was not as obvious in patients 1, 2, 5, and 6 (Figure 6C). Thus, the immunoblotting results largely correlate with the phenotypic readouts of cell adhesion in this small number of primary tumors. This finding was further validated with 6 additional primary MCL samples using an MD Anderson cohort (Figure 6D-E). Taken together, in this small series of 12 tumors, reduced cell adhesion was invariably associated with decreased RAC2 expression upon ibrutinib treatment (Figure 6F).
Collectively, data from cell lines, animal studies, and primary human samples support a model that BCR stimulation first activates RAC2 through its association with BLNK, BCR signaling then upregulates RAC2 RNA and protein expression, and RAC2 subsequently promotes cell adhesion. With regard to ibrutinib, the drug inhibits BTK, reduces BCR signaling and BLNK-RAC2 interaction, decreases RAC2 expression, and subsequently causes cell adhesion impairment. The model may, at least partially, explain the observed phenomena of peripheral lymphocytosis in patients receiving ibrutinib therapy that contributes to ibrutinib’s therapeutic benefit.
Discussion
Previously, it has been shown in a small number of CLL and MCL cases that ibrutinib abrogates BCR signaling and affects adhesion of tumor cells to fibronectin and VCAM-1.9,21 Furthermore, it has recently been shown that VLA-4 integrin on CLL cells can be activated by BCR stimulation that results in increased adhesion to VCAM-1.46 The focus of the current study, however, was not on cell adhesion per se but on how the BCR pathway and cell adhesion phenotype is connected. This subject has not been addressed by any prior studies, to the best of our knowledge.
In the current investigation, using cell lines that are either sensitive or resistant to ibrutinib, a mouse xenograft model, and human primary tumor tissues, we clearly show that: (1) cell adhesion impairment was correlated with cell growth inhibition in ibrutinib-treated MCL cell lines; (2) BCR signaling and cell adhesion transcriptional profiles were coinhibited by ibrutinib in sensitive, but not in resistant, cells; (3) RAC2 is a part of the BCR-controlled genes, and its RNA and protein expression were downregulated by ibrutinib in sensitive but not resistant cells; (4) RAC2 and BLNK physically interact, and the association was induced by IgM stimulation and diminished by ibrutinib in sensitive but not resistant cells; (5) genetic reduction of RAC2 impaired cell adhesion in both ibrutinib-sensitive and -resistant cell lines, whereas exogenous expression of RAC2 reversed ibrutinib-induced cell adhesion defects; (6) ibrutinib reduced RAC2 expression in mouse xenograft tumors, which was accompanied by tumor growth inhibition; and (7) ∼65% of human MCL tissues express RAC2. Ibrutinib reduced cell adhesion in primary MCL tumor cells, which correlates with the degree of RAC2 protein reduction. Altogether, these data suggest that RAC2 links the BCR signaling pathway to the cell adhesion phenotype and that BCR targeting via ibrutinib disrupts cell adhesion in MCL tumors via RAC2.
In the primary cell experiment (Figure 6B-E), we noted some differences between the cell adhesion results generated from 2 different cohorts. Although all 6 of the samples were sensitive to ibrutinib in the MD Anderson cohort, only 2 of the 6 were sensitive in the University of Chicago cohort. (Patient information is provided in supplemental Figure 9.) The main difference in these studies lies in the coculture system used for these assays. The University of Chicago samples were cocultured with NKTert cells, whereas the samples from MD Anderson were cocultured with the HS-5 stromal cell line. NKTert is one of the stromal cell lines that best supports the survival of primary cells under drug exposure47 (P.L., unpublished observations). Perhaps for this reason, cells cultured with NKTert were less sensitive or more resistant to ibrutinib.
Taken together, our new findings identified and validated RAC2 as a previously unknown link between the BCR pathway and cell adhesion. RAC2 acts through short-term association with BLNK after BCR ligation and through longer term upregulation of RAC2-associated transcription of CAMs. However, the precise mechanisms regarding how transcription of CAMs is regulated by BCR signaling and what transcription factors are involved remain unknown and require further investigation.
RAC2 may be one of the master regulators of cell adhesion in lymphoma in general. Besides the MCL studied here, we observed that RAC2 was part of the regulated gene expression signatures in CLL and DLBCL. In CLL, we performed a retrospective reanalysis of our previously published results.8,17 In an ibrutinib-treated patient, longitudinal analyses over the patient’s treatment course revealed that RAC2 was downregulated when the patient responded to ibrutinib and upregulated when the patient developed BTKC481S and clinical resistance. In DLBCL, RAC2, along with other genes in the BCR pathway, was significantly downregulated by both ibrutinib and PLS-123, a novel, highly selective BTK inhibitor.33 In addition, it was shown in mice that RAC2 targeting by shRNA and RAC inhibitors slows tumor growth and prolongs mice survival.11 Targeting RAC2 may represent a potential strategy to overcome intrinsic resistance to BTK inhibition in patients.
RAC1, another small Rho GTPase, was also involved in MCL.48 However, RAC1 is induced by Wnt5a, a ligand for ROR1 receptor. RAC1 was not identified as part of the BCR signature genes in our work. It is possible that both small Rho GTPases play a role in MCL adhesion but that they are activated by different receptor–ligand interactions.
From the clinical perspective, our findings help explain the observed phenomenon: For patients on ibrutinib, reduction of lymphadenopathy is preceded by lymphocytosis that is suggestive of compartment shifts of the tumor cells from the nodal sites to the periphery. Notably, this phenomenon is commonly shared by many other small molecules targeting the BCR pathway, including, but not limited to, dasatinib against LYN, fostamatinib against SYK, and idelalisib against PI3Kδ. Interestingly, inhibitors against AKT and mammalian target of rapamycin also induce lymphocytosis. This class action suggests a shared mechanism of action that makes the BCR-targeting drugs effective. However, further studies would be required to determine if these other BCR inhibitors affect RAC2 in a fashion similar to that of ibrutinib. Nonetheless, the observations suggest the potential of anti–cell adhesion as an integral part of future anticancer therapy.
In summary, our studies revealed a new mechanism of cross-talk between BCR signaling and cell adhesion. BCR signaling promotes tumor viability/proliferation, and cell adhesion promotes tumor-microenvironment interactions; these 2 important hallmarks of tumor biology were connected via RAC2. Our findings implicate that direct targeting of cell adhesion, along with targeting of cell signaling, should be considered as a key component of future synergistic therapies.
The data reported in this article have been deposited in the Gene Expression Omnibus database (accession number GSE116810).
Acknowledgments
The authors thank all patients for contributing tumor materials for scientific research. They also thank Vytas Bindokas and the Integrated Light Microscopy Core Facility at the University of Chicago for all their cell imaging technical advice.
W. Wang is a student supported by the China Scholar Council. This project was partially funded by the Leukemia & Lymphoma Society (TRP6364-13) (Y.L.W.), the National Natural Science Foundation of China (81470353) (X.Z.), and the Strategic Priority Research Program of the Chinese Academy of Sciences (XDA12020208) (J. Li).
Authorship
Contribution: W. Wang and Y.L.W. formed the hypothesis; W. Wu, W. Wang, C.A.F., L.L.Z., H.G., D.S., P.L., A.G., and C.X. developed the assays, designed and performed the experiments, solved technical problems, and analyzed the data; J. Lee, M.M., Y.L., and J.A. performed bioinformatics analyses; M.S., G.V., V.C.J., and M.L.W. contributed useful patient materials and patient pathologic information; M.S., G.V., J. Li, X.Z., and M.L.W. provided helpful discussions and suggestions; W. Wu, W. Wang, and C.A.F. participated in the manuscript writing; and Y.L.W. directed and coordinated the project, designed the experiments, analyzed the data, and wrote the manuscript.
Conflict-of-interest disclosure: Y.L.W. is a stock owner of Incyte Research Institute. The remaining authors declare no competing financial interests.
Correspondence: Y. Lynn Wang, Department of Pathology, Blood Cell Development and Function Program, Fox Chase Cancer Center, 333 Cottman Ave, Room W328, Philadelphia, PA 19111; e-mail: yuelynn.wang@fccc.edu.

