

Key Points
Total BA concentration in blood circulation can be an early diagnostic marker for recovery of bone marrow function from myelosuppression.
BAs in blood support recovery of bone marrow cells, possibly through suppression of unfolded protein stress induction.

Abstract
Chemotherapeutic agents can reduce bone marrow (BM) activity, causing myelosuppression, a common life-threatening complication of cancer treatment. It is challenging to predict the patients in whom prolonged myelosuppression will occur, resulting in a delay or discontinuation of the treatment protocol. An early indicator of recovery from myelosuppression would thus be highly beneficial in clinical settings. In this study, bile acids (BAs) were highly increased in the systemic circulation as a natural response during recovery from myelosuppression, supporting regeneration of BM cells. BA levels in the blood of pediatric cancer patients and mice treated with chemotherapeutic agents were increased, in synchrony with early proliferation of BM cells and recovery from myelosuppression. In a mouse model of altered BA composition, Cyp8b1 knockout mice, a subset of mice recovered poorly after chemotherapy. The poor recovery correlated with low levels and changes in composition of BAs in the liver and systemic circulation. Conversely, BA supplementation in chemotherapy-treated wild-type mice resulted in significantly improved recovery. The results suggest that part of the mechanism by which BAs support recovery is the suppression of endoplasmic reticulum stress pathways in expanding and recovering hematopoietic cells. The findings propose a novel role of BAs as early markers of recovery and active components of the recovery process after chemotherapy.
Introduction
Chemotherapy is an established standard of treatment of patients with various types of cancer. Most chemotherapeutic agents exert their effects through cytotoxicity, which triggers serious side effects. The mechanism of action of many chemotherapeutics relies on targeting highly proliferative cells. Side effects are therefore observed in high-turnover tissues, such as hair follicles (alopecia), mucosa (mucositis), and normal blood output. Above all, damage to bone marrow (BM) is the most common and serious life-threatening complication, as it leads to myelosuppression, a severely reduced production of hematopoietic cells that causes neutropenia, thrombocytopenia, and erythrocytopenia.1,2 Prolonged myelosuppression limits the tolerance of therapy and results in a delay in the completion of the treatment protocol. However, it is challenging to predict the patients in whom this will occur. Because faster and effective recovery of normal blood production is essential, administration of granulocyte colony-stimulating factor (G-CSF) is frequently used as a supportive treatment. However, G-CSF treatment has been reported to impede recovery from myelosuppressive conditions by reducing the self-renewal capacity of hematopoietic stem and progenitor cells.3,4 To minimize risks of late toxicity, protecting long-term hematopoietic stem cells (LT-HSCs) is as important as enhancing expansion of the progenitor cells and the more mature cells.4,5
In attempting to accelerate hematopoietic regeneration, researchers have discovered factors that support proliferation of HSCs and progenitor cells (eg, epidermal growth factor, matrilin-4, and a luteinizing hormone–releasing hormone antagonist).6-8 In addition, factors protecting HSCs from chemotoxicity by controlling their cell cycle status have been identified, including transforming growth factor-β and G1T28 (Trilaciclib, a CDK4/6 inhibitor).9,10 However, to achieve quick hematopoietic regeneration while maintaining the high integrity of HSCs, there is a great need to explore as yet undiscovered mechanisms that regulate stress hematopoiesis.
Adult HSCs under steady-state conditions are profoundly maintained in a dormant state. These quiescent HSCs have a lower protein synthesis rate and poorer protein folding capacity,11,12 and they are therefore predisposed to accumulation of unfolded or misfolded proteins and subsequent induction of unfolded protein stress, mainly endoplasmic reticulum (ER) stress.12-14 We have recently reported that, under proliferative conditions, bile acids (BAs) serve as molecular chaperones that suppress the induction of ER stress by supporting protein folding and blocking the formation of protein aggregates.12,15 BAs are amphipathic steroid molecules synthesized from cholesterol in hepatocytes by the actions of ∼15 enzymes from the cytochrome P450 family (CYPs).16-19 In the digestive system, BAs facilitate intestinal nutrient absorption and dietary lipid digestion, but they are also increasingly recognized as chemical chaperones and signaling molecules.12,15,19-21 BAs are efficiently recaptured and reused in the liver, whereas newly synthesized BAs replace loss via feces. Under steady-state conditions, concentrations of BAs in peripheral blood (PB) are low (<5 μM).19 However, in several liver diseases and critically ill patients, circulating BA levels rise substantially, and some researchers have argued that the levels of BAs in blood correlate with poor clinical outcomes and death, as can be observed in cases of sepsis.22,23 Circulating BA levels may thus have more clinical relevance in hematopoiesis than has been recognized.
In this work, under myelosuppressive conditions after chemotherapy, BA levels showed a transient increase, supporting early recovery of the hematopoietic system. In humans, BA levels in the PB of pediatric patients who undergo chemotherapy displayed a positive correlation with the speed of recovery from myelosuppression. In mice, a reduction of BA production significantly dampened the recovery. Conversely, supplementation of BAs ameliorated hematopoietic regeneration in chemotherapy-treated mice. This supportive effect may be achieved through the suppression of ER stress induction, as inhibition of the ER stress pathway showed effects similar to those of BA treatment. Our findings indicate that BAs play a key role in the reconstitution of hematopoiesis and that they can be used as a supportive therapeutic tool in cancer patients by accelerating recovery from severe myelosuppression.
Materials and methods
Patient materials
Blood samples were collected, with informed consent, from pediatric cancer patients who were undergoing treatment of various cancers in the Department of Pediatrics, Toho University Omori Medical Center (Tokyo, Japan). Recovery of mononuclear cells was monitored with Sysmex XE-5000 and XN-2000 (Sysmex) systems. Total BA (TBA), alanine transaminase (ALT), γ-glutamyl transpeptidase (GGT), and total bilirubin (T-Bil) levels were measured with the Labospect 008 (Hitachi) system.
Mice
B6.129S(Cg)-Ddit3tm2.1Dron/J mice (Ddit3 [CHOP] knockout [KO] mice) were obtained from The Jackson Laboratory. B6;129S7-Cyp8b1tm1Rus/J mice (Cyp8b1 KO mice) were provided by Cecilia Holm (Lund University). C57BL/6N mice were obtained from an in-house breeding facility at Lund University.
Measurement of BAs
We used either a TBA assay kit (BioVision) or mass spectrometry to determine TBA levels in liver and plasma of mice. A detailed protocol can be found in the supplemental Information.
Reagents
Salubrinal (SB) 2 mg/kg (R&D) was injected intraperitoneally (IP), TUDCA 7.5 mg/kg (Sigma-Aldrich) was injected IP, and 5-FU 150 mg/kg (Teva) was injected either IV or IP twice for survival experiments.
Purification and analysis of BM and PB
Mouse BM cells were collected by crushing a single leg (femur and tibia) in phosphate-buffered saline (PBS). PB was collected by collecting 100 μL of blood. Red blood cells were lysed using an ammonium chloride solution. 7-Amino-actinomycin-D (7AAD) was used as a marker for viable cells. Countbright beads (BD Bioscience) were used to determine the number of PB cells. Cells were sorted and analyzed on the FACS Aria III (BD). The collected data were analyzed by FlowJo software (TreeStar). The antibodies used are shown in the supplemental Information.
Quantitative reverse transcription-polymerase chain reaction
Total messenger RNA was extracted from cells and tissue (RNeasy kit; Qiagen), and complementary DNA was synthesized with SuperScript III reverse transcriptase (Life Technology). Real-time PCR was performed on the 7900 HT Fast Real-Time PCR System (Applied Biosystems). Information on the primers used can be found in the supplemental Information.
Statistical analysis
Statistical significance was determined by using the Bonferroni method for comparison of multiple groups or the 2-tailed Student t test for comparison of 2 groups. All statistical analyses were performed with Prism (GraphPad).
Results
Increased circulating BA levels in chemotherapy-treated patients correlates with faster recovery
Levels of circulating BAs in the blood of pediatric patients who had cancer, including acute lymphoblastic leukemia, acute promyelocytic leukemia, acute myeloid leukemia, non-Hodgkin lymphoma, Ewing sarcoma, or neuroblastoma, were measured in 5 treatment phases: pretreatment, treatment, nadir, recovering, and posttreatment (Figure 1A-C; supplemental Table 1). These measurements showed that circulating BA levels were significantly higher after chemotherapy, most often during the recovering phase (Figure 1D). Blood BA levels generally occur in cases of cholestatic liver injury; however, there were no significant increases in the levels of ALT, GGT, and T-Bil (Figure 1E-G), indicating that the upregulation of circulating BAs in this phase may not be caused by acute liver dysfunction or severe liver damage. However, BA levels in the nadir and the recovering phases correlated positively, indicating that the degree of BA increase during recovery can be prospectively estimated based on BA levels at the nadir (Figure 1H). Of note, the BA concentration at the nadir and length of recovery (time from the nadir to nonneutropenia) had a significantly negative correlation, suggesting that high BA levels at the nadir may be an indication of faster recovery (Figure 1I). This possibility suggests that the increase in BAs in blood may be beneficial to patients. The data indicate that circulating BA levels are specifically increased during early recovery after chemotherapy, which may be independent of severe liver injury and is connected to faster recovery.
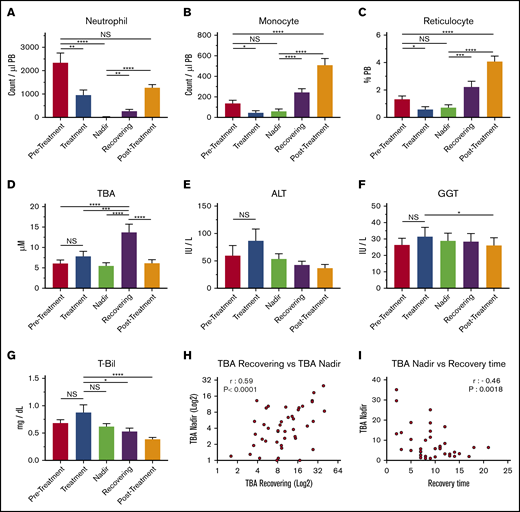
BAs in circulation are upregulated during the recovery of pediatric cancer patients. (A-C) PB cellularity in pediatric patients during chemotherapy protocol. Neutrophils (A), monocytes (B), and reticulocytes (C) were monitored during treatment. Samples were collected in the pretreatment, treatment, nadir, recovering, and posttreatment phases (n = 52). (D) TBA levels in patients’ plasma at the different time points. (n = 52). (E-G) Indications of liver damage. ALT (E), GGT (F), and T-Bil (G) are shown (n = 52). (H) Positive correlation of TBA levels between recovering and the nadir (n = 43). (I) Negative correlation between TBA levels at the nadir and recovery time. The recovery time was determined as days from the lowest (bottom phase) neutrophil count to the date when the count exceeded 500 cells per μL (n = 43). Results are presented as means ± SEM. *P < .05; **P < .01; ***P < .001; ****P < .0001. NS, not significant.
BAs in circulation are upregulated during the recovery of pediatric cancer patients. (A-C) PB cellularity in pediatric patients during chemotherapy protocol. Neutrophils (A), monocytes (B), and reticulocytes (C) were monitored during treatment. Samples were collected in the pretreatment, treatment, nadir, recovering, and posttreatment phases (n = 52). (D) TBA levels in patients’ plasma at the different time points. (n = 52). (E-G) Indications of liver damage. ALT (E), GGT (F), and T-Bil (G) are shown (n = 52). (H) Positive correlation of TBA levels between recovering and the nadir (n = 43). (I) Negative correlation between TBA levels at the nadir and recovery time. The recovery time was determined as days from the lowest (bottom phase) neutrophil count to the date when the count exceeded 500 cells per μL (n = 43). Results are presented as means ± SEM. *P < .05; **P < .01; ***P < .001; ****P < .0001. NS, not significant.
Circulating BAs increase in chemotherapy-treated mice because of altered BA production and reuptake in liver
To study the biological role of an increase in BAs in vivo, we injected 5-FU (a chemotherapeutic agent) into C57BL/6 mice as a surrogate for chemotherapy (Figure 2A). In a time course experiment, we tracked the PB and BM after the 5-FU treatment and recorded the number of myeloid cells in the PB, total BM cellularity, and the number of lineage-negative (lineage−) cells in the BM (Figure 2B-D). According to the cellularity of lineage− cells in the BM, we defined the stable low point at days 3 to 7 as the “bottom” phase and at days 8 to 13 as the “recovering” phase (Figure 2D). In addition, we analyzed untreated mice (“control”) and mice 21 days after treatment, generally considered to be fully recovered in BM and PB after 5-FU treatment (“full recovery” phase). In the bottom phase, total BA levels showed a moderate, nonsignificant increase in plasma. However, recovering samples displayed a significant increase in BA levels (Figure 2E), which was similar to the observation in the pediatric patients (Figure 1B). The elevation of blood BA levels was regarded as a transient event, as full recovery levels of circulating BAs returned to normal, similar to the controls (Figure 2E).
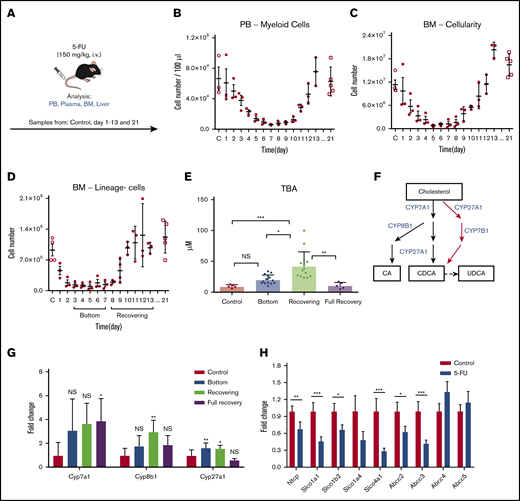
BAs in circulation are highly upregulated in a mouse model of chemotherapy. (A) The experimental setup of 5-FU treatment of mice. (B-D) 5-FU treatment and recovery in mice. PB total myeloid cellularity (B), BM total cellularity (C), and the number of lineage− cells (D) are shown (n = 3 for each time point). (E) TBA measurement in different phases of treatment and recovery in 5-FU–treated mice. (D) Different phases of treatment and recovery were based on lineage− cells (n = 5-14). (F) Production of primary BAs through the classic (black) and alternative (red) pathways. (G) Relative expression levels of key BA-producing enzymes in liver at different time points in 5-FU–treated mice. Fold change relative to control samples is shown (n = 5). (H) Expression changes in the main reuptake and efflux pumps in liver at recovery from 5-FU treatment, compared with the control. Fold change relative to control samples is shown (n = 5). Results are presented as means ± SEM. *P < .05; **P < .01; ***P < .001.
BAs in circulation are highly upregulated in a mouse model of chemotherapy. (A) The experimental setup of 5-FU treatment of mice. (B-D) 5-FU treatment and recovery in mice. PB total myeloid cellularity (B), BM total cellularity (C), and the number of lineage− cells (D) are shown (n = 3 for each time point). (E) TBA measurement in different phases of treatment and recovery in 5-FU–treated mice. (D) Different phases of treatment and recovery were based on lineage− cells (n = 5-14). (F) Production of primary BAs through the classic (black) and alternative (red) pathways. (G) Relative expression levels of key BA-producing enzymes in liver at different time points in 5-FU–treated mice. Fold change relative to control samples is shown (n = 5). (H) Expression changes in the main reuptake and efflux pumps in liver at recovery from 5-FU treatment, compared with the control. Fold change relative to control samples is shown (n = 5). Results are presented as means ± SEM. *P < .05; **P < .01; ***P < .001.
BAs are synthesized from cholesterol in the liver. In the main synthesizing pathway (classic pathway) Cyp7a1, Cyp8b1, and Cyp27a1 comprise the components, whereas Cyp27a1 and Cyp7b1 are involved in the alternative pathway (Figure 2F).17,18 To explore the mechanism behind the BA increase, we measured expression levels of these key enzymes. Gene expression analysis in livers from 5-FU–treated mice showed that Cyp7a1 was upregulated, but the difference was not significant, whereas Cyp27a1 was modestly upregulated during both the bottom and recovering phases. In contrast, Cyp8b1 was highly upregulated only during the recovering phase (Figure 2G), in which total BA levels showed significant elevation (Figure 2E). Upregulation of these enzymes may be a selective event, as other CYP enzymes not involved in BA synthesis (Cyp1a1, Cyp3a11, and Cyp5a1) did not show a significant increase (supplemental Figure 1A). BA synthesis is controlled through multiple regulatory circuits, including a negative feedback system mediated by binding of BAs to the farnesoid X receptor.17,18 An increased level of glucocorticoids has also been linked to an increase in circulating BAs.24,25 In 5-FU–treated mice, we detected a significant increase in corticosterone, a major glucocorticoid in rodents, during days 8 and 10, corresponding to the recovering phase (supplemental Figure 1B). Injection of corticosterone into untreated mice increased BA levels in the blood (supplemental Figure 1C), suggesting that the elevation of glucocorticoid level in the blood is a mechanism of BA induction.
Because the circulation of BAs in blood is also largely affected by activities of BA transporters in liver, we measured the gene expression levels of known import and export pumps of BAs in the livers of recovering mice. Several import pumps involved in the reuptake BAs from the hepatic circulation, such as Ntcp and organic anion-transporting polypeptides (Slco1a1, Slco1b2, and Slco4a1),26 were significantly downregulated, whereas some BA exporters (Abcc4, Abcc5) were unchanged (Figure 2H), suggesting that the efflux balance of BAs was altered under recovery conditions, which may also have contributed to the increased levels of BAs in plasma. The results of the murine model confirm the findings shown in the patient data, and its mechanism may be explained by a coordinated change of increased production and altered reuptake of BAs after chemotherapy.
Low levels of key BA-synthesizing enzymes predict poor recovery after chemotherapy in mice
Because Cyp8b1 expression was specifically upregulated during recovery, we decided to analyze Cyp8b1 KO mice.27 Cyp8b1 is involved in the classic pathway of BA synthesis, and the enzyme is responsible for the production of cholic acid (CA), one of the major BAs in both rodents and humans.18 Under steady-state conditions, the composition of BAs in Cyp8b1 KO mice is known to change drastically, characterized by a lack of CA and an abnormal increase in ursodeoxycholic acid (UDCA). These alterations result in a moderate increase in total BA levels caused by an impaired negative feedback signal.27 In the livers of these mice, expression levels of other key enzymes, Cyp7a1 and Cyp27a1, tended to correlate inversely with the Cyp8b1 expression, presumably compensating for the lack of Cyp8b1 enzyme (supplemental Figure 2A). Accordingly, Cyp8b1 KO mice showed no major differences in the hematopoietic profiles of PB and BM (supplemental Figure 2B).
To assess the impact of Cyp8b1 deletion during hematopoietic recovery, we injected Cyp8b1 KO and their littermate control mice with 5-FU (Figure 3A). Interestingly, heterozygous (HT) animals could be classified according to the 2 clearly distinct types of enzyme expression patterns that correlated with Cyp8b1 expression levels. Approximately one-third of HT mice showed a severe reduction in Cyp8b1, similar to KO animals, as well as a significant reduction in Cyp7a1 and Cyp27a1 (HT-low), whereas the rest of the HT mice showed normal expression of all 3 enzymes (HT-norm; supplemental Figure 2C). This heterogeneity within HT animals was not seen in the steady-state condition (supplemental Figure 2A), suggesting that the difference appears only under stress situations. We clarified that differences in sex and age of the HT animals did not influence the enzymatic patterns (data not shown). Because wild-type (WT) littermate animals and HT-norm exhibited almost identical enzyme expression patterns, we grouped these mice as (1) WT and HT-norm (WT/HT), (2) HT-low, and (3) KO (Figure 3A-B). Because the homozygous KO mice apparently compensated for their Cyp8b1 loss by upregulating Cyp7a1 and Cyp27a1 after treatment with 5-FU, they were excluded from further analysis (Figure 3B). After the 5-FU injections, HT-low animals showed significantly lower TBAs in blood than the WT/HT group (Figure 3C).
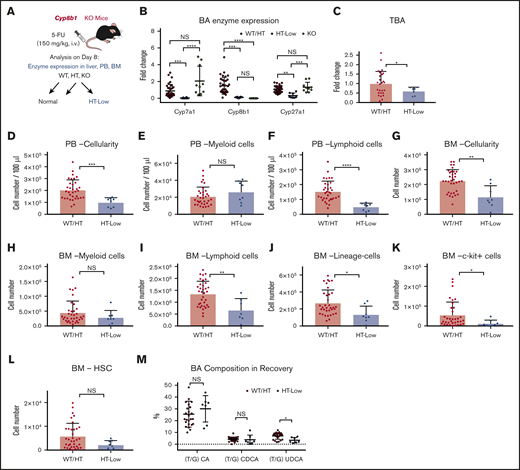
Low expression levels of key BA-producing enzymes predict poor recovery in mice. (A) The experimental setup of 5-FU treatment in Cyp8b1 KO mice. Heterozygous mice showing low messenger RNA expression levels of both Cyp7a1 and Cyp8b1 (0.01-fold compared with WT mice) were categorized as HT-low. (B) Expression of key BA-producing enzymes in Cyp8b1 KO mice. Gene expression levels relative to Actb are shown (n = 10-30). (C) TBA levels measured in plasma of Cyp8b1 KO mice on day 8 after 5-FU treatment. Fold change relative to WT/HT is shown (n = 7-26). (D-F) Cellularity in PB of WT/HT or HT-low mice on day 8 after 5-FU treatment. Total cellularity (D), myeloid cells (E), and lymphoid cells (F) are shown (n = 8-34). (G-I) Cellularity in BM of WT/HT or HT-low mice on day 8 after 5-FU treatment. Total cellularity (G), myeloid cells (H), and lymphoid cells (I) in femur and tibia are shown (n = 8-34). (J-L) Cellularity of primitive cells in BM of WT/HT or HT-low mice after 5-FU treatment. Lineage− cells (J), c-kit+ cells (K), and HSCs (defined as CD150+CD48−c-kit+Sca-I+lineage− cells) (L) in femur and tibia are shown (n = 8-34). (M) BA composition in recovery on day 8 after 5-FU injection (n = 7-24). Results are presented as means ± SEM. *P < .05; **P < .01; ***P < .001; ****P < .0001.
Low expression levels of key BA-producing enzymes predict poor recovery in mice. (A) The experimental setup of 5-FU treatment in Cyp8b1 KO mice. Heterozygous mice showing low messenger RNA expression levels of both Cyp7a1 and Cyp8b1 (0.01-fold compared with WT mice) were categorized as HT-low. (B) Expression of key BA-producing enzymes in Cyp8b1 KO mice. Gene expression levels relative to Actb are shown (n = 10-30). (C) TBA levels measured in plasma of Cyp8b1 KO mice on day 8 after 5-FU treatment. Fold change relative to WT/HT is shown (n = 7-26). (D-F) Cellularity in PB of WT/HT or HT-low mice on day 8 after 5-FU treatment. Total cellularity (D), myeloid cells (E), and lymphoid cells (F) are shown (n = 8-34). (G-I) Cellularity in BM of WT/HT or HT-low mice on day 8 after 5-FU treatment. Total cellularity (G), myeloid cells (H), and lymphoid cells (I) in femur and tibia are shown (n = 8-34). (J-L) Cellularity of primitive cells in BM of WT/HT or HT-low mice after 5-FU treatment. Lineage− cells (J), c-kit+ cells (K), and HSCs (defined as CD150+CD48−c-kit+Sca-I+lineage− cells) (L) in femur and tibia are shown (n = 8-34). (M) BA composition in recovery on day 8 after 5-FU injection (n = 7-24). Results are presented as means ± SEM. *P < .05; **P < .01; ***P < .001; ****P < .0001.
PB and BM cellularity was significantly lower in the HT-low group (Figure 3D,G). There was no significant difference in the number of myeloid cells in PB or BM (Figure 3E,H). However, the number of lymphoid cells was significantly lower in the HT-low group (Figure 3F,I), especially B cells in PB and BM (supplemental Figure 2D). The more primitive populations (eg, lineage− cells) showed a similar tendency of lower numbers in the HT-low group, although some of these differences were not statistically significant (Figure 3J-L).
Next, we measured the BA composition in the Cyp8b1 KO model recovering from 5-FU treatment. Differences in molecular characteristics of each BA have been reported, which is also relevant to the supportive function of BAs in hematopoietic cells. In our previous work, we demonstrated that TUDCA and taurocholic acid (TCA), but not other major BAs, including taurochenodeoxycholic acid and the muricholic acids, maintain functional LT-HSCs in vitro.15 Thus, the type of BA that increases after chemotherapy may affect the regenerative process of the hematopoietic system. In the recovering mice, an increase in TUDCA was detected in the WT/HT mice, whereas this induction was not seen in the HT-low group. As reported earlier, the TUDCA level was significantly higher in the KO mice, which may compensate for the lack of TCA after Cyp8b1 deletion (Figure 3M). These observations may indicate that low expression of key BA-synthesizing enzymes and changed composition of BAs in blood are consistent with poor early recovery of PB and BM after 5-FU treatment.
BA supplementation results in improved recovery after 5-FU treatment
Next, we wondered whether increased BA levels enhance the recovery of hematopoietic activity under stress conditions after chemotherapy. To test this hypothesis, 5-FU–treated mice were injected with TUDCA (Figure 4A).12,15 First, we injected TUDCA on days 4 and 5 after 5-FU treatment and analyzed PB and BM on day 6 to evaluate the supportive function of TUDCA for primitive cells during initial recovery. TUDCA injections resulted in significantly increased cellularity in BM (Figure 4B), lineage− cells (Figure 4C), and HSPCs (Figure 4D) on day 6. Next, the injection period for TUDCA was extended to day 7, and the mice were analyzed on day 8. The BM of mice treated with TUDCA showed a significant increase in cellularity (Figure 4E). Accordingly, myeloid, lymphoid, and lineage− cells were significantly increased (Figure 4F-H). At this time point after 5-FU treatment, cells expressing c-kit (c-kit+ cells) are usually severely reduced in BM. Evidently, TUDCA supports faster recovery, as seen by the significant increase in c-kit+ cells (Figure 4I) and therefore also primitive cells (c-kit+ cells, KSL cells, and HSCs; Figure 4J-L). At day 12, a significant difference in TUDCA supplementation was seen only in lineage− cells, suggesting that the benefit of TUDCA is limited to the early phase of recovery (supplemental Figure 3A-B). In contrast, injection of TUDCA into untreated mice did not show a difference (supplemental Figure 3C). These data indicate that BA supplementation supports early recovery of hematopoietic cells after chemotherapy.
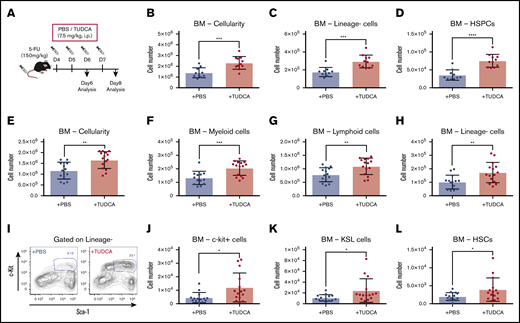
BA supplementation improves recovery after 5-FU chemotherapy. (A) The experimental setup of TUDCA supplementation in 5-FU–treated mice. (B-D) Cellularity in BM of TUDCA-treated mice on day 6. Total BM cells (B), lineage− cells (C), and HSPCs (defined as lineage−CD48−CD244−CD150+ cells) (D) in femur and tibia are shown (n = 10-11). (E-H) Cellularity in BM of TUDCA-treated mice on day 8. Total BM cells (E), myeloid cells (F), lymphoid cells (G), and lineage− cells (H) in femur and tibia are shown (n = 14-15). (I) Flow cytometry plots showing the Sca-I and c-kit expression pattern on lineage− BM cells of PBS- and TUDCA-treated mice on day 8. The gate represents c-kit+Sca-I+lineage− (KSL) cells. (J-L) Cellularity of primitive cells in BM of the TUDCA-treated mice on day 8. c-Kit+ cells (J), KSL cells (K), and HSCs (defined as CD150+CD48−KSL) (L) in femur and tibia are shown (n = 14-15). Results are presented as means ± SEM. *P < .05; **P < .01; ***P < .001; ****P < .0001.
BA supplementation improves recovery after 5-FU chemotherapy. (A) The experimental setup of TUDCA supplementation in 5-FU–treated mice. (B-D) Cellularity in BM of TUDCA-treated mice on day 6. Total BM cells (B), lineage− cells (C), and HSPCs (defined as lineage−CD48−CD244−CD150+ cells) (D) in femur and tibia are shown (n = 10-11). (E-H) Cellularity in BM of TUDCA-treated mice on day 8. Total BM cells (E), myeloid cells (F), lymphoid cells (G), and lineage− cells (H) in femur and tibia are shown (n = 14-15). (I) Flow cytometry plots showing the Sca-I and c-kit expression pattern on lineage− BM cells of PBS- and TUDCA-treated mice on day 8. The gate represents c-kit+Sca-I+lineage− (KSL) cells. (J-L) Cellularity of primitive cells in BM of the TUDCA-treated mice on day 8. c-Kit+ cells (J), KSL cells (K), and HSCs (defined as CD150+CD48−KSL) (L) in femur and tibia are shown (n = 14-15). Results are presented as means ± SEM. *P < .05; **P < .01; ***P < .001; ****P < .0001.
Agents that inhibit ER stress responses support faster recovery after chemotherapy
In previous work, we have shown that BAs, especially TUDCA, can act as a chemical chaperone that suppresses the ER stress pathway in expanding HSCs.12,15 To test whether ER stress inhibition would improve recovery of the hematopoietic system after chemotherapy, we injected SB, which is known to attenuate ER stress responses (Figure 5A).14,28 Cellularity in BM of SB-treated mice was significantly higher than in control mice, as was the number of linage− cells (Figure 5B-C). Of note, the number of B cells increased significantly in BM and PB (Figure 5D-E), whereas other cell types did not show significant changes (supplemental Figure 4A). This finding may be attributable to the preferential effect of the elevation of ER stress on B cells and HSPCs.29

Lowering of the ER stress response supports faster recovery after chemotherapy. (A) The experimental setup of 5-FU and SB injection into mice. (B-D) Cellularity in BM and PB of the SB-treated mice on day 8. Total BM cells (B), BM lineage− cells (C), BM B cells (D), and PB B cells (E) in femur and tibia are shown. (F) The experimental setup of 5-FU treatment of Ddit3 KO mice (n = 13). (G-K) Cellularity in BM and PB of treated Ddit3 KO mice on day 8. Total BM (G), lineage− cells (H), c-kit+ cells (I), KSL cells (J), and HSCs (defined as CD150+CD48− KSL) (K) in BM of the treated Ddit3 KO mice are shown (n = 11). (L) Lineage− BM cells of WT or Ddit3 KO mice on day 8 after 5-FU treatment, with or without supplementation of TUDCA. Mice were compared with KO mice that were treated with PBS (n = 5-15). Results are presented as means ± SEM. *P < .05; **P < .01; ***P < .001.
Lowering of the ER stress response supports faster recovery after chemotherapy. (A) The experimental setup of 5-FU and SB injection into mice. (B-D) Cellularity in BM and PB of the SB-treated mice on day 8. Total BM cells (B), BM lineage− cells (C), BM B cells (D), and PB B cells (E) in femur and tibia are shown. (F) The experimental setup of 5-FU treatment of Ddit3 KO mice (n = 13). (G-K) Cellularity in BM and PB of treated Ddit3 KO mice on day 8. Total BM (G), lineage− cells (H), c-kit+ cells (I), KSL cells (J), and HSCs (defined as CD150+CD48− KSL) (K) in BM of the treated Ddit3 KO mice are shown (n = 11). (L) Lineage− BM cells of WT or Ddit3 KO mice on day 8 after 5-FU treatment, with or without supplementation of TUDCA. Mice were compared with KO mice that were treated with PBS (n = 5-15). Results are presented as means ± SEM. *P < .05; **P < .01; ***P < .001.
To further confirm the implication of the ER stress pathway in hematopoietic recovery, Ddit3 (CHOP) KO mice were used. CHOP is one of the key components in ER stress-driven apoptosis,30 and depletion of it is expected to attenuate the induction of apoptosis after ER stress elevation. We treated Ddit3 KO mice with 5-FU, and analysis was performed on day 8 (Figure 5F). In line with our previous results, there was a significant increase in total cellularity in blood that was specific for lymphoid, but not myeloid, cells. This increase was mostly explained by an increase in B cells (supplemental Figure 4B). In BM, there was no difference in total cellularity, myeloid cells, or lymphoid cells (Figure 5G; supplemental Figure 4B). However, the more primitive cells in BM showed improved recovery, with significantly higher levels of lineage− cells, c-kit+ cells, KSL cells, and HSCs in Ddit3 KO mice compared with WT mice (Figure 5H-K). Of note, TUDCA injections into Ddit3 KO mice did not induce additional enhancement of early hematopoietic recovery (Figure 5L), suggesting that the mechanism of action for TUDCA treatment was through ER stress suppression.
Discussion
Proper recovery of blood production is essential for successful continuation of cycles of chemotherapy. Any delay in recovery can reduce the efficacy of the cancer treatment and put the patient at risk of serious infections.1,31 An early, reliable marker of recovery would therefore be highly valuable in the clinic for predicting possible outcomes, tailoring treatments, and indicating the need for early intervention. An unexpected finding was that the total levels of circulating BAs increased during BM recovery from myelosuppression in pediatric cancer patients after chemotherapy (Figure 1D). We have observed this phenomenon to be commonly independent of disease types or treatment protocols (data not shown). This surge in circulating BAs is not coupled with severe liver injury and chronic liver dysfunction (Figure 1E-G). BA levels at the nadir and in the recovering phase have a positive correlation (Figure 1H), possibly enabling prediction of BA levels at an early stage of treatment. In fact, plasma concentrations of BA at the nadir and the length of recovery of the BM had a significantly negative correlation (Figure 1I), indicating that BA concentration in blood at the nadir could be a diagnostic marker that can be used to forecast faster recovery of patients from myelosuppression. Mass spectrometry analyses showed that the composition of increased BAs in those patients was highly variable. However, all 4 cases in which we analyzed the composition of the patients’ BAs, glycochenodeoxycholic acid and glycoursodeoxycholic acid were detected (data not shown). Glycochenodeoxycholic acid and UDCA (and its conjugated forms) are known to benefit cells through various mechanisms, such as detoxification and ER stress reduction.32,33
In a mouse model, we reproduced the increase in circulating BA levels after chemotherapy (Figure 2E), similar to that observed in patients. In mice, the BA increase correlated more closely with the early expansion of primitive hematopoietic cells in BM (Figure 2C-D), rather than in PB (Figure 2B). In a clinical setting, it is imperative to estimate the recovery of hematopoietic activity in patients, so that the next phase of chemotherapeutic treatment can be started according to the treatment regimen. Because BA induction seems to reflect early BM recovery before PB recuperation, measuring circulating BA levels would be an easy, noninvasive way to assess BM recovery. The mechanism behind the BA induction is still not completely clarified; however, we found upregulation of BA-synthesizing enzymes and downregulation of transporters controlling the reuptake of BAs in the liver (Figure 2G-H). These data indicate that BA synthesis is enhanced, together with altered circulation of BA, which further increases the concentration of BAs in blood. These changes may be triggered by glucocorticoid signals, as we detected elevated corticosterone levels in PB and demonstrated that injection of corticosterone resulted in an increase in circulating BA levels (supplemental Figure 1).
Importantly, induction of endogenous BAs is regarded as a natural response that supports recovery of damaged organs and tissues, at least the hematopoietic system. In the Cyp8b1 KO mouse model, some of the HT animals with low expression of BA-synthesizing enzymes (HT-low; Figure 3A-B) exhibited poor recovery of hematopoietic cells after 5-FU treatment (Figure 3D-L). The Cyp8b1 KO mice have a different composition in their BA pool, switching almost entirely from a hydrophilic, TCA dominant BA pool, to a hydrophobic TCDCA dominant BA pool.27 In addition, one of the most potent BAs, TUDCA, is increased in KO animals.27 These facts indicate that BA composition, as well as the total amount, is a part of the key mechanism. BA supplementation with TUDCA resulted in an increased speed of recovery of 5-FU–treated mice (Figure 4). Compared with current options that stimulate unilineage reconstitution, such as G-CSF, TUDCA treatment supported multilineage replenishment (Figure 4E-L). This finding is highly beneficial to patients, because quick buildup of multilineage blood cells is crucial in avoiding a variety of complications that could occur in parallel.
Prolonged or severe ER stress can induce apoptosis that is believed to represent a self-protection mechanism that actively eliminates cells that accumulate unfolded or misfolded proteins and are therefore at a higher risk of oncogenic transformation.34,35 ER stress inhibitors showed a significant improvement in early hematopoietic recovery (Figure 5B-E) at first glance. However, abrogation of the ER stress–related clearance mechanism could lead to the survival of abnormal “junk” cells, which may result in long-term complications. In contrast, chemical chaperones supporting protein folding, such as TUDCA, function by preventing the formation of unfolded and misfolded proteins, therefore reducing the triggering of the ER stress response.36 TUDCA therefore targets the cause of the unfolded protein response, rather than forcibly blocking the ER stress response, which could prove to be a safer and more effective treatment. On the other hand, SB treatment worked slightly better than TUDCA treatment (Figure 5B-E). This may be explained by the fact that SB affects eIF2α,14,28 the phosphorylation of which plays a central role in a broader stress response: the so-called integrated stress response.37,38 Therefore, it can be induced, not only by unfolded or misfolded protein accumulation but also by other types of stress factors, such as amino acid starvation, oxidative stress, glucose deprivation, and iron deficiency. It is likely that multiple factors negatively affect hematopoietic recovery after chemotherapy.
In conclusion, this work has unveiled a novel role for BAs in early recovery after chemotherapy. BA levels could be monitored to predict recovery from treatment, and, according to our findings, could provide a druggable mechanism that could be used in patients to improve recovery and successful completion of the treatment protocol. TUDCA is in current use in the clinic to support digestion, dissolve radiolucent gallstones, and treat cirrhosis of the liver. The benefit of using TUDCA may involve not only ER stress inhibition, but also its counteracting function against more harmful BAs.39 We conclude from our data that BA monitoring during recovery may be useful for predicting faster recovery and treatment with TUDCA is a potential instrumental approach that supports early recovery from myelosuppression.
For all original data, please contact the corresponding author.
Acknowledgments
The authors thank Mika Tokuyama for critical comments on the project and Chiaki Nishimura for assistance in the data analysis.
This work was supported by the Swedish Research Council (K.M.) and the Swedish Cancer Foundation (K.M. and V.R.). V.S. was funded by the Swedish Child Cancer Foundation. K.M. was funded by the StemTherapy program at Lund University.
Authorship
Contribution: K.M. and A.O. organized the project; V.S., Y.H., A.O., and K.M. designed the project; V.S., Y.H., H.T., V.R., M.S., M.v.d.G., E.M., S.K. and S.S. performed the experiments; C.O.-H., M.G., and H.N. supported the experiments; and V.S., E.M., and K.M. wrote the manuscript.
Conflict-of-interest disclosure: The authors declare no competing financial interests.
Correspondence: Kenichi Miharada, Division of Molecular Medicine and Gene Therapy, Lund Stem Cell Center, Lund University, BMC A12, Solvegatan 17, 22184 Lund, Sweden; e-mail: kenichi.miharada@med.lu.se.

