

Key Points
Fecal concentrations of protective SCFAs are linked with aGVHD severity.
Qualitative and quantitative depletions of specific SCFA-producing bacteria are observed in severe aGVHD.

Abstract
Acute graft-versus-host disease (aGVHD) is the main complication of hematopoietic stem cell transplantation (HSCT). Changes in gut microbiota composition have been associated with subsequent aGVHD, and reconstitution of healthy microbiota is currently being explored as a therapeutic approach. However, the specific actors in the intestinal ecosystem involved in the pathologic process at the time of aGVHD onset are not yet fully known. We prospectively collected stool samples from patients who underwent allogeneic HSCT. Patients sampled at aGVHD onset were compared with non-GVHD patients. To identify phylogenetic and functional signatures of the disease process, we determined fecal short-chain fatty acid (SFCA) profiles and used high-throughput DNA sequencing and real-time quantitative polymerase chain reaction to assess the microbiota composition. Microbiota alterations were highly specific of gastrointestinal (GI) aGVHD severity. Bacterial biomass and α-diversity were lower in severe aGVHD. We identified several bacterial signatures associated with severe aGVHD at disease onset; a negative correlation was observed with anaerobic bacteria of the Lachnospiraceae, especially the Blautia genus, and Ruminococcaceae families. In parallel, in severe aGVHD patients, we showed a dramatic decrease in the levels of the main SFCAs: acetate (75.8%), propionate (95.8%), and butyrate (94.6%). Mild aGVHD patients were characterized by conserved levels of propionate and Blautia propionate producers. Butyrate was significantly decreased in all GI aGVHD stages, representing a potential diagnostic marker of the disease. Specific microbiota and metabolic alterations were thus associated with aGVHD severity and may be useful for diagnostic and pathophysiologic purposes.
Introduction
Allogeneic hematopoietic stem cell transplantation (allo-HSCT) is a potentially curative treatment for a wide range of hematologic disorders.1 Its main complication, acute graft-versus-host disease (aGVHD), affects 50% to 70% of patients and leads to high transplantation-related mortality. First-line therapy for aGVHD with corticosteroids leads to a 40% to 70% response rate. At disease onset, diagnosis relies on clinical, pathologic, and endoscopic parameters that are poorly correlated.2 More recently, biomarkers have been developed with the aim of predicting prognosis of aGVHD at disease onset.3-5
Several disease processes are associated with alterations in the gut microbiome, especially in intestinal inflammatory disease.6 Production of microbial-derived metabolites may play an important role in these diseases. aGVHD is associated with deregulation in host systemic and local immunities, potentially modulated by gut bacteria.7 It is associated with alterations in intestinal microbiota composition, but whether production of bacteria- or virus-derived metabolites is altered has been poorly explored in humans.8
Low bacterial species diversity and lack of Blautia species were previously shown to be associated with increased risk of death.9-11 GVHD-related mortality was also shown to be associated with the use of broad-spectrum antibiotics after HSCT.12 More recently, a positive correlation between presence of oral Actinobacteria and oral Firmicutes and a negative correlation between presence of Lachnospiraceae and subsequent development of severe aGVHD were demonstrated.13 These data showed a relationship between aGVHD development and gastrointestinal (GI) dysbiosis. However, most studies have focused on the early post-HSCT period, at neutrophil recovery. Specific bacterial alterations in the host microbiota implicated in the aGVHD process at the onset of intestinal inflammation have been explored in adult patients by Jenq et al.14 Moreover, it is unknown whether changes in microbial populations induce modifications in bacteria-derived metabolites, which may have consequences in HSCT patients. Indeed, in a recent high-throughput analysis of the plasmatic metabolome in patients at the onset of aGVHD, we found significant variation in microbiota-derived metabolites.15 Short-chain fatty acids (SCFAs) are major microbial-derived metabolites found exclusively in the intestinal tract. SCFAs are involved in important functions such as epithelial barrier integrity, regulation of the immune system, and colonocyte survival.16 In murine models, emerging data showed that aGVHD is influenced by alterations in the microbiota-derived metabolites and that butyrate, 1 of the 3 main SCFAs, has a protective effect against aGVHD.17-19
Given the current development of new therapeutic approaches aiming to modulate the gut microbiota such as fecal transplantation in aGVHD, it seems important to determine precisely which changes in the microbiota and its metabolites are specifically correlated with aGVHD at the time of the first digestive symptoms. In this study, we investigated the fecal microbial metabolome focusing on SCFAs at aGVHD onset. In parallel, we performed a large analysis of the intestinal microbiota using molecular profiling by sequencing the V3 to V4 regions of the 16S ribosomal (rRNA) gene and real-time quantitative polymerase chain reaction (qPCR). We identified a major microbiome shift in aGVHD patients with severe disease at the initial stage and determined specific bacterial signatures and the SCFA profile associated with severe aGVHD.
Methods
Study design
Patients analyzed in this study were all hospitalized for allo-HSCT in the Hematology and Transplantation Unit of Saint-Louis Hospital, Paris, France, and enrolled in the Cryostem cohort, sponsored by the French Research National Agency. We collected weekly stool samples from allo-HSCT patients during hospitalization. Patients for whom a stool sample was collected at the time of acute GVHD onset (−2 or +7 days) were enrolled. The onset of aGVHD was defined as the first day of treatment with steroids. Controls were non-GVHD patients meeting eligibility for inclusion: absence of aGVHD in any target organ, a stool sample collected in the same posttransplantation week as the GVHD patients, and age within ±5 years and transplantation date within ±6 months of the GVHD patients. The study was approved by the Research Ethics Committee of “Ile de France IV” (institutional review board #00003835). All patients provided written informed consent for enrollment in this noninterventional study.
Clinical data
Clinical data were extracted from patient medical records, including age, diagnosis, HLA matching between donor and recipient, conditioning regimen, presence or absence of GVHD, and graft characteristics. In individuals with aGVHD, the date of GVHD onset, involved organs, stage and grade, and response to steroid treatment were recorded. In cases of death, date and cause of death were also recorded. aGVHD was diagnosed according to standard criteria.20 Histologic criteria of enteric GVHD were assessed from biopsies of the GI tract, as previously described.2 All individuals with aGVHD grade ≥2 were treated with corticosteroids (dose, 1-2 mg/kg per day). All patients had stage 2 to 4 gut aGVHD, referred to as severe aGVHD hereafter. Steroid-refractory aGVHD was defined as progression at day 3, stable disease on day 7, or absence of remission 2 weeks after initiation of corticosteroids.
Sample collection and DNA extraction
Fecal samples were processed in the microbiology laboratory at Saint-Louis Hospital and frozen at −80°C within 4 hours after collection. Total DNA was extracted from 0.2 g of fecal sample using the noncommercial extraction protocol H, recommended by the International Human Microbiome Consortium (standard operating protocol 07) and detailed in the data supplement.21,22 A negative control, in which the feces were replaced with DNA-free water, was extracted simultaneously with the patient samples. Briefly, guanidine thiocyanate and 10% N-lauroyl sarcosine were added to frozen feces. After thawing, 5% N-lauroyl sarcosine was added for cell lysis. To improve cellular lysis, glass beads were added and agitation carried out in a Bead Beater. Polyvinylpolypyrrolidone was added to ensure removal of polyphenol contamination. Pellets were then washed 3 times with TENP, and supernatants were pooled. Isopropanol was used to precipitate nucleic acids. DNA pellets were then dissolved with phosphate buffer and potassium acetate to allow the impurities to precipitate. The final steps were RNA digestion and DNA purification by precipitation. DNA concentration and integrity were determined visually by electrophoresis on 1% agarose gel containing ethidium bromide and spectrophotometrically determined by Nanodrop (Thermo Scientific). DNA extracts were stored at −20°C until analysis.
Next-generation sequencing and bioinformatic analysis
Fecal bacterial composition and diversity were assessed by 16S rRNA gene sequencing. Variable regions V3 to V4 of the 16S rRNA gene were amplified by PCR using universal bacterial primers specifically for use with Illumina MiSeq (F: NNNNN CCT ACG GGN GGC WGC AG; R: NNNNN GAC TAC HVG GGT ATC TAA TCC). Nextera XT sample libraries were prepared, and the Illumina MiSeq platform was used for paired-end sequencing (Microsynth AG, Balgach, Switzerland). Next-generation sequencing data sets were analyzed using the open-source bioinformatic pipeline FROGS (Find, Rapidly, OTUs [operational taxonomic units] with Galaxy Solution).23 After trimming the primers and barcodes, the sequences were filtered for removal of chimera and low-quality sequences (minimum length, 380 bp) and clustered into OTUs. OTUs were assigned to different taxonomic levels using the National Center for Biotechnology Information reference databases and Ribosomal Database Project Classifier. Three samples could not be analyzed because of an amplification failure in sequencing (control patients). Three other samples provided low numbers of sequences (<350 reads) and were discarded from the sequencing analysis (control, n = 1; aGVHD stage 2-3, n = 2).
Real-time PCR
Real-time qPCR was used to quantitatively assess the composition of the microbiota. Specific regions of the 16S rRNA gene were amplified using primers and probes previously designed (supplemental Table 1).24,25 TaqMan qPCR was used to quantify the total bacterial population and the dominant bacterial groups Clostridium cluster IV (Clostridium leptum group) and Bacteroides/Prevotella group. qPCR using SYBR green was performed to quantify the Lactobacillus/Leuconostoc/Pediococcus group, Clostridium cluster XIVa (Blautia coccoides group, previously named Clostridium coccoides), Clostridium cluster I/II, Enterococcus genus, and Escherichia coli. Detection was achieved using an ABI Prism 7300 sequence detector system (Applied Biosystems, Courtaboeuf, France). Standard curves were obtained from serial dilutions of a known concentration of plasmid DNA containing a 16S rRNA gene insert from each species or group. The coefficients of correlation between log10 colony-forming units (CFUs) and rRNA gene copy numbers for each species and group were obtained from rrnDB (https://rrndb.umms.med.umich.edu/), which allowed for the calculation of the number of CFUs per gram of feces.
SCFA analysis
Total SCFAs and acetate, propionate, and butyrate concentrations were analyzed using gas-liquid chromatography after the aqueous extraction of acidified samples (Nelson 1020; Perkin-Elmer, St Quentin en Yvelines, France), as described by Djouzi et al.26 Gas chromatography was performed using a polyethylene glycol Nucol column (Supelco, Saint-Quentin Fallavier, France) under isothermal conditions in an oven at 100°C, with a hydrogen flow rate of 10 mL per minute, an on-column injector operating at 200°C, and a flame ionization detector operating at 240°C. Quantification was performed by calibration to internal standards and expressed in micromoles per gram of stool.
Statistical analysis
Statistical analysis was carried out using the R environment (with the packages vegan, coin, ade4, phyloseq, mixOmics, compositions, and zCompositions) and GraphPad Prism V.5 (San Diego, CA). Two-sample comparisons were statistically assessed using the nonparametric Wilcoxon-Mann-Whitney test. Ties were handled by computing midrank scores, and the exact distribution of the test statistic was used to compute P values. In the case of multiple comparisons, false discovery rate adjustment was applied to P values.
To eliminate nonspecific variations and potential contaminants in the microbiota, only the OTUs that represented 99% of all reads and were present in >5 patients were considered. α-diversity differences between patient groups were assessed by comparing the observed, Chao1, and Simpson diversity indices computed for each sample. To analyze β-diversity and determine how aGVHD severity may be associated with changes in microbiota composition, a constrained analysis of principal coordinate ordination was performed on dissimilarity matrix tables (Jacard and Bray-Curtis) of samples per patient groups. A permutational multivariate analysis of variance algorithm was used to analyze these distance matrices.
To identify microbiota-specific bacterial signatures of patients with severe aGVHD, several statistical models for analyzing sequencing data were tested on raw and transformed data. A sparse partial least squares (PLS) discriminant analysis (DA) algorithm was applied to sequencing data at the genus level.27 The multistep linear DA (LDA) effect size algorithm and the differential gene expression analysis (DESeq2) were used on sequencing data to search for multivariable biomarkers of severe aGVHD.28,29 Sparse PLS regression on data transformed by centered log ratio was used to search for correlation with the SCFA concentrations.
Results
Patient characteristics
We collected weekly stool samples from patients who underwent HSCT for hematologic disorders during transplantation hospitalization. Between 21 January 2013 and 31 October 2016, 316 patients were enrolled in the study, and 35 patients who developed gut aGVHD were sampled at disease onset. We selected 35 patients for inclusion in our non-GVHD cohort. Patient characteristics are summarized in supplemental Tables 2 and 3. aGVHD patients were classified according to stage of gut aGVHD at diagnosis; stage 1 patients were classified as having mild aGVHD (n = 18), whereas those with stage 2 or 3 disease were classified as having severe aGVHD (n = 17). After a follow-up period of 1 year, 45 patients were alive, including 26 controls and 19 aGVHD patients. Regarding primary diseases, the aGVHD group included more myelodysplastic syndrome patients than the control group, and the control group included more acute leukemia patients than the aGVHD group. We found no significant differences among aGVHD patients and controls in term of sex, age, stem cell source, or HLA disparity. GVHD and non-GVHD patients had similar exposures to antibiotics during the period of stool collection. In our unit, gut decontamination before transplantation with ofloxacin and amoxicillin was still common practice for all patients at the time of this study. After transplantation, all patients were thus exposed to antibiotics. Types of antibiotics administered at the time of sampling are shown in supplemental Figure 1.
Distinct microbial alterations associated with aGVHD severity
First, the global number of bacteria in the intestinal microbiota was determined using real-time qPCR targeting 16S regions to estimate the richness of the ecosystem. Surprisingly, no difference was found in the total count of bacteria between control and aGVHD patients (Figure 1A). Patient stratification by severity of disease showed discrepancies between aGVHD patients. Mild aGVHD patients showed a total bacterial load similar to that of controls (respectively, 10.4 and 10.2 log CFU/g), whereas severe aGVHD patients harbored a significantly lower count of bacteria (9.1 log CFU/g; P = .003; Figure 1B). We used multiple indexes to determine the α-diversity of the microbiota for each patient. Diversity was significantly lower at aGVHD onset but only in patients with severe aGVHD (observed P = .016; Chao1 P = .039; Simpson P = .013; Figure 1C-D).
![Microbial community profiles are distinct based on total bacterial load and diversity according to severity of gut aGVHD. Absolute abundance of the 16S rRNA gene in control and aGVHD patients (A) and abundance according to severity of gut aGVHD (control vs GVHD stage 2-3, P = .003; GVHD stage 1 vs stage 2-3, P = .004) (B). Bacterial α-diversity using the Chao1 diversity index in control and aGVHD patients (C) and α-diversity according to severity of gut aGVHD (control vs GVHD stage 2-3, P = .039) (D). (E) Constrained analysis of principal coordinates (CAP) plot of samples in control and severe aGVHD patients on the Jacard distance metrics (permutational multivariate analysis of variance [PERMANOVA] P = .008). Statistical analyses were performed using Wilcoxon-Mann-Whitney test with false discovery rate (FDR) correction for multiple testing and PERMANOVA. FDR *P < .05, **P < .01. cc, Jacard distance.](https://ash.silverchair-cdn.com/ash/content_public/journal/bloodadvances/4/9/10.1182_bloodadvances.2020001531/2/m_advancesadv2020001531f1.png?Expires=1768357560&Signature=wwryABfzojPXsSOuCvZwNmqX4yL45jmQFETKt1Vna5Afk3JEU72dFybwQ1~xM~bps4FEo5p3r~feliQTsd2PCUq6KzNosLPJh8o-Yhz8wZCv-3leJJD6JBA8IINJ5Na7XbqVDwpWuMEGk7A0QmwSZ5J91YPRxXalCbRNfwP2ODO4PuoMj4PoNizJU6l8CDjq~GGrBJbJnM7s4AK6QXqdVjkXHEP1u~uGBM4xlHoSbHW40~POrvKT7O~isg5GcooCZqhUFLX7bgNgoxw9tJN454bD4jOlSphtqlIDCDTyw44Od6YxJpl98Q7HBBSCN7xyuy0BC3YysuxD4mDsPaNiIg__&Key-Pair-Id=APKAIE5G5CRDK6RD3PGA)
Microbial community profiles are distinct based on total bacterial load and diversity according to severity of gut aGVHD. Absolute abundance of the 16S rRNA gene in control and aGVHD patients (A) and abundance according to severity of gut aGVHD (control vs GVHD stage 2-3, P = .003; GVHD stage 1 vs stage 2-3, P = .004) (B). Bacterial α-diversity using the Chao1 diversity index in control and aGVHD patients (C) and α-diversity according to severity of gut aGVHD (control vs GVHD stage 2-3, P = .039) (D). (E) Constrained analysis of principal coordinates (CAP) plot of samples in control and severe aGVHD patients on the Jacard distance metrics (permutational multivariate analysis of variance [PERMANOVA] P = .008). Statistical analyses were performed using Wilcoxon-Mann-Whitney test with false discovery rate (FDR) correction for multiple testing and PERMANOVA. FDR *P < .05, **P < .01. cc, Jacard distance.
Microbial community profiles are distinct based on total bacterial load and diversity according to severity of gut aGVHD. Absolute abundance of the 16S rRNA gene in control and aGVHD patients (A) and abundance according to severity of gut aGVHD (control vs GVHD stage 2-3, P = .003; GVHD stage 1 vs stage 2-3, P = .004) (B). Bacterial α-diversity using the Chao1 diversity index in control and aGVHD patients (C) and α-diversity according to severity of gut aGVHD (control vs GVHD stage 2-3, P = .039) (D). (E) Constrained analysis of principal coordinates (CAP) plot of samples in control and severe aGVHD patients on the Jacard distance metrics (permutational multivariate analysis of variance [PERMANOVA] P = .008). Statistical analyses were performed using Wilcoxon-Mann-Whitney test with false discovery rate (FDR) correction for multiple testing and PERMANOVA. FDR *P < .05, **P < .01. cc, Jacard distance.
Constrained analysis of principal coordinate ordination was used to model the phylogenetic dissimilarity (β-diversity) between patient groups. A significant separation was observed only between control and severe aGVHD patients using Jacard and Bray-Curtis dissimilarities (Jacard P = .008; Bray-Curtis P = .018); however, the variance explained by the first component was very low (respectively, 4.2% and 4.6%; Figure 1E). Therefore, the dissimilarity between microbiota profiles could be due to a small number of species or to sparse species, in association with the great variability of the other profiles.
These data demonstrate that microbial alterations associated with aGVHD are distinct according to disease severity at disease onset. Patients with severe aGVHD presented with particular microbiota distortions, whereas patients with mild aGVHD had microbiota more similar to those of controls. Given these results, we decided to stratify the aGVHD patients according to the severity of their illness for the following analyses.
Characterization of the enteric microbiota in HSCT patients according to aGVHD severity
Sequencing analyses of microbiota at different phylogenetic levels revealed a high variability in microbiota profiles within each group of patients (supplemental Figure 2). Some patients harbored a healthy repartition in the phylogenetic groups, and others had a dramatically altered microbiota with a collapse of the relative abundance of Bacteroidetes or Firmicutes. Therefore, no characteristic profile could be defined. Results of the negative controls are presented in supplemental Table 4, showing that almost all of the detected OTUs were eliminated by the filter used to process the patient data before analysis.
To quantify the absolute change in bacteria at aGVHD time, 7 major species or bacterial groups of the gut microbiota were quantified using qPCR (supplemental Figure 3). We observed a significant depletion of the Blautia coccoides group (cluster XIVa) in patients with severe aGVHD (median, 5.4 log CFU/g) compared with controls (7.6 log CFU/g; P = .007) and mild aGVHD patients (7.1 log CFU/g; P = .036). Moreover, Blautia coccoides bacteria were detectable in 91.4% of controls and in only 52.9% of severe aGVHD patients (77.8% of mild aGVHD patients). A trend in decreased representation was also observed in levels of the Bacteroides/Prevotella group, Clostridium cluster IV, and Enterococcus in severe aGVHD patients compared with controls, but this did not reach statistical significance.
Microbiome signatures of severe aGVHD
Models using PLS and PLS DA on raw and transformed sequencing data showed that no global profile was associated with severe aGVHD. Therefore, different approaches were used to identify microbiota-specific bacterial signatures of patients with severe aGVHD (Figure 2A-C). We focused on the most abundant bacterial families and genera and compared relative abundance between controls and severe aGVHD patients (Figure 2C). DESeq2 and LEfSe algorithms were also used on raw data to identify bacterial taxa enriched in each group of patients (Figure 2A-B).

Microbiome signatures of severe aGVHD. To identify potential biomarkers of the microbiota characterizing patients with severe aGVHD (stage 2-3), several approaches were deployed. DESeq2 (A) and LDA effect size (LEfSe) (B) algorithms were used to identify bacterial taxa enriched in each group of patients. (C) In parallel, genera with a cumulative relative abundance in the cohort of at least 5% and present in >10 patients were selected, and relative abundance was compared between controls and severe aGVHD patients. Similarly, families present in at least 15 patients and representing at least 0.5% abundance over the cohort were tested. Of the 22 families and 66 genera tested, 2 families and 10 genera had a significantly different abundance between control and severe GVHD patients. Median of relative abundance and range are indicated, and statistical analyses were performed using nonparametric Wilcoxon-Mann-Whitney test. *P < .05, **P < .01.
Microbiome signatures of severe aGVHD. To identify potential biomarkers of the microbiota characterizing patients with severe aGVHD (stage 2-3), several approaches were deployed. DESeq2 (A) and LDA effect size (LEfSe) (B) algorithms were used to identify bacterial taxa enriched in each group of patients. (C) In parallel, genera with a cumulative relative abundance in the cohort of at least 5% and present in >10 patients were selected, and relative abundance was compared between controls and severe aGVHD patients. Similarly, families present in at least 15 patients and representing at least 0.5% abundance over the cohort were tested. Of the 22 families and 66 genera tested, 2 families and 10 genera had a significantly different abundance between control and severe GVHD patients. Median of relative abundance and range are indicated, and statistical analyses were performed using nonparametric Wilcoxon-Mann-Whitney test. *P < .05, **P < .01.
Two families, belonging to the phylum of Firmicutes, were significantly reduced in severe aGVHD patients compared with controls: Lachnospiraceae (0.14% vs 16.54%; P = .009) and Ruminococcaceae (0.05% vs 2.15%; P = .018). At the genus level, 8 negative markers of severe aGVHD (depletion compared with controls) were identified. Of these, 4 belonged to the Lachnospiraceae family: Lachnoclostridium (P = .019), Blautia (P = .020), Sellimonas (P = .014), and Anaerostipes (P = .015); 2 belonged to the Ruminococcaceae family: Faecalibacterium UBA1819 (P = .011) and Flavonifractor (P = .012); 1 belonged to the Erysipelotrichaceae family: Erysipelatoclostridium (P = .002); and 1 belonged to the family of Streptococaceae: Lactococcus (P = .005). All these taxa were confirmed as markers by the 2 algorithms DESeq2 and LEfSe.
Two genera were detected as positive markers of severe aGVHD (enrichment compared with controls): Prevotella 9 (P = .004) and Stenotrophomonas (P = .009), respectively belonging to the Bacteroidetes and Proteobacteria families. However, the role of these 2 last genera as markers is uncertain, because a great heterogeneity was observed for these genera in severe aGVHD, and their increase may reflect the collapse of other genera.
Metabolic disruption of gut microbiota in aGVHD patients
We then hypothesized that alterations in the composition of the microbiota may result in an altered metabolome, which potentially disrupts functionalities at the onset of aGVHD. To investigate enteric metabolites, we quantified the SCFA content in fecal samples with measurement of total SCFAs and acetate, propionate, and butyrate. We found that the fecal amount of all SCFAs was greatly diminished at aGVHD onset and that variation depended both on disease severity and on molecules (Figure 3A-D). Controls had a median total SCFA level of 12.50 µmol/g of stool and levels of 8.87 µmol/g for acetate, 2.33 µmol/g for propionate, and 1.11 µmol/g for butyrate. Although total SCFAs and acetate gradually decreased in mild aGVHD patients, a high variability made the difference nonsignificant as compared with controls. In contrast, total SCFAs and acetate respectively decreased by 80.6% (2.42 µmol/g) and 75.8% (2.15 µmol/g) in severe aGVHD patients as compared with controls. Regarding butyrate, the decrease was already pronounced in mild aGVHD patients (0.16 µmol/g), with a loss of 86.0%, and was even more pronounced in severe aGVHD patients (0.06 µmol/g), with a 94.6% decrease as compared with controls. Finally, the fecal amount of propionate was similar in controls and mild aGVHD patients, but considerably lower (95.8%) in severe aGVHD patients (0.10 µmol/g) as compared with controls. Moreover, we identified bacteria that correlated positively or negatively with SCFA concentrations. The results are shown in Figure 4A-D.
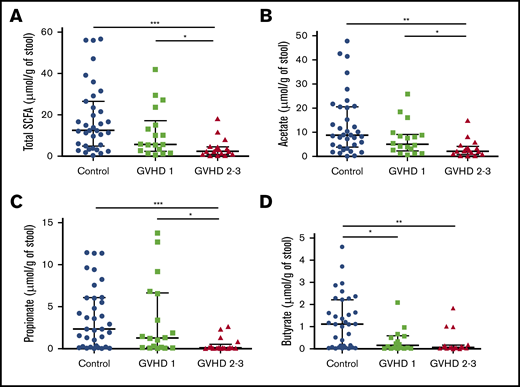
SCFA profile level modifications during aGVHD. Total SCFAs (A) and acetate (B), propionate (C), and butyrate (D) fecal levels were measured and compared between controls and aGVHD patients according to severity of GVHD (SCFAs, control vs stage 2-3, P = .0003; SCFAs, stage 1 vs stage 2-3, P = .03; acetate, control vs stage 2-3, P = .002; acetate, stage 1 vs stage 2-3, P = .036; propionate, control vs stage 2-3, P = .0009; propionate, stage 1 vs stage 2-3, P = .014; butyrate, control vs stage 1, P = .021; butyrate, control vs stage 2-3, P = .001). Statistical analyses were performed using nonparametric Wilcoxon-Mann-Whitney test with false discovery rate (FDR) correction for multiple testing. Undetectable concentrations of SCFAs were observed for 2 samples and concerned only butyrate (patients with stage 2-3 GVHD). FDR *P < .05. **P < .01, ***P < .001.
SCFA profile level modifications during aGVHD. Total SCFAs (A) and acetate (B), propionate (C), and butyrate (D) fecal levels were measured and compared between controls and aGVHD patients according to severity of GVHD (SCFAs, control vs stage 2-3, P = .0003; SCFAs, stage 1 vs stage 2-3, P = .03; acetate, control vs stage 2-3, P = .002; acetate, stage 1 vs stage 2-3, P = .036; propionate, control vs stage 2-3, P = .0009; propionate, stage 1 vs stage 2-3, P = .014; butyrate, control vs stage 1, P = .021; butyrate, control vs stage 2-3, P = .001). Statistical analyses were performed using nonparametric Wilcoxon-Mann-Whitney test with false discovery rate (FDR) correction for multiple testing. Undetectable concentrations of SCFAs were observed for 2 samples and concerned only butyrate (patients with stage 2-3 GVHD). FDR *P < .05. **P < .01, ***P < .001.

Association between fecal SCFA levels and specific gut bacteria. The correlation between the fecal amounts of SCFA and the composition of the microbiota was studied by SPLS regression. The positive (blue) or negative (red) contribution of each bacterial genus is indicated for total SCFAs (A) and acetate (B), propionate (C), and butyrate (D) levels.
Association between fecal SCFA levels and specific gut bacteria. The correlation between the fecal amounts of SCFA and the composition of the microbiota was studied by SPLS regression. The positive (blue) or negative (red) contribution of each bacterial genus is indicated for total SCFAs (A) and acetate (B), propionate (C), and butyrate (D) levels.
Regarding GVHD patients, no correlation was observed, either between SCFA concentrations or between bacterial composition and response to steroid (ie, there was no correlation with steroid resistance or sensitivity).
Discussion
We used 3 complementary approaches to study the gut microbiota and its functional metabolites to gain some insight into the pathophysiology of human aGVHD. We determined the composition of the microbiota in relative abundances and quantitatively by multiple targeted PCRs. Lower bacterial biomass, lower species diversity, and greater phylogenetic distance compared with other patients characterized patients with severe aGVHD. Despite a high variability in posttransplantation profiles, the use of selected statistical algorithms allowed us to directly correlate stool microbiome signatures with severe aGVHD. To further explore the pathophysiology of aGVHD, we analyzed the microbiota derived–metabolites in the stool at aGVHD onset. We showed that the alterations of the microbiota associated with aGVHD had a significant impact on all SCFAs. In particular, our data suggest that butyrate may be a potential marker of aGVHD and that propionate and acetate are associated with disease severity. These analyses are in agreement with previous studies in humans and experimental models.14,17,18,30 They identify new elements in the link between dysbiosis and the pathologic processes involved in human aGVHD by combining the study of intestinal bacteria and their metabolites at aGVHD onset.
Because HSCT and the associated standard procedures have an impact on gut microbiota composition, our study was designed to specifically target changes associated with aGVHD.31,32 Our data suggest that severe aGVHD may be considered differently from mild aGVHD from the microbiome perspective. Indeed, the decrease in species diversity observed at aGVHD onset was only present in severe disease. The redundancy of biochemical pathways between alternative members of the microbiome may not be operative in severe aGVHD to protect the host from a collapse of its functionalities.33 A relationship between microbiota dysbiosis at engraftment, severe aGVHD occurrence, and aGVHD-related mortality was previously reported by others.10,11,13,14
Holler et al34 previously observed that enterococci were more prominent in patients with active gut GVHD. In our study, almost all patients (GVHD, 94%; control, 77%) were colonized with enterococci, but domination of enterococci was seen in only 2 patients. These discrepancies may be due to the number of participants studied or to different antibiotic policies. Indeed, patients in our study all had digestive decontamination and exposure to antibiotics after transplantation.
This study is the first to our knowledge aimed at investigating the functionalities of the intestinal microbiota in humans during aGVHD by quantifying gut microbiome–derived metabolites in conjunction with microbiota analyses. We showed that SCFA production was dramatically decreased during aGVHD. Our results are in agreement with a recent study, which observed lower butyrate and propionate levels after HSCT in children who went on to develop GVHD.30 In experimental models, the major role of butyrate in GI GVHD has already been demonstrated.13 Although a previous study reported that HSCT was associated with a decrease in SCFA levels,35 we report here that aGVHD itself was associated with a specific decrease in SCFA levels. This parallels our recent study on modifications in plasmatic microbiota-derived metabolites at aGVHD onset.15 Interestingly, we showed that the amount of butyrate, a functionally important SCFA in the intestinal tract, was significantly diminished in the early stages of the disease, making this metabolite a potential marker for GVHD diagnosis. In contrast, propionate and acetate, which were decreased only in severe stages of aGVHD, may differentiate mild from severe forms at diagnosis. Interestingly, almost all the markers we identified correspond to well-known SCFA producers. The participation of these bacteria in SCFA production is reinforced, because we observed correlations between these bacterial genera and SCFA levels. Indeed, Lachnospiraceae, Ruminococcaceae, and Erypelotrichaceae families include most of the known butyrate-producing species of the gut.36 The drop in propionate level may be related to the quantitative rarefaction of propionate-producing bacteria such as Blautia that we observed only in severe forms.16 Blautia bacteria are dominant human colonic Lachnospiraceae with the ability to produce propionate. The decrease in abundance of bacteria belonging to the Blautia genus was shown to be associated with an increase in lethal GVHD by Jenq et al.9 Severe aGVHD were also associated with a decrease in butyrate levels that may be in part correlated with the nonsignificant decrease in the Clostridium leptum group of the family Ruminococcaceae. Indeed, a recent study in mice reported that the administration of butyrate or butyrate-producing bacteria such as Clostridia was associated with a decreased severity of aGVHD.18 In addition, recent data have shown that butyrate and propionate exert potentially important anti-inflammatory effects and regulate colonic regulatory T cells, which have a crucial role in controlling intestinal inflammation.17
We must acknowledge the limitation of this study resulting from patient numbers. Analyses of larger numbers of patients are warranted to confirm if SCFAs could be considered as strong and reproducible markers of disease and disease severity at aGVHD onset. Otherwise, prior studies have identified antibiotics as major causes of dysbiosis and alteration in SCFA production in this patient population.30 In our cohort, all patients were on antibiotics before and during follow-up, which does not allow us to isolate their impact on the microbiota or its functions.
In conclusion, severe aGVHD is distinct from mild aGVHD according to their microbiota profiles. We provide additional insights into the role of gut microbiome–derived metabolites in aGVHD.
Raw sequence data are accessible in the National Center for Biotechnology Information Sequence Read Archive (https://www.ncbi.nlm.nih.gov/sra; accession number: PRJNA602484).
Authorship
Contribution: M.P. performed the experiments, collected, analyzed, and interpreted the data, and wrote the manuscript; I.N. performed statistical analysis, designed figures, and wrote the manuscript; M.R. and D.M. coordinated collection of samples and clinical data and participated in manuscript preparation; J.D. performed the experiments; C.M. performed the chromatography analyses; J.L.G. coordinated sample biobanking; N.K. and B.B. contributed to critical revision of the manuscript; M.-J.B. and G.S. supervised the project and wrote the manuscript; and C.R. designed and supervised the project, analyzed and interpreted the data, designed figures, and wrote the manuscript.
Conflict-of-interest disclosure: The authors declare no competing financial interests.
Correspondence: Clotilde Rousseau, Laboratoire de Microbiologie, Hôpital Saint-Louis, 1 Av Claude Vellefaux, 75010 Paris, France; e-mail: clotilde.rousseau@aphp.fr.

