

Key Points
Blood product recalls are highly prevalent in certain geographic regions, and distribution patterns vary between product types.
Inadequate donor screening, compromised sterility, and contamination contribute most to the burden of blood products recalls.

Abstract
Defective blood products that are recalled because of safety or potency deviations can trigger adverse health events and constrict the nation’s blood supply chain. However, the underlying characteristics and impact of blood product recalls are not fully understood. In this study, we identified 4700 recall events, 7 reasons for recall, and 144 346 units affected by recalls. Using geospatial mapping of the newly defined county-level recall event density, we discovered hot spots with high prevalence and likelihood of blood product recall events. Distribution patterns and distribution distances of recalled blood products vary significantly between product types. Blood plasma is the most recalled product (87 980 units), and leukocyte-reduced products (34 230 units) are recalled in larger numbers than non-leukocyte-reduced products (8076 units). Donor-related reasons (92 382 units) and sterility deviations (22 408 units) are the major cause of blood product recalls. Monetary loss resulting from blood product recalls is estimated to be $17.9 million, and economic sensitivity tests show that donor-related reasons and sterility deviations contribute most to the overall monetary burden. A total of 2.8 million days was required to resolve recall events, and probabilistic survival time analysis shows that sterility deviations and contamination took longer to resolve because of their systemic effect on blood collection and processing. Our studies demonstrate that better donor screening procedures, rigorous sterility requirements, improved containment methods, and mitigation of recall events in high-prevalence regions will enable a more robust blood supply chain.
Introduction
Blood is a limited resource with broad utilization in trauma, surgery, rehabilitation, and preventive care clinical settings.1,2 The blood supply chain comprising voluntary donations, processing, storage, and distribution operates through a network of decentralized, independent establishments that provide blood products to patients nationwide.3,4 About 2.3 million hospital discharges involve blood transfusions,5 and many trauma patients receive massive transfusions within 24 hours of treatment initiation.6 Although blood transfusion is a frequently used clinical procedure,7 transfusions carry inherent risk for adverse events resulting from defective blood products that can cause infections, spread transmissible diseases, elicit undesirable immune reactions, and lower clinical efficacy.8,9 Furthermore, blood supply is affected by acquisition costs and inventory limitations.10,11 For example, the short shelf life of platelets (∼5 days) makes it a challenge to manage their supply and demand.12 Several blood product management initiatives by medical societies, user groups, and suppliers have resulted in a short-term decrease in blood product demand.13,14 But providing adequate medical care for aging populations in developed countries will increase the future demand for blood products,15 whereas the future supply of these products will be limited because of declining blood donation rates.16,17 Therefore, prevention of blood product loss resulting from deficiencies in collection, processing, or distribution will have a positive effect on public health.
Blood products in the United States are regulated by the US Food and Drug Administration (FDA). If the FDA determines that a defective blood product could lead to adverse events or if an adverse event has already happened, these products are removed from the market though a formal recall.18,19 Temporal trends between 2007 and 2011 have shown a decrease in blood product recall events. Unfortunately, most recalled units were already transfused before they could be removed from the market.20 McCullough et al noted the absence of the most severe class I recalls and determined that larger blood collection organizations had a relatively lesser number of recalls, and that the recall event characteristics varied with FDA districts.21 Donor-related issues were reported as the major reason for blood product deviations, many of which were discovered through postdonation information reported after blood collection, and possibly after distribution or transfusion.20,22 Although prior studies have cataloged blood product recalls, a thorough cross-sectional analysis of their prevalence, cause, and implications is currently unavailable.
In this study, we develop a comprehensive landscape of blood product recall events and quantitatively assess their impact, using data extracted from the FDA’s weekly enforcement reports (ERs), the blood product establishments database, and AABB’s (formerly known as the American Association of Blood Banks) blood use survey data. Using quantitative geospatial mapping, we show that blood product recall prevalence is disproportionately high in some geographic regions, and distribution patterns of recalled units vary significantly between blood product types. Through economic sensitivity tests and Kaplan-Meier survival analysis, we show that recall events attributed to donor-related deviations have the maximum negative effect on the blood supply chain, contributing to the highest numbers of recall events, numbers of affected units, and monetary loss. In addition, sterility deviations and contamination, although attributed only to a small proportion of recall events, affected a large number of products, took the longest time to resolve, and contributed to relatively large monetary losses. Time for resolution of recall events showed a trimodal distribution across all product types.
Methods
Data collection
Data collection, screening, and stratification was performed independently by I.A. and S.S. or by I.A. and W.H. The aggregate data file was constructed by compiling all weekly ERs published between January 2013 and December 2017 for biologic products23 and combining them into a single data set using a R script (n = 5833 events). Recall events that were not yet terminated (n = 7 events) or that did not involve a blood product (n = 1126 events) were excluded. Data sets created by each analyst were compared and discrepancies were resolved through arbitration or by reworking the disputed data points from original ERs. The qualified data set (n = 4700 events) was used for further analysis. Workflow for data collection, screening, and qualification is shown in supplemental Figure 1.
Geospatial mapping
Numbers of blood product establishments and recall origin locations within a county were estimated using the Join_Count function in ArcGIS by overlaying the built-in county map with the street addresses of blood product establishments or recall origin locations. The county-level numbers were used in Equation 1 to estimate RED. Geospatial similarity was estimated using the spatial autocorrelation function in ArcGIS, which computes the Global Moran's I statistic based on county-level RED values to determine whether the patterns expressed are clustered, dispersed, or random. The likelihood maps were then constructed by computing the Getis-Ord Gi statistic for RED values and visualizing the geographic clusters with high (hot spot) and low (cold spot) likelihood of recall events. Likelihood analysis was performed at 99% and 95% confidence levels.
Distribution network maps were constructed using the XY to line function in ArcGIS, in which the origin coordinates are Zip code locations of blood product establishments from which recalled products originate and the destination coordinates are the geographic centers of states that received the recalled products. Destinations are the locations to which the recalled blood products were sent for use. Lines represent the connections between origin and destination points. The distribution network map was then used to construct the line density map through the Line Density function. The XY to line function was also used to estimate the distance traveled by recalled products for all origin-destination combinations.
Monetary loss estimates and economic sensitivity analysis
where cj is the unit cost of jth product type, US dollars (USD); Mi is the total monetary loss resulting from all recall events, USD; Mi,j is the total monetary loss attributed to the jth product type, USD; Mi,k is the total monetary loss attributed to the kth reason for recall, USD; mi is the monetary loss resulting from ith recall event, USD; mi,j is the monetary loss resulting from ith recall event attributed to jth product type, USD; mi,k is the monetary loss resulting from ith recall event attributed to kth reason for recall, USD; ni is the number of affected units in the ith recall event; ni,j is the number of affected units in the ith recall event attributed to jth product type; and ni,k is the number of affected units in the ith recall event attributed to kth reason for recall.
Values for ni, ni,j, and ni,k were extracted from ERs,23 and values for cj were obtained from AABB’s National Blood Collection and Utilization surveys.16 A univariate economic sensitivity analysis was performed using an R script by estimating the monetary loss when the number of recall events for each recall reason was varied by ±20% while keeping the number recall events for other reasons constant. The predicted changes in total monetary loss were plotted as a tornado diagram.
Time for resolution analysis
Time for resolution is the number of days lapsed between recall initiation and recall termination dates. Recall initiation and termination dates extracted from ERs were used to calculate resolution time through the DATEDIF function in Excel. Kaplan-Meier survival probability estimates were computed from resolution time data for each reason for recall, using the survival package in R. The estimated probabilities are for a recall event surviving (ie, no resolution) at any given time point. The ggsurvplot() function was used to generate a temporal plot of the calculated probability of no resolution. Significance was estimated using the log-rank test.
Statistical analysis and heat maps
Shapiro-Wilk tests for normality of data were performed using the shapiro.test() function in R. Significance was estimated using the Kruskal-Wallis test in JMP 14.0. The heatmap.2() function from the gplots package and the viridis color palette from R package were used to construct all heat maps.
Results
Recalls are actions taken to remove or correct marketed products that are in violation of laws administered by the FDA. Recalls are categorized as class I (most severe including death), class II (moderately severe), or class III (least severe), based on actual or potential for patient injury.24 Definitions of recall classes are given in Table 1.
Description of recall classes
| Class I | Defective products have a reasonable probability of causing serious adverse health consequences or death. |
| Class II | Defective products may cause temporary adverse health consequences, or the probability of serious adverse health consequences is low. |
| Class III | Defective products not likely to cause adverse health consequences, but violate FDA labeling or manufacturing laws. |
Recall class definitions obtained from the FDA.24
Occurrence and geographic prevalence of blood product recall events
A total of 4700 blood product recall events, 7 reasons for recall, and 144 346 affected units were identified from ERs. We performed the Shapiro-Wilk test and determined that all data sets have nonnormal distribution (supplemental Table 1). Hence, median and interquartile range (IQR) are reported as measures of centrality and dispersion of data. Leukocyte-reduced red blood cells (RBC LR) contributed to the highest proportion of recall events, at 41%, followed by leukocyte reduced (LR) platelets (PLR), at 21%, whereas non-LR red blood cells (RBC NLR) and platelets (PNLR) had a lesser proportion of recall events, at 8% and 2%, respectively (Figure 1A). LR products are used more than NLR products in the United States, and hence the number of LR product recalls is higher than the number of NLR product recalls. Although the median number of affected units per recall event is low, some recall events had thousands of affected units. Plasma frozen within 24 hours of collection (PF24) had the highest cumulative number of affected units (83 959 units, 58%), but it constituted only 16% of recall events (Figure 1A-B).
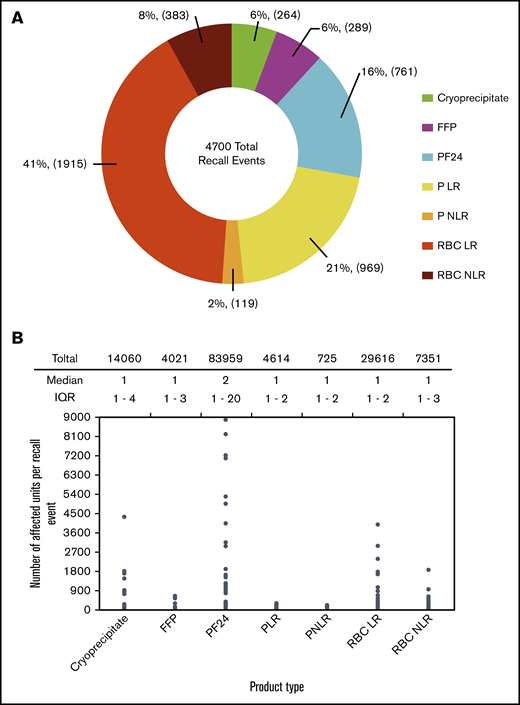
Occurrence of blood product recall events. (A) Proportion of recall events for different blood product types. (B) Number of affected units per recall event for different blood product types. Significance was estimated using Kruskal-Wallis test, P < 2.2 × 10⁻¹⁶.
Occurrence of blood product recall events. (A) Proportion of recall events for different blood product types. (B) Number of affected units per recall event for different blood product types. Significance was estimated using Kruskal-Wallis test, P < 2.2 × 10⁻¹⁶.
Geographic prevalence of recall events was quantified using a new parameter, the recall event density (RED), defined as the number of recalls originating from a particular county divided by the number of blood product establishments in that county (Equation 1). Regions with high population density (such as the New York and San Francisco metro areas) have a larger number of blood product establishments, and hence will likely have a higher number of recall events, but our definition of RED normalizes the number of recall events with the number of blood product establishments within a county, thus eliminating geospatial bias resulting from clustering of blood product establishments around population centers. Blood product establishments in several counties had no recall events (blue regions, RED = 0), whereas establishments in some counties had low to moderate RED of 1 to 15 recall events per establishment. However, establishments in parts of California, Arizona, and Florida had a high RED of 36 to 65 recall events per establishment (Figure 2A). Overall, the median RED was 2 (IQR, 1-4), but in some cases, it can be as high as 65 recall events per establishment (Figure 2B). Next, we performed spatial autocorrelation analysis of recall event origin location data to predict the likelihood of recall occurrence in specific geographic regions (Figure 2C). Spatial autocorrelation is an interpolation technique that measures the similarity in RED between 2 points, which is then used to determine hot spots (high chance) or cold spots (low chance) for recall occurrence. Dots on the map represent blood product establishments, which are often clustered around high population centers such as the New York, San Francisco, and Chicago metro areas. The colored regions represent the likelihood of future recall event occurrence at a 99% confidence level. Recall event likelihood hot spots can be found in Southern California, parts of Arizona, and coastal and Northern Florida. At a 95% confidence level, an additional region in Northern Florida showed a likelihood of recall event occurrence. (supplemental Figure 2).

Geographic prevalence of blood product recall events. (A) County-level RED heat map for blood product recall event prevalence in the United States. RED was estimated by dividing the number of recall events originating from a county with the number of blood product establishments within that county. (B) County-level RED for blood product recall events. (C) County-level hot spot analysis for likelihood of blood product recall events. Colored regions represent the likelihood of recall event occurrence at 99% confidence level, and dots represent the locations of blood product establishments in the United States.
Geographic prevalence of blood product recall events. (A) County-level RED heat map for blood product recall event prevalence in the United States. RED was estimated by dividing the number of recall events originating from a county with the number of blood product establishments within that county. (B) County-level RED for blood product recall events. (C) County-level hot spot analysis for likelihood of blood product recall events. Colored regions represent the likelihood of recall event occurrence at 99% confidence level, and dots represent the locations of blood product establishments in the United States.
Distribution patterns of recalled blood products
Distribution patterns were analyzed using the destination locations of defective units in blood product recalls. Destination locations are the states to which the recalled blood product units were sent for use. Defective products that were identified before market release are not included in this study. Geospatial distribution density maps and network line maps were constructed in ArcGIS. The highest density of recalled blood product distribution (5.001-7 km/km2) occurs within New York State, the North Central United States, and the previously mentioned hot spot areas in California and Florida (Figure 3A, distribution density map). Populous states such as New York, California, Pennsylvania, Florida, and Illinois use more blood products, and hence have a higher distribution of recalled products. A moderate distribution density (2.001-4 km/km2) was observed in parts of upper Midwest, Texas, and Mid-Atlantic states. New York, Michigan, and North Carolina were the top 3 states to receive recalled blood products based on population-adjusted distribution (supplemental Figure 3).

Distribution patterns of recalled blood products. (A) Overall distribution density map of recalled blood products. Distribution density, defined as kilometers traveled by recalled products per square kilometer of geographic area, was constructed using the spatial density of lines connecting the origin and destination locations for all recalled blood products. Distribution network maps for various blood products were constructed using the XY to line function in ArcGIS. Each line on the map represents the linear connection between the origin (Zip codes) and destination (geographic center of the state) locations of recalled blood products. A recall event originating at a single location can have multiple destinations, and consequently there will be multiple lines originating from that location. (B) Number of destinations for affected units in a recall event for different blood products. Significance was estimated using the Kruskal-Wallis test, P < 2.2 × 10⁻¹⁶. (C) Distance traveled by affected units in a recall event for different blood products. Distances between recall origin (Zip codes) and destination (geographic center of destination states) locations were calculated using XY-to-line function in ArcGis. Significance was estimated using Kruskal-Wallis test, P < 2.2 × 10⁻¹⁶.
Distribution patterns of recalled blood products. (A) Overall distribution density map of recalled blood products. Distribution density, defined as kilometers traveled by recalled products per square kilometer of geographic area, was constructed using the spatial density of lines connecting the origin and destination locations for all recalled blood products. Distribution network maps for various blood products were constructed using the XY to line function in ArcGIS. Each line on the map represents the linear connection between the origin (Zip codes) and destination (geographic center of the state) locations of recalled blood products. A recall event originating at a single location can have multiple destinations, and consequently there will be multiple lines originating from that location. (B) Number of destinations for affected units in a recall event for different blood products. Significance was estimated using the Kruskal-Wallis test, P < 2.2 × 10⁻¹⁶. (C) Distance traveled by affected units in a recall event for different blood products. Distances between recall origin (Zip codes) and destination (geographic center of destination states) locations were calculated using XY-to-line function in ArcGis. Significance was estimated using Kruskal-Wallis test, P < 2.2 × 10⁻¹⁶.
Numerous defective cryoprecipitate units originated from facilities in Wisconsin and Illinois and were distributed to destinations across the country (Figure 3A for cryoprecipitate). As shown in Figure 3B, cryoprecipitate had a relatively lesser number of nonnationwide distributions (233 destinations), but had the second largest nationwide distribution (32 destinations) compared to other recalled blood products. Recalled RBC LR had a larger distribution than other products, with several cross-continental destinations (Figure 3A for RBC LR). It had 1876 nonnationwide and 40 nationwide destinations (Figure 3B). In contrast, recalled RBC NLR had only 365 nonnationwide and 20 nationwide destinations (Figure 3A for RBC NLR; Figure 3B). Recalled PLR had the second largest nonnationwide distribution (962 destinations), but only 8 nationwide distributions (Figure 3A for PLR; Figure 3B). However, recalled PNLR was distributed over shorter distances, usually within states or to neighboring states (Figure 3A for PNLR; Figure 3B). It had 114 nonnationwide and 6 nationwide destinations, which was the lowest of all product types. Recalled PF24 had several cross-continental destinations, whereas recalled fresh frozen plasma (FFP) had a limited number of cross-continental destinations and was distributed to a lesser extent than PF24 (Figures 3A for PF24 and FFP; and Figure 3B). The observations from distribution network maps are further supported by geospatial line density maps for individual products that show that recalled cryoprecipitate, RBC LR, PLR, and PF24 are distributed to a greater extent than other products (supplemental Figure 4).
Recalled cryoprecipitate and PF24 were distributed over longer median distances than other product types (Figure 3C). Although RBC LR had the highest nationwide and nonnationwide distribution, it traveled a relatively shorter median distance of 314 km (IQR, 168-1325 km), indicating that a large proportion of recalled RBC LR was distributed regionally vs across the country. In contrast, recalled cryoprecipitate had a lesser number of destinations, but it traveled the farthest median distance, 907 km (IQR, 324-1360 km), indicating a larger distribution across the country.
Reasons for blood product recalls
ERs provide a short description of the noncompliance or deviation that led to a recall. This is the reason or cause for recall. Using manual text analysis, we classified reasons for recalls into 7 different categories. Definitions of different reasons for recall, along with representative examples of actual violations cited in ERs, are provided in Table 2. Donor-related deviations contributed to a majority of recall events (60%, 2819/4700) and the largest cumulative number of affected units (64%, 92 382/144 346; Table 2; Figure 4A). Deviations in sterility are attributed only to a small fraction of recall events (4%, 188/4700), but they accrued the second largest number of affected units (15.5%, 22 408/144 346). Deviations in sterility also had the highest number of units affected per recall event (median = 13; IQR, 1-61), indicating that this reason had a stronger effect on recall events (Figure 4A). Sterility deviations, often in the blood collection system or in the blood collection procedure, are deviations in which no specific contaminant is identified, but a noncompliance in the procedure or process or equipment increased the risk for sterility breach to an unacceptable level.
Descriptions of reasons or recalls
| Recall reason | Definition | Example citation in enforcement reports | Proportion of recall events, % (n/N) |
|---|---|---|---|
| Contamination | Contamination of the blood product during manufacturing and distribution; a contaminant is identified | Blood product possibly contaminated with bacteria | 2 (93/4700) |
| Donor related | Issues relating to the quality of donated blood | Donor suitability was not adequately determined | 60 (2819/4700) |
| Manufacturing defect | Defect directly attributed to blood manufacturing | Blood product manufactured without additive solution | 2 (91/4700) |
| Misbranding | Blood products are labeled incorrectly | Blood product incorrectly labeled as negative for the JKA red cell antigen | 7 (307/4700) |
| Product specs not met | Blood products did not meet acceptable product specifications | Blood product had low platelet count | 12 (586/4700) |
| QC unacceptable | Quality checks for testing and processing were not conducted | Required HIV/HCV nucleic acid test not performed | 13 (616/4700) |
| Sterility of facility | Equipment, procedures, or facilities were ineffective in maintaining sterility of blood products; no specific contaminant was identified. | Blood products were collected in a manner that may have compromised the sterility of the collection system | 4 (188/4700) |
QC, quality control.

Reason for blood product recalls. (A) Number of affected units per recall event attributed to different reasons for recall. Significance was estimated using Kruskal-Wallis test, P < 2.2 × 10⁻¹⁶. (B) Proportion of recall events attributed to different reasons for recall for class II and class III recall events. (C) Heat map of number of affected units for all reason for recall-product type combinations. Heat maps were constructed in R, using the heatmap.2() function in the gplots package.
Reason for blood product recalls. (A) Number of affected units per recall event attributed to different reasons for recall. Significance was estimated using Kruskal-Wallis test, P < 2.2 × 10⁻¹⁶. (B) Proportion of recall events attributed to different reasons for recall for class II and class III recall events. (C) Heat map of number of affected units for all reason for recall-product type combinations. Heat maps were constructed in R, using the heatmap.2() function in the gplots package.
The numbers of class II and class III recall events were 3644 and 1056, respectively. The most severe class I recall events were not observed (Figure 4B). Definitions of various recall classes are provided in Table 1. A majority of class II recalls (>75%) for all product types were attributed to donor-related deviations, except for PLR, which was primarily recalled because of unmet product specifications. The reasons for class III recalls were more diversified than the reasons for class II recalls (Figure 4B). PF24 is acutely affected by donor-related deviations, and reasons for recall of LR products were more diversified than their NLR counterparts (Figure 4C).
Economic effect of blood product recalls
Economic impact analysis was performed to estimate the monetary losses resulting from recalls and to determine the economic benefits of reducing recalls attributed to certain reasons. Monetary loss is the revenue lost because of recalled blood product units that would have otherwise been sold in the market at the prevailing price. Monetary loss depends on the number of affected units and the unit price of products and was estimated using Equations 2-4. Platelet products have a higher unit cost followed by RBC products, cryoprceipiate, and plasma products (supplemental Table 2). Although median monetary losses were relatively lower, several recall events incurred monetary losses of hundreds of thousands of dollars per event. Recalled RBC LR had the highest cumulative monetary loss, of $6.42 million, followed by PF24 ($5.29 million), whereas recalled FFP had the lowest cumulative monetary loss, of $0.24 million (Figure 5A). Recall events attributed to sterility of facility and donor-related reasons had the highest ($1512; IQR, $434-$9086) and the lowest ($217; IQR, $207-$1611) median monetary loss per recall event, respectively (Figure 5B). Donor-related deviations resulted in the highest cumulative monetary loss, of $7.61 million, followed by sterility deviations, contributing to a monetary loss of $3.97 million. PF24 recalls attributed to donor-related deviations incurred the highest monetary loss of all reasons for recall-product type combinations (Figure 5C). Monetary loss resulting from recalled RBC products can be attributed to donor-related, misbranding, unacceptable QC, and sterility deviations, whereas the monetary loss resulting from recalled plasma is mainly attributed to donor-related deviations. Monetary loss resulting from recalled cryoprecipitate can be attributed mostly to unmet product specifications and sterility deviations.
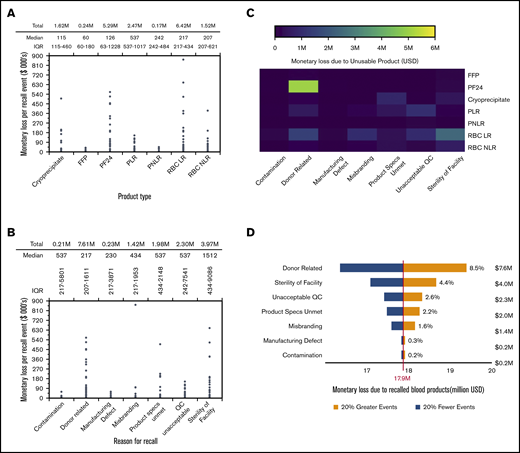
Economic impact of blood product recall events. (A) Estimated monetary loss resulting from defective blood products in each recall event for different blood product types. Significance was estimated using the Kruskal-Wallis test, P < 2.2 × 10⁻¹⁶. (B) Estimated monetary loss resulting from defective blood products in recall events attributed to various reasons for recall. Significance was estimated using the Kruskal-Wallis test, P < 2.2 × 10⁻¹⁶. (C) Heat map of monetary loss for all reason for recall-product type combinations. Heat map was constructed in R, using the heatmap.2() function in gplots package. (D) Overall economic sensitivity of monetary loss attributed to different reasons for recall. Sensitivity tests were performed using a univariate analysis in which the number of recall events for each recall reason was varied by ±20% while keeping the number events for other reasons constant. The percentage predicted change in total monetary loss resulting from a ±20% change in number of recall events was plotted as a tornado diagram. The base value for monetary loss was set at $17.9 million, which is the total estimated monetary loss resulting from all eligible recall events reported in enforcement reports between 2013 and 2017.
Economic impact of blood product recall events. (A) Estimated monetary loss resulting from defective blood products in each recall event for different blood product types. Significance was estimated using the Kruskal-Wallis test, P < 2.2 × 10⁻¹⁶. (B) Estimated monetary loss resulting from defective blood products in recall events attributed to various reasons for recall. Significance was estimated using the Kruskal-Wallis test, P < 2.2 × 10⁻¹⁶. (C) Heat map of monetary loss for all reason for recall-product type combinations. Heat map was constructed in R, using the heatmap.2() function in gplots package. (D) Overall economic sensitivity of monetary loss attributed to different reasons for recall. Sensitivity tests were performed using a univariate analysis in which the number of recall events for each recall reason was varied by ±20% while keeping the number events for other reasons constant. The percentage predicted change in total monetary loss resulting from a ±20% change in number of recall events was plotted as a tornado diagram. The base value for monetary loss was set at $17.9 million, which is the total estimated monetary loss resulting from all eligible recall events reported in enforcement reports between 2013 and 2017.
A univariate economic sensitivity analysis was performed to forecast the percentage change in overall monetary loss when the number of recall events attributed to a particular reason for recall is varied by ±20% (Figure 5D). Sensitivity analysis quantifies the economic benefit that could be achieved by reducing certain reasons for recalls. Donor-related recall events had the highest economic sensitivity, with a projected change of ±8.5% in overall monetary loss from the base value of $17.9 million, followed by sterility of facility, with a projected change of ±4.4% in overall monetary loss. Thus, donor-related reasons and sterility deviations have higher economic sensitivity compared with other reasons for recall. However, the following patterns emerge from the economic sensitivity analyses for individual product types (supplemental Figure 5): sterility deviations had the highest economic sensitivity for recalled RBC LR and RBC NLR, donor-related deviations had the highest economic sensitivity for recalled PF24 and FFP, unacceptable QC had the highest economic sensitivity for recalled PLR and PNLR, and unmet product specifications had the highest economic sensitivity for recalled cryoprecipitate.
Time for resolution of blood product recall events
While a recall is being resolved, affected products are removed from the market and corrections are made to bring the equipment, process, or facility into compliance. Thus, the time lost during resolution of a recall event is a hidden burden on the blood supply chain. The cumulative time spent in resolving blood product recalls events is estimated to be 2.8 million days. Median time for resolution of recall events varied between 77 and 98 days, but the individual time for resolution had a wide range within product types (Figure 6A). For example, 2 PLR recall events took more than 4000 days for resolution, although the median time to resolve PLR recalls is only 77 days (IQR, 57-114 days). The longest resolution time, 4262 days, was for a PLR recall event attributed to donor-related deviations (blood collected from a donor who had taken aspirin before the donation). Donors are required to wait for 2 full days before they can donate platelets by apheresis. The long resolution time is likely a result of the vigilance needed to determine the type or risk for adverse events before the recall can be terminated. Time for resolution of recall events attributed to sterility deviations was the highest (median = 1526 days; IQR, 113-2574 days), followed by contamination (median = 191 days; IQR, 84-1957 days). About a third of sterility recall events (31.4%, 59/188) took more than 2000 days for resolution (Figure 6B), and these are mostly attributed to compromised blood collection systems or deviations in blood collection procedure.

Time for resolution of blood product recall events. (A) Time to resolve recall events for different blood product types. Significance was estimated using the Kruskal-Wallis test, P = 3.82 × 10⁻¹⁶. (B) Time to resolve recall events attributed to different reasons for recall. Significance was estimated using the Kruskal-Wallis test, P < 2.2 × 10⁻¹⁶. (C) Time-to-event survival curves for resolution of recall events attributed to different reasons for recall. Event here is defined as the resolution of a recall. Probability of survival of a recall event (ie, no resolution) is estimated and plotted as a function of time. Survival curves were constructed in R, using the survival package. Significance was estimated using the log-rank test in the ggsurvplot() function in the survival package, P < .001.
Time for resolution of blood product recall events. (A) Time to resolve recall events for different blood product types. Significance was estimated using the Kruskal-Wallis test, P = 3.82 × 10⁻¹⁶. (B) Time to resolve recall events attributed to different reasons for recall. Significance was estimated using the Kruskal-Wallis test, P < 2.2 × 10⁻¹⁶. (C) Time-to-event survival curves for resolution of recall events attributed to different reasons for recall. Event here is defined as the resolution of a recall. Probability of survival of a recall event (ie, no resolution) is estimated and plotted as a function of time. Survival curves were constructed in R, using the survival package. Significance was estimated using the log-rank test in the ggsurvplot() function in the survival package, P < .001.
Temporal progression of recall event resolution was examined using Kaplan-Meier estimates of recall events “surviving” (ie, probability of no resolution) until a certain period of time. Time for resolution showed the following trimodal pattern across all reasons for recall (Figure 6C): A majority of recalls were resolved during the initial period (<1 year), followed by an intermediate period (1-5 years) in which the probability of no resolution showed only a small decrease, and a final, extended period (>5 years) during which the remaining recalls were resolved. Recalls attributed to sterility deviations and contamination are the most difficult to resolve. For example, about 65% of recall events attributed to sterility deviations and 50% of recalls attributed to contamination remained unresolved at the end of 1-year period compared with other reasons that had less than 38% of recall events unresolved at the end of same period.
Discussion
We used geospatial mapping, economic sensitivity tests, and survival time analysis to determine the prevalence, cause, and effect of blood product recalls in the United States. The absence of class I recalls shows the impressive quality and strength of the US blood supply network. Although many blood product establishments are able to supply safe and compliant blood products, the high prevalence of recall events originating from establishments in a few geographic regions negatively affects the blood supply chain. LR blood products are preferred in clinical use over NLR products because of the lesser likelihood of posttransfusion infections and transmission of diseases.25,26 Roughly 70% of RBC units and 95% of platelet units used in the United States are LR.27 Therefore, the higher numbers of recalled LR blood products could be attributed to the greater use of these products compared with NLR products. Also, the additional processing steps necessary for leukocyte reduction28,29 can lead to a higher chance of deviations, and subsequently increase the number of recalled LR products.
The higher preference for RBC LR results in its localized demand and distribution. Thus, recalled RBC LR had a higher number of nonnationwide destinations and were distributed over shorter distances despite having a frozen shelf life of 42 days.30 Recalled PLR and PNLR products are distributed over shorter distances because of their short shelf life of 5 to 7 days.31 It is also possible that some blood organizations would market RBC and platelet products only locally, and hence recalled products would travel shorter distances. Cryoprecipitate is used as a therapeutic source of fibrinogen to treat hypofibrinogenemia.32,33 Recalled cryoprecipitate traveled the longest median distance because of its longer shelf life of up to 1 year at –18°C, and because of the limited number of blood product establishments that make this product. Some blood collection organizations do not produce cryoprecipitate, and others may elect to produce a larger amount to supply both local and national markets. Plasma units are derived primarily from whole blood,34 and the majority of whole blood is collected at remote locations and offsite blood donation campaigns.35 Plasma products derived from blood collected at offsite locations are frozen in the 8- to 24-hour period to produce PF24, whereas FFP is produced by freezing plasma within 8 hours of phlebotomy. PF24 can be stored at –18°C, whereas FFP must be stored at −30°C. Because of its better availability and ease of storage, PF24 is used more than FFP.16 As a consequence, PF24 has a larger number of recalls and wider distribution than FFP.
The predominant violation cited in ERs for donor-related recalls is inadequate health history screening of donors. Inadequate donor screening frequently results in postdonation information that would have prohibited blood collection from the donor if this information were available at the time of donation.22 Factors such as donors providing inaccurate information or becoming ill after blood donation will be hard to mitigate. Plasma is mostly produced from whole-blood donations, whereas RBCs and platelets are produced by apheresis, as well as from whole blood. RBC donations (2× RBCs) and platelet donations (5× platelets) produce more product than is possible to obtain through whole-blood donations. Hence, PF24 production will require more donors compared with RBC and platelet production. A higher number of donors might lead to a higher number of donor-related deviations, which would explain the acute effect of these deviations on PF24 compared with other products. There could be other reasons for the greater influence of donor-related deviations on PF24, which should be investigated in future research. Our observations agree with an earlier study that reported 73% of class II recall events were attributed to donor-related deviations.21
The predominant violation cited for sterility deviations is the compromised sterility of collection systems. The FDA has recalled blood collection sets for safety violations such as needle separation (https://www.accessdata.fda.gov/scripts/cdrh/cfdocs/cfres/res.cfm?id=26414) and barrel separation (https://www.accessdata.fda.gov/scripts/cdrh/cfdocs/cfRes/res.cfm?ID=175516). Use of defective blood collection sets would increase the risk for sterility deviations. Also, entrance of skin contaminants during venipuncture would affect the sterility of products. A previous study found that blood drawn for culture in a hospital emergency room by nonphlebotomists was twice as likely to be contaminated compared with blood collected by phlebotomists.36 Such noncompliant blood collection procedures would lead to sterility issues as well. When donations are obtained using compromised collection systems or noncompliant procedures, all blood products derived from such donations would be affected. In addition, the number of affected units would expand rapidly if the compromised collection system was used to acquire multiple donations. Therefore, a smaller number of recall events attributed to sterility deviations systemically affected a large number of units across a wide range of product types.
Recall events attributed to donor-related reasons had the highest cumulative monetary loss because of the larger number of affected units attributed to this reason. Sterility deviation is attributed to only 4% of all recall events, but it resulted in substantial monetary losses because of the large number of affected units. In contrast, the number of affected units and monetary losses attributed to manufacturing defects and contamination are much lower. This may be a result of stringent and less subjective industry-wide good manufacturing practice guidelines that regulate the manufacturing facilities and containment systems for blood processing.37 FDA and blood organizations are likely to take deliberate and comprehensive efforts to resolve sterility and contamination recalls, which would explain the long resolution times associated with these reasons. In contrast, the root cause for recalls attributed to unmet product specifications (mostly incorrect concentrations), misbranding (mostly incorrect labeling), and donor-related reasons (mostly donor screening) can be identified and resolved in a relatively shorter time period.
Evidence presented in this study reaffirms previous work on the persistent challenges in donor screening that need to be addressed. Stringent oversight on sterility by FDA and blood organization quality systems is evident in the low proportion of recall events attributed to this reason. However, a small number of sterility-related recall events affects a large number of units. Hence, sterility issues associated with compromised collection systems and noncompliant blood collection procedures need further consideration. Intervention strategies that mitigate recall events in the high-prevalence geographic regions will strengthen the blood supply chain. Factors associated with geospatial disparities in recall event prevalence will be studied in the future.
This study has limitations. The geospatial network maps and estimates of distances traveled are restricted to the continental United States because of visualization limits. ERs classify recall events that have greater than 21 destinations as nationwide without specifying the actual number or the identity of destination locations. Thus, the geospatial network connections are restricted to recall events with nonnationwide destinations. But the numbers of nationwide destinations provide broad insights on the extent of nationwide distribution. Destination locations of recalled products are specified as states, so distances traveled by recalled products are estimated between Zip code of origin locations and the geographic center of destination states. Cost estimates for blood products were sourced from the 2015 AABB National Collection and Utilization surveys and applied to estimate the economic effect of all recall events contained in ERs in the 2013 to 2017 period.
All data needed to evaluate the conclusions in the paper are present in the paper and/or supplemental Information. Additional data related to this paper may be requested from the authors.
Acknowledgment
The authors acknowledge Kelsey Rydland for help with geospatial mapping.
Authorship
Contribution: I.A. and S.S. performed data collection and analysis; I.A. and W.H. performed a quality check on the data; I.A. performed geospatial analysis and data visualization; W.H. performed all analysis done with R; I.A. and P.A.F. wrote the manuscript; and P.A.F. conceived the project and provided overall supervision.
Conflict-of-interest disclosure: The authors declare no competing financial interests.
Correspondence: P. Arthur Felse, Department of Chemical and Biological Engineering, Northwestern University, 2145 Sheridan Rd, TECH E136, Evanston, IL 60208; e-mail: afelse@northwestern.edu.

