

Key Points
In spite of treatment advances, mortality associated with transfusion-dependent thalassemia continues to be very high.
Ineffective transfusion, TTIs, and chelation continue to be the most significant risk factors.

Abstract
In spite of advances in chelation therapy and screening of blood, mortality associated with the most common life-threatening noncommunicable disease of children in India, transfusion-dependent thalassemia (TDT), remains poorly defined. This study aims at estimating death rates and mortality risk factors associated with TDT. The clinical records of 1087 patients from 5 thalassemia centers in India were retrospectively analyzed from 2011 to 2018. Median patient age was 8.5 years, with 107 patients older than 18 years; 656 patients were male and 431 were female. Demographic details and clinical parameters were analyzed at presentation and at last visit. With 41 recorded deaths, actuarial survival at 26.9 years was 50%, and under-5 mortality was 7 times higher than in the general population. Patients with transfusion-transmitted infections (TTIs) had 3.4 times higher risk for death (P = .031). Serum ferritin higher than 4000 ng/dL had 4.6 times higher risk for mortality compared with ferritin lower than 1000 ng/dL (P = .00063). A hemoglobin drop lower than 2 g/dL per week had 7.7 times higher mortality risk compared with a drop of less than 1 g/dL per week (P < .0001). Social determinants (sex, economic status, and distance from center), splenectomy, and even cardiac complications were not associated with higher mortality risk. Main causes of death were infection, iron overload, TTIs, and allo-immunization. Patients who received more than 4 years of adequate care had more than 66% mortality risk reduction (P < .0001). TDT in India continues to result in high mortality. Ineffective transfusion, TTIs, and chelation continue to be the most significant risk factors. Comprehensive care in dedicated day care centers from early age is likely to improve outcomes.
Introduction
Thorough understanding of mortality associated with thalassemia is essential to provide informed counseling to patients/caretakers and enable fair comparison between various treatment options. This understanding also helps identify key risk factors contributing to mortality to provide a baseline for further research in the field and a risk-adjusted benchmark for thalassemia care services. This knowledge is also essential for policymaking.
Although transfusion-dependent thalassemia (TDT), defined as a thalassemia syndrome with the inability to keep spontaneous hemoglobin (Hb) above 7 g/dL, is the most common noncommunicable life-threatening disease of children in Southeast Asia,1,2 to our knowledge, there is no large-scale study estimating mortality associated with thalassemia care in lower-middle-income countries; that is, where thalassemia is most prevalent.1 The data analyzed is exclusively obtained in the oral chelation era, which actually started in India with the approval for clinical use of deferiprone in 1995,3 and which has represented a quantum leap in the care of TDT.
Materials and methods
This study retrospectively analyzed mortality and life expectancy of patients suffering from TDT (n = 1087) from 5 thalassemia day care centers in India between November 2011 and October 2018. There were 50 patients already registered at the start of study, and for this set of patients, the original registration date has been retained. Median patient age was 8.6 (interquartile range [IQR], 5-13.3) years, including 107 patients (9.84%) who were older than 18 years and who can be classified as adult patients with thalassemia.
These centers were set up for systematic management of thalassemia by the hospitals/care facilities in association with a nonprofit organization, Sankalp India Foundation, facilitating access to regular blood transfusions, routine laboratory investigations, complication management, and support with chelating agents, as specified elsewhere.4 Patients who did not attend at least 3 visits in the center were excluded from the study. We attempted to contact all patients who had transferred to other centers or who had been recorded as out of contact to reduce ascertainment bias. The records of patients who were transferred between participating centers were merged.
Each participating center used a web-based application platform designed to assist comprehensive management of TDT (ThalCare).5 This system was used to track information associated with treatment, including disease history at enrolment, demographic data, and follow-up as of 31 October 2018. Patients dropped out because they opted for bone marrow transplantation, transferred to another thalassemia center, or died. Involved centers treated both adult and pediatric patients in the same units, and thus the information was not segregated.5 Collection and analysis of data on the online database was approved by the institutional review boards at each participating center.
The data points extracted and analyzed are summarized in Table 1.
The summary of data points that were extracted and analyzed
| Time | Demographic information | Clinical features |
|---|---|---|
| Presentation | 1. Sex | 1. Number of transfusions |
| 2. Age | 2. Type of thalassemia syndrome | |
| 3. Age at first transfusion | 3. Iron overload | |
| 4. Socioeconomic status | 4. Transfusion transmitted infections | |
| 5. Place of residence | ||
| Last Seen | 1. Drop out reason and date | 1. Iron overload |
| 2. Splenectomy status | ||
| 3. Any heart disease | ||
| 4. Average Hb fall rate | ||
| 5. Hepatitis B vaccination status |
Most of the deaths occurred in hospitals other than the treating center, so that little information was available on the exact cause of death and acute problems during the time leading to death. Routine autopsies are rarely performed in India to ascertain the exact cause of death. Patient’s clinical history, complaints, laboratory reports, caretaker’s feedback, and wherever available, the death summary was used to classify the causes of death.
Statistics
All analyses were performed with R Statistical software (3.5.x).6
Survival analysis was performed from the age at presentation to the center until October 2018. The reasons for mortality were categorized. Overall survival was also separately analyzed for patients in their first, second, third, or subsequent decades of life.
Survival analysis.
Most patients were not enrolled at the time of disease onset so that standard Kaplan-Meier survival analysis could not be applied directly. Such a situation is usually referred to as left censored and right truncated data and factors late entrants. The Cnaan and Ryan approach is appropriate for analyses of data in studies, similar to this one, in which patients enter and leave the study cohort and observation begins only at enrolment and not at the onset of the disease.7,8
Univariate analysis.
Potential factors that may influence the outcome were studied using log rank analysis. Analysis of the hazard ratios for death between the different categories was done with 95% confidence intervals (CIs), using the Cox proportional hazards model.
Multivariable analysis.
Factors that were noted to be significant in univariate analysis were further analyzed using the Cox model with a stepwise selection to identify independent risk factors for poor outcomes.
Results
Forty-one patients died (28 males and 13 females). The median age at death was 15.4 (IQR, 8.4-22.6) years, and 16 patients were adults (>18 years). The median age at first transfusion was known for 1035 children (0.8 years; IQR, 0.5-2.1 years), and age at enrolment was 5.4 years (IQR, 1.6-10.25 years). Median follow-up at our centers was 2.5 years (IQR, 1.1 3.9 years). Table 2 summarizes the data from the centers, along with details of death.
Summary of the data from the centers along with details of death
| Sl no. | Center | Total patients, n | Males, n | Females, n | Children (age <18 y), n | Adults, n | Median age, y | Cured (BMT), n | Death, n | Transferred to other centers, n | Continued on care, n |
|---|---|---|---|---|---|---|---|---|---|---|---|
| 1 | IGICH Bangalore | 238 | 143 | 95 | 227 | 11 | 6.8 | 22 | 13 | 5 | 198 |
| 2 | JNMC, Belgaum | 222 | 136 | 86 | 210 | 12 | 8.45 | 7 | 4 | 1 | 210 |
| 3 | Samraksha, Bangalore | 427 | 252 | 175 | 346 | 81 | 10.9 | 48 | 20 | 4 | 355 |
| 4 | DWH, Mangalore | 77 | 44 | 33 | 74 | 03 | 8.4 | 0 | 1 | 1 | 75 |
| 5 | RDT, Ananthpur | 123 | 81 | 42 | 123 | 0 | 7 | 9 | 3 | 2 | 109 |
| Total | 1087 | 656 | 431 | 980 | 107 | 8.6 | 86 | 41 | 13 | 947 |
DWH, District Wenlock Hospital; IGICH, Indira Gandhi Institute of Child Health; JNMC, Jawaharlal Nehru Medical College; RDT, Rural Development Trust Hospital.
Overall survival
The actuarial overall survival at 26.9 years of age was found to be about 50%, with the last known event having occurred at age 31.3 years. Survival is adjusted for delayed entries, as patients were enrolled at different points during their supportive care history. The Kaplan Meier survival curve is shown in Figure 1.
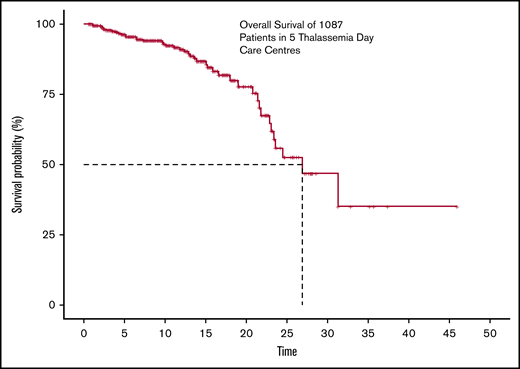
The overall survival of 1087 transfusion-dependant patients with thalassemia across 5 centers.
The overall survival of 1087 transfusion-dependant patients with thalassemia across 5 centers.
When study subjects were split on the basis of period of birth, the Kaplan-Meier analysis estimated the survival for patients born after 2000 (993 patients born between 1 January 2000 and 31 October 2018) to be 85.2% (95% CI, 79.4%-91.4%) and for patients born before 2000 (94 patients born before 1 January 2000) to be 29.4% (95% CI, 13.3%-65.1%). Table 3 shows the survival percentage across different timelines of birth
The table shows the survival % across different timelines of birth
| Period of birth | n | OS | 95% CI |
|---|---|---|---|
| Born before 2000 | 94 | 29.4 | 13.3-65.1 |
| Born between 2000 to 2004 | 148 | 84.2 | 73.5-96.4 |
| Born between 2005 to 2009 | 291 | 87.0 | 74.2-100 |
| Born between 2010 to 2014 | 387 | 93.7 | 89.9-97.8 |
| Born between 2015 to 2018 | 167 | 98.9 | 96.9-100 |
OS, overall survival.
The hazard of death for patients born before 2000 is 12.166 (95% CI, 2.33-63.37; P = .003), as seen in Figure 2A. No deaths are seen in the patients born before 2000 before the age of 15 years because the centers where the study was conducted enrolled them only after 2011.
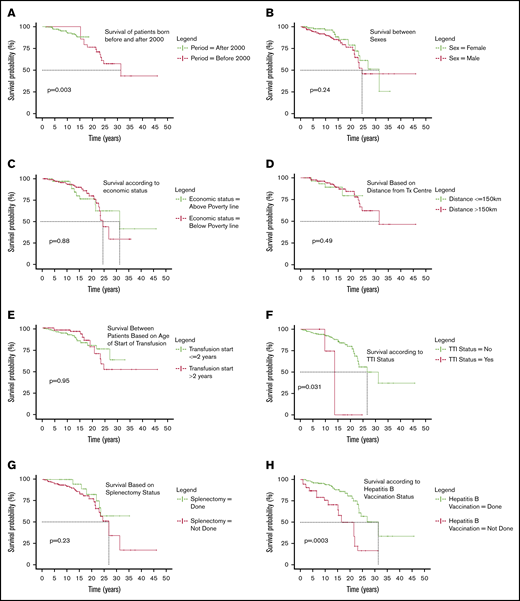
Categorical comparison of survival. (A) Surival of patients born before and after 2000. (B) Survival between sexes. (C) Survival according to economic status. (D) Survival based on distance from transfusion center. (E) Survival between patients based on age of start of transfusion. (F) Survival according to TTI status. (G) Survival based on splenectomy status. (H) Survival according to hepatitis B vaccination status. (I) Survival based on cardiac status. (J) Survival against different classes of serum iron levels. (K) Survival difference according to rate of fall of Hb per week. (L) Survival based on length of follow up at day care.
Categorical comparison of survival. (A) Surival of patients born before and after 2000. (B) Survival between sexes. (C) Survival according to economic status. (D) Survival based on distance from transfusion center. (E) Survival between patients based on age of start of transfusion. (F) Survival according to TTI status. (G) Survival based on splenectomy status. (H) Survival according to hepatitis B vaccination status. (I) Survival based on cardiac status. (J) Survival against different classes of serum iron levels. (K) Survival difference according to rate of fall of Hb per week. (L) Survival based on length of follow up at day care.
Univariate analysis
A stepwise univariate analysis was performed using the categorical variables, and is summarized in Table 4. Table 4 summarizes the factors potentially associated with mortality.
Table of factors potentially associated with mortality
| Factor | Category | Subjects | Events | Difference | |||||||
|---|---|---|---|---|---|---|---|---|---|---|---|
| Total, n | Overall split, % | Split by birth era, % | Total, n | Overall split, % | Split by birth era, % | ||||||
| Pre-2000 | Post-2000 | Pre-2000 | Post-2000 | Hazard ratio (95% CI) | Significance, P | ||||||
| Sex | Males | 1087 | 60.35 | 59.58 | 60.42 | 41 | 68.30 | 56.25 | 76.00 | 1.49 (0.77-2.91) | .241 |
| Females | 39.65 | 40.42 | 39.58 | 31.70 | 43.75 | 24.00 | 1 | ||||
| TTI status | Yes | 1087 | 1.66 | 5.32 | 1.31 | 41 | 9.76 | 12.50 | 8.00 | 3.4 (1.12-10.34) | .031 |
| No | 98.34 | 94.68 | 98.69 | 90.24 | 87.50 | 92.00 | 1 | ||||
| Splenectomy | Done | 1064 | 10.24 | 36.95 | 7.71 | 41 | 14.63 | 12.50 | 8.00 | 1 | .23 |
| Not done | 89.76 | 63.05 | 92.29 | 85.37 | 87.50 | 92.00 | 1.77 (0.7-4.46) | ||||
| HBV vaccination status | Done | 1087 | 84.36 | 85.11 | 84.29 | 41 | 68.29 | 62.50 | 72.00 | 1 | .000305 |
| Not done | 15.64 | 14.89 | 15.71 | 31.71 | 37.50 | 28.00 | 3.45 (1.75-6.81) | ||||
| Economic status | APL | 1056 | 17.33 | 42.39 | 14.94 | 36 | 25.00 | 26.67 | 23.81 | 1 | .88 |
| Below poverty line | 82.67 | 57.61 | 85.06 | 75.00 | 73.33 | 76.19 | 1.06 (0.47-2.39) | ||||
| Distance from treatment center | <150 km | 1042 | 6.62 | 7.53 | 6.53 | 41 | 17.07 | 12.50 | 20.00 | 1.36 (0.57-3.24) | .49 |
| >150 km | 93.38 | 92.47 | 93.47 | 82.93 | 87.50 | 80.00 | 1 | ||||
| Cardiac status | Normal | 501 | 94.81 | 83.95 | 96.90 | 21 | 80.95 | 70.00 | 90.91 | 1 | .1 |
| Complication | 5.19 | 16.05 | 3.10 | 19.05 | 30.00 | 9.09 | 2.8 (0.88-8.89) | ||||
| Ferritin level | Moderate (≤2000) | 1062 | 36.91 | 16.48 | 38.83 | 35 | 14.29 | 0.00 | 23.81 | 0.9412 (.30-2.93) | .92 |
| High (2000-4000) | 41.90 | 36.26 | 42.43 | 22.86 | 7.14 | 33.33 | 1 | ||||
| Severe (>4000) | 21.19 | 47.25 | 18.74 | 62.86 | 92.86 | 42.86 | 4.66 (1.93-11.29) | .00063 | |||
| Rate of drop of Hb | Moderate (≤1) | 1060 | 43.68 | 50.00 | 43.09 | 38 | 50.00 | 46.67 | 52.17 | 1.99 (0.95-4.13) | .0667 |
| High (1-2) | 52.08 | 45.56 | 52.68 | 31.58 | 33.33 | 30.43 | 1 | ||||
| Severe (>2) | 4.25 | 4.44 | 4.23 | 18.42 | 20.00 | 17.39 | 7.71 (2.92-20.4) | .000038 | |||
| Age of start of transfusion | Age ≤2 y | 1034 | 74.56 | 59.77 | 75.92 | 32 | 68.75 | 36.36 | 85.71 | 1 | .95 |
| Age >2 y | 25.44 | 40.23 | 24.08 | 31.25 | 63.64 | 14.29 | 1.03 (0.46-2.28) | ||||
| Length of follow-up at center | FUP <2 y | 1087 | 42.32 | 36.17 | 42.90 | 41 | 73.17 | 87.50 | 64.00 | 1 | |
| FUP 2-4 y | 34.04 | 30.85 | 34.34 | 19.51 | 6.25 | 28.00 | 0.135 (0.061-0.30) | 8.67 × 10⁻⁷ | |||
| FUP >4 y | 23.64 | 32.98 | 22.76 | 7.32 | 6.25 | 8.00 | 0.03 (0.009-0.097) | 7.7 × 10⁻⁹ | |||
APL, above poverty line; FUP, follow-up.
Sex.
Of the 1087 patients, 60% were males and 40% were females; of the 41 deaths, 28 were males and 13 were females (Figure 2B). Statistically, there is no difference in mortality between the sexes (P = .241).
Economic status.
The socioeconomic status of 1056 patients was known, with 82.67% of the population coming from economically weak backgrounds classified as below poverty line defined as those who are certified to have a family income less than Rs 27 000 or USD 380 per annum. There was no significant difference in survival (P = .88; Figure 2C).
Distance from transfusion center.
The distance details were available for 1042 patients and were segregated into 2 categories: transfusion center being less than or equal to 150 km (4 hours of travel) or more than 150 km (>4 hours of travel). Mortality did not seem to be influenced by the distance from center (P = .49; Figure 2D).
Age of starting transfusion.
In 1034 patients for whom date of first transfusion was available, patients were categorized as those who started receiving transfusions before the age of 2 years (generally accepted as thalassemia majors; 771 patients) and those who started receiving transfusion after 2 years of age (263 patients). Difference in survival was not significant (P = .95; Figure 2E).
TTI status.
Hepatitis B, hepatitis C, and HIV serology is ascertained routinely at least once a year. Of the 1087 patients in review, 18 were positive (2 HIV, 5 hepatitis C, 10 hepatitis B, and 1 positive for both hepatitis B and HIV). Although 16 patients tested positive at enrolment, only 2 were detected after starting transfusions at participating centers. Of the 41 deaths, 4 patients were positive for any 1 of those infections (1 HIV positive, 1 hepatitis C positive, and 2 positive for hepatitis B). TTIs were associated with increased mortality with log rank P = .031 (Figure 2F) and a hazard factor of 3.4 (95% CI, 1.12-10.34). Three of 4 patients who died with TTIs had abnormal liver function tests, and death was associated directly with these infections, whereas for the fourth patient, the circumstances of death are unknown.
Splenectomy.
There were 1064 patients whose splenectomy status was known (splenectomized = 109; nonsplenectomized = 955). We observed 35 deaths in the nonsplenectomized group and 6 in the splenectomized one, with no statistical significance in survival (P = .23; Figure 2G).
Hepatitis B vaccination.
Some patients reaching the day care center had either not been vaccinated for hepatitis B or do not have any immunization records. Hepatitis B vaccination was certainly done for 917 patients and was either unknown or not done in 170. Statistically significant higher mortality was observed in the nonvaccinated group (P = .0003; Figure 2H), with a hazard ratio of 3.45 (95% CI, 1.75-6.81).
Cardiac complications.
Cardiac complications are among the major causes of mortality in thalassemia.9 Cardiac screening was performed for 501 patients, and abnormalities detected in 26 patients (5.19%). The most frequent abnormalities detected were pulmonary hypertension and related secondary complications with dilation of chambers or pericardial effusion (61.54%), followed by mitral regurgitation or tricuspid regurgitation (23.07%), dilated cardiomyopathy (3.84%), and left ventricular dysfunction (3.84%). Two of the complications were not clearly classified. The survival of patients with cardiac abnormalities was not significantly different from those of those without any cardiac abnormality (P = .1; Figure 2I).
Iron overload.
Serum ferritin levels were measured in 1062 patients at regular intervals. All measurements right from the time of enrolment to 31 October 2018 were considered. A median of all values was considered for any given patient who was categorized as described in Table 5. The difference in survival curves showed strong statistical significance (P = .00063; Figure 2J). Once the ferritin increased beyond the 4000 mark, the hazard ratio for death was as high as 4.66 (95% CI, 1.93-11.29).
Summary of ferritin categorization
| Sl no. | Median ferritin levels, ng/dL | Category | No. of patients | Deaths, n |
|---|---|---|---|---|
| 1 | <2000 | Moderate | 392 | 5 |
| 2 | 2000-4000 | High | 445 | 8 |
| 3 | >4000 | Severe | 225 | 22 |
| Sl no. | Median ferritin levels, ng/dL | Category | No. of patients | Deaths, n |
|---|---|---|---|---|
| 1 | <2000 | Moderate | 392 | 5 |
| 2 | 2000-4000 | High | 445 | 8 |
| 3 | >4000 | Severe | 225 | 22 |
Rate of fall of Hb.
The rate of fall of Hb per week was studied. These data were available for 1060 patients. For the purpose of analysis, patients were categorized as described in Table 6.
Summary of categorization based on rate of fall of Hb
| Sl no. | Rate of fall of Hb, g/dL per wk | Category | Patients, n | Deaths, n |
|---|---|---|---|---|
| 1 | ≤1 | Moderate | 463 | 19 |
| 2 | 1-2 | High | 552 | 12 |
| 3 | >2 | Severe | 45 | 7 |
| Sl no. | Rate of fall of Hb, g/dL per wk | Category | Patients, n | Deaths, n |
|---|---|---|---|---|
| 1 | ≤1 | Moderate | 463 | 19 |
| 2 | 1-2 | High | 552 | 12 |
| 3 | >2 | Severe | 45 | 7 |
More than 56% of the patients were categorized as having either a high or severe rate of fall of Hb. The difference in survival curves showed a strong statistical significance (P < .0001; Figure 2K). The hazard ratio for death of a patient with severely dropping Hb is 7.71 (95% CI, 2.92-20.4) compared with those who had a drop of 1 to 2 g/dL per week.
Length of follow-up with proper management.
Nearly 42% patients have a follow-up time of 2 years or less, and in this group, 6.5% death was seen. For those who progressed to follow-up between 2 and 4 years, 2.16% patients died; this further dropped to 1.2% for those who were followed up more than 4 years. Three fourths of all deaths happened within the first 2 years of reaching the thalassemia day care center. Log rank analysis was highly significant (P < .0001; Figure 2L), suggesting that as the number of years of systematic management increases, survival improves.
Multivariable analysis
Factors showing significance univariately, that is, iron overload levels, rate of fall of Hb per week, TTI status, and state of hepatitis B vaccination, were entered in a multivariate model. A complete information set was available for 1022 patients. Severe fall in Hb level/week (>2 g/dL) and no hepatitis B vaccination maintained independent significance in terms of mortality. (Only the statistically significant ones are reported in Table 7.)
Significant factors associated with mortality as seen in multivariate analysis
| Category | Hazard ratio | 95% CI | P |
|---|---|---|---|
| Hb drop (category = severe) | 5.58 | 1.5 0-20.71 | .0007 |
| Hb drop (category = moderate) | 3.05 | 1.40-6.65 | .0049 |
| No hepatitis B vaccination | 2.86 | 1.20-6.75 | .0004 |
| TTI status = yes | 2.05 | 0.63-6.74 | .2349 |
| Iron overload (category = severe) | 0.88 | 0.41-1.88 | .7409 |
| Iron overload (category = moderate) | 0.63 | 0.27-1.44 | .2692 |
Bold indicates significant P values.
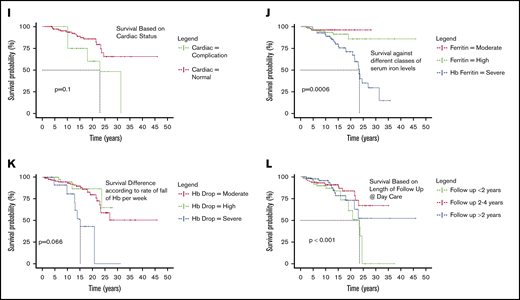
Causes of death
We categorized death according to previous studies10 (Figure 3). Of the 41 deaths, the actual or possible causes were unknown in 10 patients. Of the known remaining causes, infections (sepsis, TTI mediated, other intercurrent ones) seem to have caused 51.6% of deaths; about 35.4% of them were a result of severe organ iron overload. The breakup of the causes is presented here. Among the known causes of mortality, below the age of 10 years, infection was the major cause (30%). Between 10 and 20 years of age, iron overload (28.57%) and infections (42.86%) contributed to most of the mortality. For patients older than 20 years, the major reasons for mortality were infection (46.67%) and iron overload (40%).
Discussion
The availability of oral chelators may have vastly contributed to reducing mortality associated with thalassemia, but as observed earlier,11,12 death resulting from complications associated with iron overload continues to be a problem. To our knowledge, this is the first systemic analysis of causes of death in patients with thalassemia in the era of oral chelation in India. In the developing world, the absence of large registries, the poor availability of digital data associated with chronic disease management, and the practice of patients seeking treatment at more than 1 center depending on resource availability add to the challenges associated with assessment of mortality. Our analysis may provide some insights for planning resource allocations and benchmarking expected results. It could also help compare the various options available and help prioritize areas of thalassemia care to minimize mortality.
Patients registered at a median age of 5.4 years (IQR, 1.6-10.3 years), the median follow-up was 2.5 years (IQR, 1.1-3.9 years), and median age was 8.6 years. A total of 73.3% of the patients registered in the first, 22.5% in their second, and 4.2% in the third decade of life. Significant corrections in blood transfusions and iron chelation therapy were noted in these centers.4,13 Most deaths were reported in the first 2 years (73.17%). Of these, 33.67% were in the second and 43% in the third decade, reinforcing that initiating comprehensive medical care may not be able to immediately reverse the significant damage resulting from suboptimal care received earlier. The fact that the mortality dropped from 6.52% in first 2 years to 1.17% for those who followed for more than 4 years highlights the effectiveness of specialized thalassemia centers.
In spite of the advancements in thalassemia care in the last 2 decades,13,14 mortality associated with thalassemia management continues to be a significant challenge. Systemic limitations in health care delivery, difficulty in getting blood, and out-of-pocket expenses for medicines and diagnostics or compliance are probable reasons. In India, the current death rate in patients with TDT is roughly equivalent to that in the United Kingdom in the 1980s; that is, when only parenteral chelation was available.10
Only 50% survival by age 26.9 years is a reminder that thalassemia continues to be a life-threatening disease. The fact that 58.6% of the patients are in their first decade and 34.2% are in their second decade, and only 7.4% beyond the age of 20 years, corroborates our analysis. The evident rapid fall in survival during the second and third decades emphasizes the need for adaptive management approaches after the first decade and the possible lack of familiarity/readiness facing the issues of adult patients with thalassemia.
We observed under-5 mortality 7 times higher in patients with thalassemia (3.5%) as opposed to the general population (0.5%).15 Our observation of under-5 mortality is double the one estimated by Modell et al.1 for Southeast Asia; mortality as high as 20%16 was reported from Egypt. Many patients come with profound anemia and huge hepatosplenomegaly at enrolment with late diagnosis and poor management history.
Although there is consensus that TTI increases morbidity and mortality, there is little quantification of the associated mortality. A hazard ratio of 3.4 (95% CI, 1.12-10.34; P = .031) is alarming, especially because the current study was conducted in centers that have lower TTI rates (3.2%) than reported elsewhere in low- or middle-income countries (5%-50%).4,17 Emphasis on hepatitis B vaccination seems important, especially because vaccination rates in the general population in regions with high thalassemia prevalence continue to be in the 34% to 44% range.17,18 Although vaccination for hepatitis B provided very specific protection, there is a significant difference seen in the survival of patients with or without hepatitis B vaccination. We believe that this reflects immunization status as an indicator of quality of health care received.
Splenectomy did not seem to affect survival, which may argue in favor of conservative management with regular transfusions, especially at younger ages,12,19,20 thus reducing the risk for infectious and thrombotic complications.11,21 Splenectomy was more common before 2010.
Cardiac evaluation for patients with thalassemia is being routinely started at 10 years of age, although we have observed mortality associated with cardiac complications even before age 10 years. In fact, serum ferritins persistently higher than 2500 ng/mL may increase cardiac risk,22 even below age 10 years.
Mortality associated with high ferritin increases steeply beyond age 10 years. Of the 41 deaths, the average median ferritin level was 2692 ng/dL for those younger than 10 years, 3192 ng/dL for those aged 10 to 20 years, and 4230 ng/dL above 20 years of age.
Almost all patients maintained hemoglobin above 8 g/dL, and this was accomplished by tailored transfusion scheduling. The rate of hemoglobin drop is a readily available indicator with 1 g/dL per week, equating blood requirement of 200 mL/kg per year. Transfusion requirement increases mainly because of hypersplenism/splenomegaly, and occasionally because of allo-immunization.
Unlike a previous study,23 our findings suggest that for patients with TDT, whether they started transfusions earlier or later than 2 years made no difference.
Using pretransfusion hemoglobin levels and serum ferritin levels, we had earlier reported how specific focus on delivery of equitable health care could mitigate the effect of social determinants, including economic status, sex, and traveling distance to the treatment center. Our earlier findings have been confirmed by using mortality, and suggest that care delivery focused on equity bridged the gaps of social determinants and led to similar survival.24 Once patients are brought to centers for care, sex has no significant effect on survival; however, there is an evident sex bias at enrolment, with a ratio of 2:1 in favor of boys.
In countries in which good supportive care is available, the predominant cause of death is cardiac complications.19,20 We may not have seen cardiac complications among the leading causes of mortality because many patients may be dying earlier because of other causes, which is in agreement with other studies.12 Many deaths for which the cause could not be established may have been cardiac complications not diagnosed as such.
Increasing the knowledge base on real-world mortality data for severe thalassemia syndromes is critical for the development of evidence-based recommendations dealing with its prevention and cure. In fact, in India, the number of centers offering hematopoietic stem cell transplantation, the only established definitive cure for thalassemia, has expanded exponentially in recent years,21 and transplantation has become increasingly effective,11 much less expensive compared with the West,25 and effective across histocompatibility barriers,23 thus potentially applicable to the majority of patients with TDT. Given the chronic nature of TDT and the potential for a long and productive life with supportive care only, counseling about hematopoietic stem cell transplantation may be challenging. Transplantation may be a cost-effectiveness compared with long-term supportive care,26 but governments and other health care-funding agencies will need mortality data to benchmark outcomes and develop consensus indications and financial coverage criteria. Counseling about prevention, prenatal diagnosis, and pregnancy interruption also need objective and context-relevant outcome data.
By using National Institute of Immunohematology, Mumbai, India,27 estimates of 100 000 patients living with thalassemia and an average of 11 000 new births annually in 2017, assuming the births with thalassemia would have grown at the same pace as the general population and using World Bank data on the Indian population growth rate28 the estimated average annual death rate, even if we consider only last 25 years, comes to 8%, which is 4 times more than our finding. We acknowledge that several factors, including imbalance in the sex ratio, median age of patients under care being less than 10 years, and the fact that most patients received suboptimal care before enrolment at these centers, suggest that the mortality that we report may be underestimated.
Although in general thalassemia management has been improving, mortality associated with conservative medical management of thalassemia continues to be high in India. Suboptimal blood transfusions, iron chelation therapy, and TTIs continue to be the significant risk factors. Comprehensive thalassemia care in dedicated thalassemia day care centers from a very early age is likely to improve the long-term outcome. The current long-term survival figures on conservative medical management in local settings provide crucial information for counseling families about alternative treatment options such as stem cell transplant and for public policy makers.
Authorship
Contribution: R.D. collected the data, performed the statistical analyses, interpreted the data, and wrote the manuscript; A.S., K.A., L.P., and S.H. coordinated patient registration, data management, and data collection; R.K.A. designed and performed the research; G.R., A.G., S.G., P.G., H.P., J.D.R., C.K., S.J., N.R.T., U.V.S., D.P., S.R., C.P.R., D.T., and L.F. participated in patient management; R.K.A., S.R., C.P.R., D.T., and L.F. interpreted the data and contributed to writing the manuscript; X.C. performed and reviewed the statistical analysis; and all authors critically reviewed and approved the manuscript.
Conflict-of-interest disclosure: The authors declare no competing financial interests.
Correspondence: Rajat Kumar Agarwal, Sankalp India Foundation, #304-D, Chamundi Emerald, 1st Main, 7th Cross, N S Palya, BTM II, Bangalore 560076, India; e-mail: rajat@sankalpindia.net.
Acknowledgments
The authors thank all our patients and their families. The authors also thank all the institutions that were involved in caregiving.
Funding for this project was made available by the Sankalp India Foundation; Jai Shivshakti Health and Education Foundation; Jagriti InnoHealth Platforms Pvt. Ltd., Bangalore, India; and Cure2Children Foundation, Florence, Italy.

