

Key Points
uhCG is a readily available and promising supportive therapy for life-threatening aGVHD.
uhCG also contains EGF, which could aid in the repair of damaged intestinal epithelium.

Abstract
Acute graft-versus-host disease (aGVHD) is a potentially fatal complication of allogeneic hematopoietic cell transplantation that fails to improve with intense immunosuppression in some patients. We hypothesized that urinary-derived human chorionic gonadotropin (uhCG) could help facilitate resolution of life-threatening aGVHD when added as supportive care via 2 potential mechanisms: immunomodulation (akin to its role in pregnancy) and supplementation of epidermal growth factor (EGF; to aid in epithelial repair). In a phase 1 study, 26 participants received subcutaneous injections of uhCG in addition to standard immunosuppression (13 receiving initial therapy for high-risk aGVHD [according to the Minnesota criteria] and 13 receiving second-line therapy). Participants underwent serial blood testing for biomarkers of hormone response, immune modulation, and aGVHD activity on study. uhCG was well tolerated, with no dose-limiting toxicities. Sixty-two percent of patients in the high-risk cohort and 54% of patients in the second-line cohort had a complete response at study day 28. Plasma EGF was elevated sixfold (from 4 to 24 pg/mL; P = .02) at 6 hours postdose in the high-risk cohort, in contrast to no peak in plasma EGF in the more severe second-line cohort. After 1 week of uhCG, patients reported a twofold increase in the regulatory T cell to conventional T-cell ratio, suggesting immune modulation despite high-dose steroids. Responding patients reported significantly lower plasma amphiregulin and higher plasma butyrate levels at study completion, suggesting improvement in mucosal damage over time. uhCG is a novel, safe, supportive therapy, proceeding to phase 2 testing at 2000 units/m2 in high-risk aGVHD. This study was registered at www.clinicaltrials.gov as #NCT02525029.
Introduction
Acute graft-versus-host disease (aGVHD) is an immune-mediated complication of allogeneic hematopoietic cell transplantation (HCT) characterized by donor T-cell attack on host target tissues, especially skin, intestine, and liver.1 Approximately one-half of HCT recipients develop aGVHD,2,3 and 1 in 5 patients with aGVHD die of the complication.4 Corticosteroids are the established primary therapy for aGVHD, durably improving symptoms in only one-half of patients.5 Randomized, prospective studies of corticosteroids plus additional immune suppressant medications have failed to improve organ function or survival after aGVHD, leaving corticosteroids alone as the sole first-line therapy used today.6 Currently, outside of clinical trials, most patients with steroid-refractory aGVHD are treated with intensified immunosuppression on the assumption that uncontrolled T cell–mediated inflammation is responsible for steroid failure. Durable, complete responses to second-line therapies for refractory aGVHD occur in only 20% of patients, with few long-term survivors.7
Recent studies suggest steroid response can be predicted based on either the severity of symptoms at presentation8 or blood-based biomarkers.9 However, identifying interventions for high-risk patients remains a significant clinical challenge.10 Histologically, intestinal crypt loss, not lymphocytic infiltration, is more strongly associated with poor outcomes in gastrointestinal aGVHD.11 This fact suggests that impaired healing of damaged tissues, not solely excessive immune activation, may also contribute to the poor outcomes after severe aGVHD. On the basis of these findings and decades of intensified immunosuppression as the clinically disappointing paradigm for treatment of high-risk or refractory aGVHD,12 we proposed that interventions to facilitate healing might be beneficial in life-threatening aGVHD.
We hypothesized that supplementation of epidermal growth factor (EGF), which is contained in an inexpensive, commercially available drug (urinary-derived human chorionic gonadotropin [uhCG]) could promote resolution of tissue damage in severe aGVHD. The application of hCG in the setting of life-threatening aGVHD is also potentially promising due to its known effects on regulatory T-cell (Treg) expansion in support of maternal/fetal tolerance.13 To identify the maximum tolerated dose of uhCG, we completed a phase 1 study in a cohort of 26 patients: patients with high-risk aGVHD according to the Minnesota criteria (n = 13) and patients needing second-line therapy (steroid-dependent/refractory, n = 13). We assessed pharmacokinetic parameters of the EGF component of uhCG, performed analyses of peripheral blood Tregs and conventional T cells (Tcon), and analyzed aGVHD biomarkers and circulating short chain fatty acids (SCFA) during the course of therapy. In completing these analyses, we have identified the dose of uhCG for phase 2 study in high-risk patients and determined biological indicators accompanying successful response to therapy in this phase 1 clinical trial.
Materials and methods
Study design
This analysis was a single-institution phase 1 study of supplemental uhCG to facilitate tissue repair in conjunction with standard immunosuppressive therapy in the setting of a high-risk first-line (Arm 1) and second-line (Arm 2) treatment of aGVHD. In the dose-finding phase, the dose escalation followed 2 independent paths for Arm 1 (high-risk) and Arm 2 (steroid-refractory aGVHD). Patients aged 0 to 76 years were eligible for this study within 7 days of diagnosis of new-onset Minnesota high-risk aGVHD (first-line) or a flare or progression of previously treated aGVHD of at least grade 2 severity with no time constraint on diagnosis (second-line). Patients were not allowed to cross over onto the second-line arm from the first-line arm; these are independent cohorts of patients. Additional inclusion criteria included adequate renal (creatinine level ≤2.5 times the upper limit of normal) and cardiac (left ventricular ejection fraction ≥35%) function. Exclusion criteria included thrombosis within 3 months of study start, current thromboembolic disease requiring full-dose anticoagulation (pharmacologic prophylaxis for thromboembolic disease was allowed), previous diagnosis of a hormone responsive malignancy, progressive malignancy, uncontrolled infection at initiation of protocol treatment, unwilling or unable to stop supplemental sex hormone therapy (estrogen, progesterone, and/or testosterone preparations), pregnancy, and women or men of childbearing potential unwilling to take adequate precautions to avoid unintended pregnancy from the start of protocol treatment through 28 days after the last treatment.
This study was approved by the University of Minnesota Institutional Review Board, and all participants signed written, informed consent. This study is registered at ClinicalTrials.gov (#NCT02525029). Patients received uniform supportive care according to institutional standards on this study, including steroids at a consistent dose (methylprednisolone 48 mg/m2 IV or prednisone 60 mg/m2) for 14 days at diagnosis of aGVHD. Responding patients tapered corticosteroids over 8 weeks per institutional guidelines. All patients received encapsulated bacteria prophylaxis, herpes simplex and varicella zoster virus prophylaxis, antifungal prophylaxis, and prophylaxis against Pneumocystis jirovecii according to institutional standards.
Dose assignment of uhCG and response assessment
The continual reassessment method was used to identify the dose level that corresponds to the maximum toxicity rate of ≤25%. For both study arms, dosing began at 500 units hCG/m2 (level 1), then went up to 1000 units hCG/m2 (level 2) and 2000 units hCG/m2 (level 3) after a 21-day safety monitoring period in each dose cohort of 2 patients. In the first-line arm, patients received uhCG injections subcutaneously every other day for 7 days, at which time response was assessed. In the second-line arm, patients received uhCG injections subcutaneously every other day for 14 days, at which time response was assessed. This was a predetermined difference based on the rationale that patients with a longer duration of severe aGVHD may take longer to respond. Patients showing clinical benefit (complete response [CR; total resolution of symptoms], partial response [PR; improvement of at least 1 organ stage in all involved organs], or mixed response [MR; improvement of at least 1 organ stage with no improvement in other organs]) at the time of the initial response assessment were allowed to continue maintenance dosing of uhCG twice weekly for 5 weeks. Patients with no improvement in organ staging and/or needing increased doses of steroids or additional systemic immunosuppression were considered nonresponders.
Study end points
The primary end point of the study was the maximum tolerated dose of uhCG in each study arm. Secondary clinical end points included proportions of response among the surviving patients at days 7, 14, 28, and 56; overall survival; and nonrelapsed mortality (NRM). Safety end points included monitoring of blood counts (hemoglobin, total white blood cell counts, absolute lymphocyte counts, and platelet counts) and hormone levels (hCG, estradiol, testosterone, and progesterone). Dose-limiting toxicities were defined as any of the following events occurring within 21 days of the first uhCG dose: (1) grade 2 to 4 thromboembolic event (Common Terminology Criteria for Adverse Events version 4), which was when any thrombosis more severe than a superficial venous thrombosis develops and treatment with anticoagulation is required; (2) grade 3 to 4 ascites (Common Terminology Criteria for Adverse Events version 4); and (3) grade 3 to 4 ovarian hyperstimulation syndrome, defined as the rapid development of enlarged, cystic, painful ovaries (female subjects only).
Correlative studies
Correlative studies included: measurement of the EGF component of uhCG, measured at baseline and 1, 3, 6, and 24 hours postdose on the day of response evaluation (day 7 for the first-line arm and day 14 for the second-line arm); aGVHD biomarkers (suppressor of tumorigenicity 2 [ST2] and regenerating islet-derived protein 3 alpha [REG3a]) and tissue damage biomarkers (amphiregulin [AREG]); enumeration of CD4+ CD25+ FoxP3+ CD127– Treg and CD8+ Tcon; and measurement of plasma SCFA by using mass spectroscopy. All were measured at baseline and days 7, 14, 28, and 56 on study. Lymphocyte subsets, including Treg and Tcon, were enumerated in the University of Minnesota Translational Cell Therapy Laboratory using FlowJo version 9.85 using antibodies and methods as previously reported.14 We determined gene expression profiles of peripheral blood mononuclear cells at pretreatment baseline and day 7 using the nCounter Human Immunology panel (NanoString, Seattle, WA). AREG protein concentrations in plasma samples were determined by using enzyme-linked immunosorbent assay (R&D Systems, Minneapolis, MN) according to the manufacturer’s instructions, with an assay sensitivity of 1.4 pg/mL. No sample had an AREG value below the detection limit.
All samples were run simultaneously with identical standard curves and sensitivities. ST2 and REG3α were measured by using a multiplex Luminex-based array (R&D Systems). AREG, ST2, and REG3 were all measured in the Cytokine Reference Laboratory at the University of Minnesota. Plasma SCFA were quantitated by one of the authors (C.C.) using liquid chromatography–mass spectrometry (LC-MS). Samples were derivatized with 2-hydrazinequnoline before the LC‐MS analysis to detect carboxylic acids, aldehydes, and ketones.15 Briefly, 2 μL of plasma sample or short chain fatty acid standard mixture was added to 100 µL of freshly prepared acetonitrile solution containing 1 mM 2,2-dipyridyl disulfide, 1 mM triphenylphosphine, and 1 mM 2-hydrazinequnoline. The reaction mixture was incubated at 60°C for 30 minutes, chilled on ice, and then mixed with 100 μL of ice‐cold deionized water. After centrifugation at 18 000g for 10 minutes, the supernatant was transferred into a high-performance liquid chromatography vial for LC‐MS analysis. A 2 μL aliquot was injected into an ultraperformance liquid chromatography–quadrupole time-of-flight mass spectrometry SYNAPT-G2-Si system (Waters, Milford, MA); it was separated by a BEH C18 column (Waters) with a gradient of mobile phase ranging from water to 95% aqueous acetonitrile containing 0.1% formic acid over a 10-minute run. Capillary voltage and cone voltage for electrospray ionization were maintained at 3 kV and 30 V for positive mode detection, respectively. Source temperature and desolvation temperature were set at 120°C and 350°C. Nitrogen was used as both cone gas (50 L/h) and desolvation gas (600 L/h), and argon was used as collision gas.
For accurate mass measurement, the mass spectrometer was calibrated with a sodium formate solution (range m/z 50-1000) and monitored by the intermittent injection of the lock mass leucine enkephalin ([M + H]+ = 556.2771 m/z) in real time. Mass chromatograms and mass spectral data were acquired and processed by using MassLynx software (Waters) in centroided format. The raw data were processed and quantified by using QuanLynx software (Waters).
Statistical analysis
Descriptive statistics, including mean, median, and range, were used to describe clinical and laboratory variables. Comparisons of continuous variables between groups were made by using Student t tests or Wilcoxon rank sum tests, and all P values were 2-sided. Statistical analysis of peripheral blood mononuclear cell gene expression profiles was performed using the limma package within Bioconductor (R), adjusting for multiple comparisons with Bonferroni correction.16 Overall survival was defined as the time from study initiation to death or last follow-up, estimated by using Kaplan-Meier curves. NRM was defined as the time from study initiation to death due to reasons other than relapse or last follow-up, estimated by the cumulative incidence function.
Results
Dosing and toxicities
Patient demographic characteristics are detailed in Table 1. The median age in both study arms was 65 years, and most patients were male. The median Karnofsky performance status was 70 in the first-line high-risk aGVHD arm and 30 in the second-line arm. The majority of patients had severe (stage 3-4) lower intestinal aGVHD. Therapy with uhCG was well tolerated, with no dose-limiting toxicities and no grade 4 to 5 toxicities attributed to study drug. In both the high-risk first-line and second-line cohorts, 2 patients were treated at dose level 1 (500 units uhCG/m2), 2 patients were treated at dose level 2 (1000 units uhCG/m2), and 9 patients were treated at the maximum dose level 3 predefined for this study (2000 units uhCG/m2). The median EGF dose contained within the uhCG injections was 50 833 pg/mL (range, 23 950-226 056 pg/mL), corresponding to a median 50.8 pg EGF to 1 unit of uhCG. The median EGF dose given per injection was 102 865 pg (range, 24 178-822 943 pg), with no difference in EGF dose between Arm 1 and Arm 2 (P = .95). The toxicities observed were within expected adverse events for patients with advanced aGVHD, including laboratory abnormalities and infections (Table 2). Only edema seemed to be a treatment-emergent adverse event attributable, at least in part, to uhCG, although patients in this study were notably hypoalbuminemic at entry.
Patient demographic characteristics
| Characteristic | First-line high-risk cohort (n = 13) | Second-line cohort (n = 13) |
|---|---|---|
| Age, median (range), y | 65 (24-75) | 65 (38-69) |
| Karnofsky performance score, median (range) | 70 (30-80) | 30 (10-60) |
| Male sex, n (%) | 9 (69) | 10 (77) |
| Graft source, n (%) | ||
| Marrow | 1 (7.7) | 0 (0) |
| Peripheral blood stem cells | 7 (53.9) | 9 (69.2) |
| Umbilical cord blood | 5 (38.5) | 4 (30.8) |
| Conditioning, n (%) | ||
| Myeloablative | 5 (38.5) | 3 (23.1) |
| Reduced Intensity | 8 (61.5) | 10 (76.9) |
| Posttransplant day of enrollment, median (interquartile range) | 92 (42-160) | 133 (109-225) |
| aGVHD organ stage at enrollment, n (%) | ||
| Skin | ||
| 0 | 9 (69.2) | 9 (69.2) |
| 1 | 2 (15.4) | 0 (0) |
| 2 | 0 (0) | 2 (15.4) |
| 3 | 2 (15.4) | 2 (15.4) |
| Lower gastrointestinal | ||
| 1 | 0 (0) | 1 (7.7) |
| 2 | 4 (30.8) | 1 (7.7) |
| 3 | 7 (53.9) | 4 (30.8) |
| 4 | 2 (15.4) | 7 (53.9) |
| Liver | ||
| 0 | 10 (77) | 9 (69) |
| 1 | 1 (7.7) | 1 (7.7) |
| 2 | 0 (0) | 3 (23.1) |
| 3 | 2 (15.4) | 0 (0) |
| aGVHD clinical grade at enrollment, n (%) | ||
| 2 | 0 (0) | 1 (7.7) |
| 3 | 11 (84.6) | 5 (38.5) |
| 4 | 2 (15.4) | 7 (53.9) |
| Baseline albumin, median (range), g/dL | 2.7 (1.8-3.5) | 2.2 (0.9-2.6) |
| Concomitant GVHD therapy | Methylprednisolone 48 mg/m2/d or prednisone equivalent | ATG (5), etanercept (2), ruxolitinib (1), sirolimus (3), steroid boost (2) |
ATG, antithymocyte globulin.
Adverse event occurrences
| Toxicity category | Description | Grade | ||||
|---|---|---|---|---|---|---|
| 1 + 2 | 3 | 4 | 5 | Total | ||
| Gastrointestinal disorders | 7 abdominal pain, 3 constipation, 2 ascites, 2 perforation, remaining other | 14 | 10 | 1 | 1 | 26 |
| Laboratory abnormalities | 13 elevated LFT results, 3 elevated creatinine, remaining other | 14 | 5 | 2 | 0 | 21 |
| General disorders and administration site conditions | 12 lower extremity edema, 4 trunk edema, 2 chest pain, 2 fatigue | 19 | 2 | 0 | 0 | 21 |
| Infections and infestations | 3 BK viruria, 1 Clostridioides difficile, 3 CMV viremia, 2 bacteremia, 1 EBV viremia, 1 toxoplasmosis, 1 influenza, remaining other | 5 | 10 | 0 | 2 | 17 |
| Respiratory, thoracic, and mediastinal disorders | 5 epistaxis, 5 dyspnea, 2 hypoxia | 12 | 2 | 1 | 0 | 15 |
CMV, cytomegalovirus; EBV, Epstein-Barr virus; LFT, lung function test.
Clinical outcomes
Patients in the first-line arm received uhCG every other day through day 7, at which time a response was assessed. Patients with a CR, PR, or MR could continue on study and receive maintenance doses of uhCG twice weekly for up to 5 more weeks. Only 1 of 13 patients discontinued uhCG due to lack of response at day 7. By day 14, two additional patients came off study due to progression and received second-line therapy. At day 28 of study, responses in the high-risk first-line cohort were 8 of 13 with CR (62%), 0 of 13 with PR (0%), 1 of 13 with MR (7%), and 4 of 13 with no response (NR; 31%) (Figure 1A). The patient with an MR had skin, liver, and intestinal involvement with aGVHD with skin and liver responses but a later bowel perforation and death before day 56. Three patients who had a flare at day 56 later regained responses after an increase in the steroid dose.
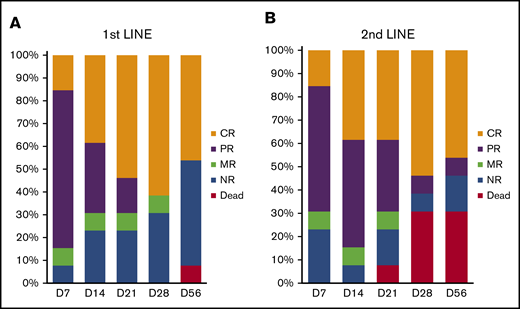
Response to uhCG therapy. The bar graphs indicate proportions of patients in the first-line therapy cohort (A) and the second-line therapy cohort (B) who had a CR, PR, MR, or NR or who died before day 56 from initiating treatment on study.
Response to uhCG therapy. The bar graphs indicate proportions of patients in the first-line therapy cohort (A) and the second-line therapy cohort (B) who had a CR, PR, MR, or NR or who died before day 56 from initiating treatment on study.
Patients in the second-line arm received uhCG every other day through day 14, at which time a response was assessed. Patients with a CR, PR, or MR could continue on study and receive maintenance doses of uhCG twice weekly for up to 5 more weeks. Only 1 of 13 patients was unable to continue uhCG maintenance dosing due to lack of response at day 14. Day 28 responses in the second-line cohort were 7 of 13 CR (54%), 1 of 13 PR (8%), and 5 of 13 NR (38%), 4 of which were deaths (31%) (Figure 1B). Three of the 4 deaths were due to aGVHD; 1 patient died of relapsed malignancy. One patient with a CR at day 28 had a flare before day 56, with recurrent gastrointestinal hemorrhage that later improved after a slow taper of immunosuppression.
Responses were observed in all dose levels in both cohorts except for dose level 1 in the second-line cohort, in which both patients had NR at day 28. Overall, with 1 year of follow-up in both arms, the cumulative incidence of NRM in day 28 responders is 6% (95% confidence interval [CI], 0-18) and 33% in nonresponders (95% CI, 0-67). The overall survival at 1 year is 88% (95% CI, 59-97) in day 28 responders, and 67% (95% CI, 19-90) in nonresponders. The clinical outcomes through 1 year of follow-up is shown as a swimmer plot in supplemental Figure 1.
Changes in laboratory parameters
Therapy with uhCG did not worsen cytopenias, with no significant changes in hemoglobin (P = .67), white blood cell counts (P = .63), absolute lymphocyte count (P = .8), or platelets (P = .95) over the course of the study. All patients had demonstrable elevations in serum hCG (P < .001), estradiol (P = .003), and testosterone (P = .01) comparing baseline vs day 7, with a minimal elevation in hCG still detectable at day 56 (mean, 13.7 IU/L) (Figure 2A). Serum albumin was low (in contrast to the normal range of 3.5-5 g/dL) (Figure 2B) in each cohort. However, serum albumin levels were significantly higher than baseline at day 28 and day 56 in second-line patients only.
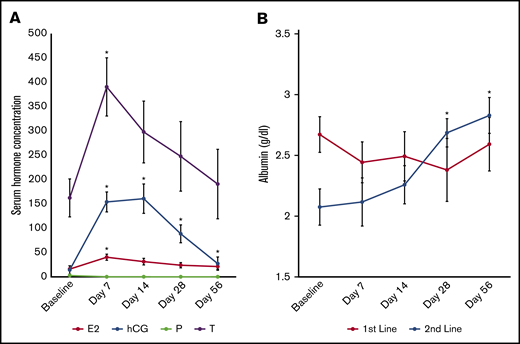
Changes in laboratory parameters. (A) Serum hCG (measured in international units per liter), estradiol (E2; in picograms per milliliter), and testosterone (T; in nanograms per deciliter) were all significantly higher than baseline after 1 week on study. Progesterone (P; in nanograms per milliliter) did not change from baseline. (B) Serum albumin was significantly higher at days 28 and 56 in Arm 2 only. Data are presented as mean ± standard error of the mean (SEM). *P < .05 compared with baseline.
Changes in laboratory parameters. (A) Serum hCG (measured in international units per liter), estradiol (E2; in picograms per milliliter), and testosterone (T; in nanograms per deciliter) were all significantly higher than baseline after 1 week on study. Progesterone (P; in nanograms per milliliter) did not change from baseline. (B) Serum albumin was significantly higher at days 28 and 56 in Arm 2 only. Data are presented as mean ± standard error of the mean (SEM). *P < .05 compared with baseline.
Changes in serum EGF and peripheral blood mononuclear cells
We performed analyses of the EGF component of uhCG, measuring plasma EGF at 1, 3, 6, and 24 hours postdose. Plasma EGF rose from a baseline 4 pg/mL to 44 pg/mL at 6 hours post-uhCG dose in the first-line only group (P = .02) (Figure 3A). The 6-hour postdose rise in EGF increased by dose level in the first-line cohort, with a mean serum EGF level of 10.5 pg/mL in dose level 1, 15.2 pg/mL in dose level 2, and 27.9 pg/mL in dose level 3. Plasma EGF never changed significantly from the baseline 3.7 pg/mL in the second-line cohort (P = .48). Standard pharmacokinetic calculations, including half-life, were not possible because 65% of the timed samples had an EGF level below the detection limit.

Changes in serum EGF and T cell subsets. (A) Plasma EGF rose significantly at 6 hours post-uhCG dose in first-line patients (blue) but not in second-line patients (orange). (B) The Treg to Tcon ratio was higher at day 7 compared with baseline. Representative Treg scatterplots from a patient at baseline (C) and day 7 (D) show an elevated proportion of CD4+ CD25+ FoxP3+ CD127– Tregs. Data are presented as mean ± SEM. *P < .05 compared with baseline.
Changes in serum EGF and T cell subsets. (A) Plasma EGF rose significantly at 6 hours post-uhCG dose in first-line patients (blue) but not in second-line patients (orange). (B) The Treg to Tcon ratio was higher at day 7 compared with baseline. Representative Treg scatterplots from a patient at baseline (C) and day 7 (D) show an elevated proportion of CD4+ CD25+ FoxP3+ CD127– Tregs. Data are presented as mean ± SEM. *P < .05 compared with baseline.
Expansion of Tregs could indicate a response to uhCG, as previously described.13,17 Overall, we observed a more than twofold increase in the peripheral blood Treg/Tcon ratio at day 7 of therapy (P = .01) (Figure 3B) that gradually returned to baseline as dosing of uhCG became less frequent and then ceased between days 42 and 49. We present scatterplots of a representative patient increasing the proportion of circulating CD4+ CD25+ Foxp3+ CD127– Tregs from study baseline (Figure 3C) to day 7 of study (Figure 3D), with absolute Treg and Tcon counts shown in supplemental Figure 2. We also noted that the Treg/Tcon ratio was significantly higher in patients with a day 28 CR/PR vs those with NR (Treg/Tcon ratio 0.48 vs 0.02; P = .02), suggesting that an elevated Treg/Tcon response may be important for clinical outcomes.
We performed gene expression profiling using NanoString on peripheral blood mononuclear cells at pretreatment baseline compared with day 7 to understand the early gene expression changes associated with a favorable response to therapy. As shown in Table 3, we found that 10 genes associated with a CR/PR at day 28 were statistically significantly increased from baseline to day 7: RPS6KA5, CCR3, MEF2C, ROCK2, TLR3, MAP2K4, CYSLTR2, OAS2, STAT2, and STAT1. Analyzing this gene set by using the Enrichr tool to access the National Cancer Institute–Nature 2016 database, we found that the most significantly enriched cell-signaling pathway in this gene set is ErbB1 (also known as EGFR) signaling (Table 4), suggesting that the EGF component of uhCG is biologically relevant. Twenty genes were associated with response irrespective of the date of blood draw (Table 5), with high BCL2L1 most strongly associated with a CR/PR at day 28 and high AREG most strongly associated with NR.
Genes differentially expressed within peripheral blood mononuclear cells, comparing pretreatment baseline vs day 7 of study
| Gene | Visit fold change | Adjusted P | Response fold change | Adjusted P |
|---|---|---|---|---|
| RPS6KA5 | 0.35 | .02 | 1.67 | <.001 |
| CCR3 | 0.57 | .02 | 2.39 | <.001 |
| MEF2C | 0.68 | .02 | 2.95 | .01 |
| ROCK2 | 0.53 | .02 | 1.77 | .02 |
| TLR3 | 0.62 | .02 | 1.92 | .03 |
| MAP2K4 | 0.55 | .00 | 1.40 | .03 |
| CYSLTR2 | 0.51 | .04 | 1.86 | .03 |
| OAS2 | 0.63 | .04 | 2.23 | .03 |
| STAT2 | 0.37 | .04 | 1.32 | .03 |
| STAT1 | 0.56 | .02 | 1.69 | .04 |
| MYC | 0.48 | .03 | 1.45 | .06 |
| CCR2 | 0.91 | .04 | 2.72 | .08 |
| GNB1 | 0.24 | .02 | 0.57 | .11 |
| LTB | 0.67 | .01 | 1.33 | .11 |
| CXCL10 | 1.32 | .03 | 3.17 | .12 |
| PRKCA | 0.41 | .02 | 0.90 | .12 |
| LTA | 0.40 | .03 | 0.92 | .14 |
| CEBPB | −0.37 | .04 | −0.86 | .17 |
| CRP | −0.50 | .04 | −1.00 | .23 |
| TLR5 | 0.60 | .02 | 1.00 | .24 |
| CCL16 | −0.67 | .02 | −1.00 | .29 |
| TRAF2 | 0.37 | .03 | 0.46 | .42 |
| CD4 | 0.48 | .03 | 0.46 | .52 |
| IL6 | 1.49 | .02 | 1.13 | .59 |
| OXER1 | 0.39 | .02 | −0.28 | .61 |
Visit fold change indicates comparison between baseline and day 7. Response fold change indicates comparison between patients with CR/PR vs NR at day 28. Boldface indicates set of genes that significantly increased from baseline to day 7 in patients with a CR or PR at day 28.
Cell-signaling pathways statistically significantly enriched in peripheral blood mononuclear cells of patients who achieved a CR or PR at day 28 on study
| Term | Odds ratio | Combined score | Adjusted P | Genes |
|---|---|---|---|---|
| ErbB1 (EGFR) downstream signaling | 76.19 | 1198.70 | <.001 | MAP2K4;MEF2C;RPS6KA5;STAT1 |
| IL-27–mediated signaling events | 153.85 | 1466.11 | .01 | STAT1;STAT2 |
| Trk receptor signaling mediated by the MAPK pathway | 117.65 | 1057.17 | .01 | MEF2C;RPS6KA5 |
| Signaling mediated by p38-α and p38-β | 105.26 | 922.25 | .01 | MEF2C;RPS6KA5 |
| RhoA signaling pathway | 88.89 | 748.53 | .01 | MAP2K4;ROCK2 |
| IL-6–mediated signaling events | 86.96 | 728.41 | .01 | MAP2K4;STAT1 |
| Signaling events mediated by focal adhesion kinase | 68.97 | 545.64 | .01 | MAP2K4;ROCK2 |
| CXCR4-mediated signaling events | 40.00 | 273.05 | .03 | STAT1;STAT2 |
| PDGFR-β signaling pathway | 31.25 | 198.05 | .04 | MAP2K4;STAT1 |
IL, interleukin; PDGFR-β, platelet-derived growth factor receptor-β.
Differentially expressed genes in peripheral blood mononuclear cells associated with day 28 response, irrespective of day of blood draw
| Gene | Response fold change | Adjusted P |
|---|---|---|
| BCL2L1 | 3.08 | .01 |
| MEF2C | 2.95 | .01 |
| PTGDR2 | 2.92 | <.001 |
| TLR9 | 2.65 | .01 |
| IL17A | 2.53 | <.001 |
| CCR3 | 2.39 | <.001 |
| IL7 | 2.27 | .01 |
| OAS2 | 2.23 | .03 |
| PTGER3 | 2.23 | .01 |
| HIF1A | −2.26 | .01 |
| DDIT3 | −2.30 | .01 |
| C1QA | −2.30 | .05 |
| CXCL1 | −2.33 | .03 |
| C2 | −2.67 | .01 |
| CXCL5 | −2.67 | .01 |
| IL10 | −2.74 | .02 |
| CXCL2 | −3.07 | .03 |
| IL8 | −3.20 | .03 |
| MMP9 | −3.24 | .02 |
| AREG | −3.61 | .01 |
AREG is significantly lower at end of study in responding patients
We assessed whether aGVHD biomarkers changed during study treatment. Neither ST2 (Figure 4A) nor REG3a (Figure 4B) significantly changed over time in responders. However, at study completion, patients with a day 28 CR/PR had a 4.6-fold reduction in plasma AREG from baseline (P = .006) (Figure 4C). ST2 trended higher at baseline in patients with NR vs CR/PR (P = .058), but there was no significant differences in baseline REG3a (P = .16) or AREG (P = .29) in day 28 responders vs nonresponders. The baseline plasma AREG/EGF ratio was more than sixfold higher in those with day 28 NR vs those with day 28 CR/PR (median 26.7 in NR vs 4.2 in CR/PR; P = .03).

GVHD biomarkers measured over time. Neither ST2 (A) nor REG3a (B) significantly changed over time compared with baseline in patients with a day 28 CR or PR to therapy. (C) However, AREG was significantly lower at day 56 compared with baseline in day 28 responders. Data are presented as mean ± SEM. *P < .05 compared with baseline.
GVHD biomarkers measured over time. Neither ST2 (A) nor REG3a (B) significantly changed over time compared with baseline in patients with a day 28 CR or PR to therapy. (C) However, AREG was significantly lower at day 56 compared with baseline in day 28 responders. Data are presented as mean ± SEM. *P < .05 compared with baseline.
Plasma butyrate is elevated in day 28 responders
We assessed whether plasma SCFA changed over time as a potential surrogate for dysbiosis and nutritional status. Although acetate and propionate had upward trajectories over time in responders, only plasma butyrate was significantly higher at day 28 (mean fold change, 2.1; P = .0014) (Figure 5A) and day 56 (mean fold change, 2.4; P = .018) compared with baseline. There was no clear pattern of change in SCFA over time in patients with NR (Figure 5B).
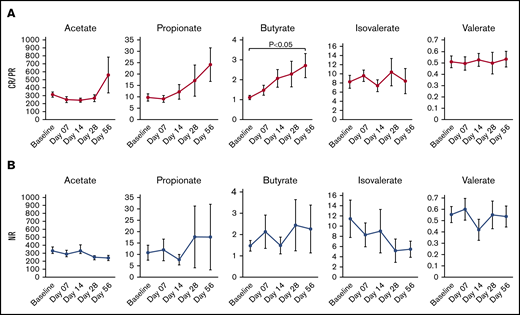
Plasma SCFA measured over time. (A, middle graph) Only butyrate increased in responders. (B) Plasma SCFA did not significantly increase or decrease over time in patients with no response. Data are presented as mean ± SEM (μmol/L).
Plasma SCFA measured over time. (A, middle graph) Only butyrate increased in responders. (B) Plasma SCFA did not significantly increase or decrease over time in patients with no response. Data are presented as mean ± SEM (μmol/L).
Discussion
In this phase 1 study, we observed that uhCG is a well-tolerated adjunct therapy in both high-risk and steroid-refractory aGVHD, associated with little toxicity and encouraging response rates. The mechanisms of benefit may include support of Tregs despite high-dose steroid exposure. In normal pregnancy, Tregs increase in number both at the fetomaternal interface and in the peripheral blood due to local and systemic increases in hCG.18 The capacity of hCG to modulate T cells toward a suppressive phenotype was first identified in the 1980s when putative Tregs were termed “suppressor T cells.”19 More recently, hCG has been described as inducing FoxP3 expression in CD4+ lymphocytes, converting them to Tregs through reduction of phosphorylation of AKT and ERK, necessary for Treg differentiation.19,20 HCG has been suggested as “nature’s own antirejection agent” based on the immunobiology of maternal/fetal tolerance and preclinical studies showing prolonged allograft survival in rodent organ rejection models.21 Thus, one of the therapeutic effects of uhCG in this study is immune modulation. Notably, the majority of patients in this study were male, making it premature to determine any sex-specific effect of this adjunct therapy.
Notably, we selected uhCG for testing in this phase 1 study (as opposed to recombinant hCG0) due to the additional growth factors that could aid in tissue repair. A theoretical advantage of uhCG over recombinant hCG use in the aGVHD setting is potentially enhanced tissue repair by supplementation of exogenous EGF.22 In preclinical models of intestinal damage, supplemental EGF has been shown to enhance gut epithelial restitution after radiation injury23 and protect against the development of colitis.24 Furthermore, EGF treatment of inflamed colonic mucosa can improve ion transport capabilities, especially sodium reabsorption,25 thus potentially limiting diarrheal morbidity.
Because pharmaceutical grade recombinant EGF was not available for clinical testing, we sought to identify alternate sources of EGF. Serendipitously, in our previous studies of the immune and growth factor milieu of early pregnancy, we found that EGF levels are ∼20-fold elevated during the first trimester of pregnancy.26 This finding led us to identify that a high concentration of EGF is present in commercial uhCG preparations.22 We observed a spike in plasma EGF at 6 hours postdose only in our first-line cohort. No such spike was observed in circulating EGF in our second-line cohort. This observation led us to the hypothesis that EGF may be rapidly taken up into immune cells and tissues and not remain free for circulation when damage is more extensive. For example, Tregs are known to express the EGF receptor under inflammatory conditions.27 Circulating EGF may thus bind its receptor and be rapidly internalized according to this hypothesis. Based on our clinical trial results, we are proceeding with a phase 2 study in which the high-risk first-line cohort continues to receive a uhCG dose of 2000 IU/m2 , while we are testing 2 higher dose levels (uhCG 3500 IU/m2 and 5000 IU/m2) in the second-line cohort to determine if we are at least transiently able to show an increase in circulating EGF with higher doses.
The rationale for our approach stems both from our interest in the immunobiology of pregnancy and from our previous studies identifying differences in circulating tissue repair factors from patients at the onset of grade 3/4 aGVHD. We first observed that in steroid-refractory aGVHD, EGF levels were extremely low, often down to an undetectable level, at day 28 after aGVHD onset.28 We then expanded our investigation into tissue repair factors in aGVHD to include AREG, an EGF family member with weaker affinity for EGF receptor. We found that AREG was threefold elevated at the onset of aGVHD, and an elevated AREG/EGF ratio at the onset of aGVHD was associated with a more than ninefold increased risk of death.29 These data provided support for our hypothesis that an imbalance of EGF ligands is clinically relevant in life-threatening aGVHD. Our present study confirms that a markedly elevated AREG/EGF ratio at the start of therapy is associated with a lower likelihood of response, as we observed a more than sixfold higher AREG/EGF ratio in those with day 28 NR vs those with day 28 CR/PR in this cohort.
Additional biomarker studies incorporated into this phase 1 clinical trial indicate that AREG may serve as a valuable biomarker to monitor responses in aGVHD. Assessing clinical response in severe aGVHD can be challenging considering the dietary changes, medication side effects, and infections that can confound a clear delineation of response. We have previously shown that patients with a circulating AREG of ≥33 pg/mL at the onset of aGVHD have an increased risk of NRM.30 Responders in this study took 2 months to show a significant reduction in AREG below that high-risk threshold (median of 26.7 pg/mL at day 56). Although we observed no statistically significant changes in ST2 or REG3a in response to therapy during this study window, these biomarkers might be informative at later time points. Further studies to confirm the utility of monitoring response with any of these biomarkers in aGVHD will be necessary.
We also analyzed SCFA as a potential surrogate for nutritional status and dysbiosis accompanying aGVHD in this study. Mechanistically, preclinical models have shown that microbiota-derived butyrate modulates aGVHD activity in part through histone deacetylase inhibition, in addition to providing an energy source for enterocytes.31 We observed a significant elevation in plasma butyrate in day 28 responders. The strength of our analysis is serial examination of SCFA over time in this well-defined cohort, and the more than twofold elevation in circulating butyrate in responding patients is encouragingly suggestive of a meaningful biological response. Direct examination of fecal microbiota or results of repeat tissue biopsies may be informative to confirm improvements in dysbiosis or in colonic epithelial function.
There are no previous dose-finding studies to support the use of uhCG as supportive care of severe aGVHD. However, in 2014, a German study led by Elmagaacli reported on the use of a similar urinary-derived pregnancy hormone supplement in steroid-refractory chronic GVHD, and observed improved organ damage without significant toxicity in 12 of 20 (60%) patients.32 With ever-rising costs of medical care, including costs of managing HCT toxicities, it is practical to consider repurposing existing drugs such as uhCG as a novel but accessible supportive care approach as undertaken in this study. The HCT community is in ongoing need of readily available, effective, low-toxicity, cost-conscious supportive care for life-threatening aGVHD. The April 2019 retail price of uhCG averaged $296.25/10 000 IU and thus may be able to contribute favorably to that need.33
In conclusion, our study of uhCG as supportive care of life-threatening aGVHD will continue in phase 2, where we can more concretely estimate the response rates and magnitude of clinical benefit; the encouraging response rates we observed, however, suggest promise for this approach. This adjunct therapy is directly translatable to clinical use. uhCG is commercially available and absorption straightforward to monitor using quantitative serum hCG measurements performed in clinical laboratories. The potential of uhCG to address the morbidity of aGVHD in this new way (enhancement of immune tolerance and tissue repair) may underscore its promise.
Individuals may request original data by e-mailing the corresponding author; reasonable requests will be considered (Shernan G. Holtan; e-mail: sgholtan@umn.edu).
Acknowledgments
The authors thank Michael Ehrhardt in the Cytokine Reference Laboratory at the University of Minnesota for completing the cytokine and growth factor analyses and Julie Curtsinger in the Translational Cell Therapy Laboratory for supervising the flow cytometry studies.
This study was funded by the BMT Fund for the Future (S.G.H.), a Regenerative Medicine Minnesota clinical trial award (S.G.H.), and National Institutes of Health, National Heart, Lung, and Blood Institute grants R01 HL11879 and R01 HL56067 and National Institute of Allergy and Infectious Diseases grant R37 AI34495 (B.R.B.). S.G.H. is a University of Minnesota Women’s Early Research Career award recipient and conducted this study during her time as a Women’s Early Research Career scholar.
Authorship
Contribution: S.G.H. developed and conducted the study, analyzed data, and wrote the paper; A.L.H. recorded and analyzed patient data; Q.C., A.S., and J.W. analyzed data; M.A., V.B., C.G.B., J.S.M., A.R., A.S., C.U., G.M.V., E.D.W., B.C.B., N.E.J., F.H., J.E.W., B.R.B., M.L.M., and D.J.W. interpreted the data and edited the paper; and C.C., I.G., P.A.J., and A.P.-M. analyzed laboratory specimens, interpreted the data, and edited the paper.
Conflict-of-interest disclosure: S.G.H. has provided consulting services for Incyte, Bristol-Myers Squibb, Janssen, and CSL Behring. B.R.B. receives remuneration as an advisor to Kadmon Pharmaceuticals, Inc., Five Prime Therapeutics Inc., Regeneron Pharmaceuticals, Magenta Therapeutics, and BlueRock Therapeutics; consulting services for Bristol-Myers Squibb, Incyte, Equillium, Regimmune, Dr. Reddy, GT Biopharma, and Incyte Corp; research support from Fate Therapeutics, RXi Pharmaceuticals, Alpine Immune Sciences, Inc., AbbVie Inc., the Leukemia and Lymphoma Society, Children’s Cancer Research Fund, and Kids First Fund; and is a cofounder of Tmunity. The remaining authors declare no competing financial interests.
Correspondence: Shernan G. Holtan, University of Minnesota, 420 Delaware St SE, Mayo Mail Code 480, Minneapolis, MN 55455; e-mail: sgholtan@umn.edu.

