

Key Points
EGFL7 is expressed in patients with MM, enhancing myeloma proliferation through beta3 integrin.
Blockade of the EGFL7-ITGB3 axis in combination with BTZ improves MM growth control.

Abstract
Angiogenic factors play a key role in multiple myeloma (MM) growth, relapse, and drug resistance. Here we show that malignant plasma cells (cell lines and patient-derived MM cells) express angiocrine factor EGF like-7 (EGFL7) mRNA and protein. MM cells both produced EGFL7 and expressed the functional EGFL7 receptor integrin β 3 (ITGB3), resulting in ITGB3 phosphorylation and focal adhesion kinase activation. Overexpression of ITGB3 or EGFL7 enhanced MM cell adhesion and proliferation. Intriguingly, ITGB3 overexpression upregulated the transcription factor Krüppel-like factor 2 (KLF2), which further enhanced EGFL7 transcription in MM cells, thereby establishing an EGFL7-ITGB3-KLF2-EGFL7 amplification loop that supports MM cell survival and proliferation. EGFL7 expression was found in certain plasma cells of patients with refractory MM and of patients at primary diagnosis. NOD.CB17-Prkdc<scid>/J mice transplanted with MM cells showed elevated human plasma EGFL7 levels. EGFL7 knockdown in patient-derived MM cells and treatment with neutralizing antibodies against EGFL7 inhibited MM cell growth in vitro and in vivo. We demonstrate that the standard-of-care MM drug bortezomib upregulates EGFL7, ITGB3, and KLF2 expression in MM cells. Inhibition of EGFL7 signaling in synergy with BTZ may provide a novel strategy for inhibiting MM cell proliferation.
Introduction
Multiple myeloma (MM) is a malignant disease characterized by the proliferation of clonal plasma cells within the bone marrow (BM) and is still considered incurable despite the advent of next-generation proteasome inhibitors such as bortezomib (BTZ).1-3 The majority of patients relapse or become refractory to therapies, implying that drug resistance prevents effective treatment of MM.
The crosstalk between MM plasma cells and the BM microenvironment is responsible for drug resistance in MM. The formation of new vessels, a process known as angiogenesis, is part of the microenvironment and responsible for myeloma progression. Normal plasma cells express a surplus of pro-angiogenic over anti-angiogenic genes, which in malignant plasma cells (MM cells) is further aggravated by aberrant expression of pro-angiogenic and downregulation of anti-angiogenic genes.4
BTZ exerts direct cytotoxicity on MM plasma cells by blocking proteasome activity, ultimately causing MM cell apoptosis.5 BTZ can downregulate the expression of angiogenesis-promoting factors (angiocrine factors) such as vascular endothelial growth factor, interleukin-6, or angiopoietin-1/-2 by MM plasma and BM stromal cells.6
The angiogenic factor (angiogenesis-promoting factor) epidermal growth factor like protein-7 (EGFL7) promotes endothelial cell survival, migration, and differentiation.7,8 EGFL7 is dysregulated frequently in several types of solid cancers and acute myeloid leukemia.9,10 Laganà et al reported high EGFL7 expression in 2 of the newly identified disease clusters established after the analysis of molecular and patient data from 450 patients with newly diagnosed MM: the MM SET domain MMSET (enriched for translocations of MMSET) cluster and the IMM (Immune, characterized by upregulation of the human cyclin D2 gene and several genes from the S100 cancer testis antigen family) cluster.11
Integrin-mediated cellular adhesion is a way MM cells can escape drug treatment. Aside from other integrins,12 MM drug resistance has been shown to be partially a result of mutations in the integrin β 3 (ITGB3) pathway.13,14 ITGB3 enhances MM cell proliferation, protease secretion, invasion, and spreading.15-17 EGFL7 can bind to ITGB3 and Notch receptors.18,19
Here we demonstrate that EGFL7 promotes MM growth through ITGB3 and KLF2. MM cells upregulate these factors on treatment with the anti-MM drug BTZ. Strategies that target EGFL7 in combination with BTZ nearly completely abolished MM cell growth in vitro and in vivo, which seem to be an ideal combination to control MM growth.
Materials and methods
Cell lines and primary cells
The human RPMI8226, MM.1S, HS-5, HL-60, HEL, U266, H929, and KMS11 cell lines were cultured in RPMI 1640 medium (4500 mg/L glucose; Wako, Japan) containing 10% fetal bovine serum and 1% penicillin/streptomycin. HS-5 cells (from American Type Culture Collection) were cultured in Dulbecco’s modified Eagle medium (high glucose; Wako, Japan) containing 10% fetal bovine serum and 1% penicillin/streptomycin (Nacalai Tesque Inc). Human bone marrow endothelial cells (BMEC-1) were maintained in Medium 199 supplemented with 10% fetal bovine serum, 0.146 mg/mL l-glutamine, and 2.2 mg/mL sodium bicarbonate (Sigma Aldrich). Human umbilical cord endothelial cells (HUVECs; Lonza; Basel, Switzerland) were cultured in EBM-2 medium according to the instructions of the manufacturer.
Primary MM patient samples
All patients with MM and healthy donors provided written informed consent before BM sample collection. The study protocols were in accordance with the Declaration of Helsinki and were approved by the institutional review board at the Institute of Medical Science, the University of Tokyo. For patient details see supplemental Figure 1. Human BM-derived CD138+ MM cells were purified using anti-CD138 magnetic microbeads (Miltenyi Biotec).
Magnetic bead isolation
After centrifugation through a Ficoll gradient, BM mononuclear cells were stained using the anti-human CD138 magnetic-activated cell sorting (MACS) beads (Miltenyi Biotec). After MACS cell separation (Milteny Biotec), cells were stained with CD138 antibody (Ab; BD Pharmingen) and were then analyzed by fluorescence-activated cell sorting (FACS). Cell purity after MACS isolation was higher than 95%.
Endothelial-MM cell cocultures
EGFL7 knockdown (KD) in HUVECs was achieved using small interfering RNA (siRNA), whereas EGFL7 overexpression (OE; green fluorescence protein [GFP]+) was performed using adenovirus-expressing human full-length EGFL7. RPMI8226 cells (GFP−) were added to the adherent HUVEC cells and cultured in RPMI 1640 medium for 24 hours.
Drugs and Abs
RPMI8226 cells were treated with dimethyl sulfoxide (carrier for BTZ) at 1.29% (Sigma Aldrich), BTZ at 0 to 20 nM (Cell Signaling Technology), the ITGB3 inhibitor Cilengitide at 20 μM (Selleckchem), the Akt1/2 inhibitor MK-2206 2HCL (Selleneck), or the anti-EGFL7 Ab at a concentration of 10 μg/mL (Genentech Inc., San Francisco, CA).
Proliferation
If not otherwise indicated, cell proliferation was determined by counting viable cells after Trypan blue exclusion. For indicated experiments, cells were treated and viability assessed using the cell counting kit 8 (Sigma Aldrich) according to the manufacturer’s protocol.
Drug effect determination using fractional inhibitory concentration
Fractional inhibitory concentration (FIC) of agent A equals the minimal inhibitory concentration (MIC) of agent A in combination/MIC of agent A alone, and FIC of agent B equals the MIC of agent B in combination/MIC of agent B alone. FIC index is the summation of the individual FICs of the drugs analyzed. If the FIC index is ≤0.5, then there is a synergistic effect; if the FIC index is between 0.5 and 1, then the effect is additive; an FIC index range of 1 to 4 is said to be indifferent; and an FIC index value above 4 is tagged as an antagonistic effect.
The following terms and definitions are adopted here: indifferent means neither drug contributes to the action of the other; additive means a combination of individually subeffective concentrations is effective, but one of these is not much lower (one half in the usual series) than that effective alone; synergic means a combination of concentrations is effective that is much lower than those required when acting alone; and antagonistic means the presence of a second drug reduces the activity of the other.
RPMI8226 cell incubation
Human RPMI8226 (1 × 10⁵ cells/mL per well) were cultured in the presence of BTZ if not otherwise indicated, at a concentration of 10 nM for 24 hours.
Caspase 3/7 activity assay
Caspase activity was detected using the Caspase-Glo 3/7 assay kit (Proemga, Japan), as recommended by the manufacturer.
Quantitative reverse transcription polymerase chain reaction analysis
Total RNA was extracted by TRIzol (Invitrogen). First-strand cDNA was synthesized from 0.2 to 2 μg of total RNA, using a High Capacity Reverse Transcriptase kit (Applied Biosystems). The cycle number for polymerase chain reaction (PCR) was 40 for all samples, using a quantitative PCR machine (Step One Plus; Applied Biosystems) with SYBR Premix Ex Taq II (×2) Tli RNaseH Plus (Takara, #RR820). The human primers were ordered from FASMAC, Kanagawa, Japan. The respective forward and reverse primers used for reverse transcription PCR (RT-PCR) were as follows: hEGFL7 forward: 5′-GCACAGAGCACGCCTACC-3′, reverse: 5′-GGTACACACACGCTGCACGA-3′; hITGB3 forward: 5′- CGCTAAATTTGAGGAAGAACG-3′, reverse: 5′-GAAGGTAGACGT GGCCTCTTT-3′; hACTB forward: 5′-GACGACATGGAGAAAATCTG-3′, reverse: 5′-AGGTCTCAAACATGATCTGG-3′; huKLF2 forward: 5′-CATCTGAAGGCGCATCTG-3′, reverse: 5′-CGTGTGCTTTCGGTAGTGG-3′; mEgfl7 forward: 5′-GCGCTGCCTGTCTAAGGA-3′, reverse: 5′-CCTCTCTCGCCATGCTGT-3′.
Adenovirus EGFL7 delRGD generation and expansion
The generation and expansion of adenoviral vectors expressing an arginine-glycine-aspartic acid (RGD) deletion form of EGFL7 and adenovirus containing no transgene (Mock) were recently reported.20,21
Cell culture and transfection
MM cells (2 × 10⁵) were seeded in 24-well plates for 24 hours. MM cells were transiently transfected by using Lipofectamine RNAiMAX (Invitrogen). siRNA targeting sequences were designed using BLOCK-iT RNAi Designer (Invitrogen): si-ITGB3: 5′-CCAAGACTCATATAGCATT-3′; si-KLF2: 5′-GCACATGAAACGGCACATG-3′; si-CTRL: 5′-GCAGTAACAGGACCCAATG-3′.
Cloning of the following target sequences into CS-Ubc-GFP vector
Short hairpin RNAs (shRNAs) were designed using BLOCK-iT RNAi Designer.
shRNAs targeting human EGFL7 (Fasmac) were EGFL7 shRNA-5′-CACCGCTTGTGGAGCAGCAATATGCCGAAGCATATTGCTGCTCCACAAGC-3′ and bottom strand: EGFL7shRNA-5′-AAAAGCTTGTGGAGCAGCAATATGCTTCGGCATATTGCTGCTCCACAAGC-3′ top: strand-scramble-5′-CACCGGAGACGGAGGATAGTCTTCGAAAAGACTATCCTCCGTCTCC-3′; bottom: strand-scramble-5′-AAAAGGAGACGGAGGATAGTCTTTTCGAAGACTATCCTCCGTCTCC-3′.
We used the following cloning sequences for ITGB3 OE of the following genes: human ITGB3: ITGB3 XhoI-ITGB3-F, CTCGAGGCGGACGAGATGCGAGCGCGGCCGCGGCCCCGGCCGCTCT; EcoRV-hITGB3-R, GATATCTTAAGTGCCCCGGTACGTGATATTGGTGAAGGTAGACGT; and human KLF2 cloning: hKLF2 hKLF2-XhoI, CTCGAGGTCCCGGCCATGGCGCTGAGTGAACCCA; hKLF2-ECORV, GATATCCTACATGTGCCGTTTCATGTGCAGC.
Lentiviral production
EGFL7 shRNAs were designed using the webpage http://sirna.wi.mit.edu/home.php. The packaging construct pMDLg/pRRE lacking the vif, vpr, vpu, and nef accessory and the tat and rev regulatory genes were used. According to a modified protocol, the lentiviral vectors pseudotyped with the vesicular stomatitis virus G glycoprotein were generated.22 Briefly, 293T cells were transfected with 4 plasmids: the packaging construct (pMDLg/pRRE), the vesicular stomatitis virus G glycoprotein-expressing construct (pMD.G), the Rev-expressing construct (pRSV-Rev), and the CS-Ubc-GFP construct. Vector supernatants were concentrated by 2 rounds of ultracentrifugation. Pellets were resuspended in Dulbecco’s modified Eagle medium (1/500 of the initial volume of supernatant). Vector titers were determined by infection of 293T cells with serial dilutions of the vector stocks, followed by FACS analysis for GFP.
FACS
Cell apoptosis was determined using a fluorescein isothiocyanate (FITC) Annexin V apoptosis detection kit (BD Pharmingen), following the maker’s instructions. RPMI8226 cells were stained with CD61-FITC (clone VI-PL2, BD Biosciences). Surface gene expression analysis indicated that murine MM cells were detected after the staining with the murine Ab against CD138 (APC; Biolegend) or B220 (PE; BD Pharmingen). Dead cell exclusion using propidium iodide. Analyses were performed on an LSRII (Becton Dickinson) flow cytometer and data were analyzed using FlowJo (Tree Star) software.
Western blotting
Cell lysates (2-50 µg proteins) were applied on a 12% acrylamide gel, transferred to PVDF membrane (Millipore, Immobilon), and probed with one of the following primary Abs (all mouse immunoglobulin G [IgG], 1 µg/mL) overnight at 4°C: EGFL7 (Santa Cruz Biotech, sc-34416), β-ACTIN (Cell Signaling, #4967), p-AKT (Cell Signaling, #2965), Bax (Cell Signaling, #2772), KLF2 (Abcam, ab203591), p-Integrin B3 (Tyr747; Santa Cruz Biotech, sc-20234), and Focal adhesion kinase (FAK; Bioss, bs-1340R). Membranes were stained with secondary Ab conjugated with horseradish peroxidase (Nichirei, rabbit-HRP, or goat-HRP), and developed with the ECL Plus detection system (Amersham Life Science, RPN2132), using image analyzer ImageQuant LAS4000 (GE Healthcare, Uppsala, Sweden). Band intensity was analyzed using the ImageJ program.
Adhesion assay
Preparation of decellularized, EGFL7-coated plates: HEK293 were infected with adenovirus expressing the full form of EGFL7 (AdEGFL7), the RGD deletion form of EGFL7 (AdRGD del), or an empty vector (AdNull). Cells were trypsinized, leaving behind deposited EGFL7 protein variants on the dishes after 16 hours. Aliquots (100 µL) of 100 mM NaHCO3 at pH 9.6 (carbonate buffer), containing fibronectin (FN; 10 µg/mL), for 1 hour, or recombinant (rec.) human EGFL7 (2 µg/mL) were added to 96-well polystyrene microtiter plates. Cells were fixed with 4% formaldehyde in phosphate-buffered saline (PBS) for 10 minutes, followed by a washing step using 0.1% bovine serum albumin/Dulbecco’s modified Eagle medium buffer. Adherent cells were stained with 0.5% crystal violet for 10 minutes and washed with tap water. Next, 2% sodium dodecyl sulfate was added to dried plates. The plate was incubated at room temperature for 30 minutes, and the absorbance was detected at 550 nm, using a microplate reader (Molecular Devices).
In another set of experiments, EGFL7 OE or EGFL7 KD BMEC1 cells were cultured with GFP+ RPMI cells for 4 hours. Nonadherent cells were washed with PBS. Adherent cells were trypsinized and counted. GFP positivity was determined by FACS in the adherent cells.
In vivo murine MM models
Mice.
Ten- to 14-week-old NOD.CB17-Prkdc<scid>/J (abbreviated NOD/SCID) and C57BL/6J mice were purchased from Japan SLC Inc. (Hamamatsu, Japan). Animal procedures were approved by the institutional animal care and use committee of the Institute of Medical Science, the University of Tokyo.
RPMI8226 xenograft model.
Naive or transfected RPMI8226 cells (1 × 10⁷/mouse; >90% viability) were inoculated subcutaneously (s.c.) in NOD/SCID mice.23 In some experiments, MM cell-inoculated mice were injected intraperitoneally twice a week at a concentration of 0.25 mg/kg of BTZ starting from day 25 (when a visible tumor had developed). Mouse tumor size was measured externally before treatment started, and mice were randomly assigned into the different treatment or control groups according to tumor size. Extracted tumors were weighed on day 53 for the experiments on wild-type RPMI8226 cells. In another set of experiments, mice treated with or without BTZ were euthanized on day 3.
Anti-EGFL7 treatment of RPMI8226/MM-bearing mice.
Anti-EGFL7 Abs were generated as previously described.24,25 Humanized neutralizing EGFL7 Ab (clone h18F7: against mouse and human EGFL7; kindly provided by Genentech Inc.) or control Ab (human IgG1) treatment started when mice injected s.c. with RPMI8226 cells showed tumors (from day 25). Abs were injected every other day at a concentration of 1 mg/kg body weight. Ab treatment was started 25 days after tumor cell inoculation. Mice were euthanized on day 53, and tumor weight was determined.
Vk*MYC mouse model.
BM and splenocytes were harvested from Vk*MYC mice. Cells were pooled and run over a density gradient (Cat. No. CL5031, Cederlane). The buffy coat after centrifugation was collected. Mononuclear cells were washed once with PBS. A total of 2.5 × 10⁵ (pre-MACS sorted 100% positive Vk*MYC MM cells) or 5 × 10⁷ BM cells (unsorted BM and spleen cells with a MM cell content of around 30%) were injected into C57BL/6J mice via tail vein injection (see also Parker et al24 ). These mice transplanted with VK*MYC cells are called VK*MYC mice in the manuscript. Controls were C57BL/6J mice that did not receive tumor cells. Mice were harvested 25 days after cell injection, and BM and spleen cell suspensions were analyzed for tumor cell infiltration, using mouse anti-CD138 Abs. For some experiments, CD31+ cells were isolated from mouse BM cells by MACS and were subjected to further analysis. In another set of experiments, 9 days after Vk*MYC cell injection, mice were treated with BTZ (0.25 mg/kg; 7.5 μg/mouse per injection) twice a week in combination with either anti-EGFL7 (m18F7; kindly provided by Genentech) at a concentration of 1 mg/kg 3 times per week intraperitoneally or a carrier/PBS control.
Enzyme-linked immunosorbent assay.
Human EGFL7 was measured in murine plasma samples, using an enzyme-linked immunosorbent assay kit (R&D Systems).
Cell and tissue staining.
RPMI8226 cells were fixed in ice-cold methanol for 10 minutes. Cells were incubated overnight with EGFL7 primary Ab (rabbit anti-Goat; Santa Cruz Biotech, sc-34416) at 4°C. An anti-goat-FITC–labeled Ab for detection was applied. Immunohistochemical staining for EGFL7 on human patient BM sections was performed using the EGFL7 polyclonal Ab (cat# 19291-1-AP; Proteintech) followed by 4′,6-diamidino-2-phenylindole development and hematoxylin counterstaining. All tissue sections and cytospin preparations were analyzed after staining, using an upright fluorescence microscope (Olympus Optical Co. Ltd, UK).
Statistical analysis.
Experiments were performed at least 3 times. Data are shown as the mean ± standard error of the mean (SEM). Statistics were performed using GraphPad Prism 5 software. Multiple groups were compared using 1-way analysis of variance software followed by Bonferroni post hoc test, and analysis of the 2 groups was performed using the Student t test. P < .05 was considered statistically significant.
Results
EGFL7 can control myeloma cell survival
The endogenous expression of EGFL7 was determined in human MM cell lines, total bone marrow mononuclear cells (BMNCs), and primary BMNCs of healthy donors and patients with myeloma (patient #1 and patient #2 with MM stage I/II at primary diagnosis without treatment and patient #3 with MM stage III, refractory to BTZ). Similar to a previous report,4 normal MACS-isolated BM CD138+ cells and the human RPMI8226, U-266, and MM.1S MM cell lines known to carry the deregulated CCND2 gene expressed a higher EGFL7 level when compared with BMNCs and BM CD138− cells or the myeloblastic leukemic cell line HL60, whereas the cell lines KMS11 and H929, which hold the human MM SET domain (MMSET) translocation expressed lower levels of EGFL7 when compared with the expression in normal human CD138− cells, human BMNCs, or HL60 (Figure 1A-D). Endothelial cells (ECs) support MM cell growth. ECs, such as the HUVECs and the human bone marrow endothelial cells (BMEC1), highly expressed EGFL7, as did the megakaryocytic HEL cells when compared with leukemic HL60 cells. Low expression was found in the human HS-5 stromal cells when compared with HL60 cells (Figure 1A). Immunostaining confirmed EGFL7 protein expression in RPMP8226 cells (Figure 1C).

EGFL7 is a survival factor in myeloma cells (A) Fold change in EGFL7 gene expression of the human stromal cell line HS-5 and the MM cell lines U-266, RPMI8226, (abbreviated RPMI), MM.1S, H929, and KMS11, as determined by RT-PCR when compared with the EGFL7 expression in the human myeloid leukemia HL60 cells. (B) A representative western blot is shown for EGFL7, with b-ACTIN as a control, in tumor lysates from mice injected with indicated RPMI cells. (C) Representative images of RPMI8226 cells stained for EGFL7 (green fluorescence) and 4′,6-diamidino-2-phenylindole (DAPI; blue nuclear staining) by immunofluorescent staining. (D) Fold change in EGFL7 gene expression of MACS-isolated CD138+ cells from normal donors when compared with the EGFL7 expression in CD138− cells. (E) Fold change in EGFL7 gene expression as determined by RT-PCR in human cell samples of patients with MM (patients #1 and #2 MM patient sample at diagnosis and patient #3 MM patient sample at refractory stage of the disease; for more clinical details, see supplemental Figure 1) when compared with EGFL7 gene expression found in human BMMCs of healthy donors (n = 3/condition). (F) Western blot analysis of EGFL7 and b-ACTIN as a control in indicated cell population from healthy volunteers and patients with MM. (Upper) Band quantification using the ImageJ program. (Lower) Representative western blots of the same samples. (G-H) EGFL7 (EGFL OE), EGFL7 knockdown (KD), or Mock MM cells (RPMI8226, MM.1S, and U-266) were generated. (G) Fold change in EGFL7 gene expression when compared with Mock cells, as determined by RT-PCR (n = 3/condition). (H) Cells were counted 24 hours after cell seeding after trypan blue exclusion (n = 6/group). (I-J) RPMI8226 cells (OE, KD, Mock) were stained with Annexin V-FITC and PI and analyzed 48 hours after cell plating by FACS. (I) A representative FACS blot is shown for each condition (n = 6/group). (J) Percentage of Annexin V+ and PI− cells (as a measure of early and late apoptosis) by FACS after 48 hours (n = 3/group). (K) Representative western blot analysis of the expression of phosphorylated AKT, BAX, and b-ACTIN (control) in cell lysates of Mock, EGFL7 OE, and EGFL7 KD RPMI8226 cells. (L) Fold change in caspase 3/7 activity of EGFL7 OE or KD cells when compared with Mock RPMI8226 cells 48 hours after cell plating, as determined by Versa Max (n = 6/condition). (M-N) EGFL7 OE and wild-type (RPMI) cells were treated with various concentrations of the AKT1/2 inhibitor. (M) Proliferation was determined using the CCK-8 kit after 24 hours in culture. % Absorbance indicates the rate of viable cells (n = 6/condition). (N) Fold increase in EGFL7 expression after AKT1/2 inhibitor treatment when compared with EGFL7 expression in nontreated cells. (O-P) MM cells were cocultured with a confluent layer of GFPpos-EGFL7 Mock, EGFL7 OE, or EGFL7 KD ECs in direct contact, and the percentage of GFP-MM cells was determined after 24 hours of coculture (n = 3/condition). (O) Percentage of GFP− MM cells in the adherent fraction. (P) Absolute number of nonadherent suspension cells retrieved from the cocultures. As for RT-PCR data, transcripts were normalized to b-ACTIN. Graphs represent averages from 3 independently prepared templates per condition. Experiments were repeated twice with similar results. Data are represented as mean ± SEM. * P ≤ .05; ** P ≤ .01; *** P ≤ .001. P values were determined using a Student t test.
EGFL7 is a survival factor in myeloma cells (A) Fold change in EGFL7 gene expression of the human stromal cell line HS-5 and the MM cell lines U-266, RPMI8226, (abbreviated RPMI), MM.1S, H929, and KMS11, as determined by RT-PCR when compared with the EGFL7 expression in the human myeloid leukemia HL60 cells. (B) A representative western blot is shown for EGFL7, with b-ACTIN as a control, in tumor lysates from mice injected with indicated RPMI cells. (C) Representative images of RPMI8226 cells stained for EGFL7 (green fluorescence) and 4′,6-diamidino-2-phenylindole (DAPI; blue nuclear staining) by immunofluorescent staining. (D) Fold change in EGFL7 gene expression of MACS-isolated CD138+ cells from normal donors when compared with the EGFL7 expression in CD138− cells. (E) Fold change in EGFL7 gene expression as determined by RT-PCR in human cell samples of patients with MM (patients #1 and #2 MM patient sample at diagnosis and patient #3 MM patient sample at refractory stage of the disease; for more clinical details, see supplemental Figure 1) when compared with EGFL7 gene expression found in human BMMCs of healthy donors (n = 3/condition). (F) Western blot analysis of EGFL7 and b-ACTIN as a control in indicated cell population from healthy volunteers and patients with MM. (Upper) Band quantification using the ImageJ program. (Lower) Representative western blots of the same samples. (G-H) EGFL7 (EGFL OE), EGFL7 knockdown (KD), or Mock MM cells (RPMI8226, MM.1S, and U-266) were generated. (G) Fold change in EGFL7 gene expression when compared with Mock cells, as determined by RT-PCR (n = 3/condition). (H) Cells were counted 24 hours after cell seeding after trypan blue exclusion (n = 6/group). (I-J) RPMI8226 cells (OE, KD, Mock) were stained with Annexin V-FITC and PI and analyzed 48 hours after cell plating by FACS. (I) A representative FACS blot is shown for each condition (n = 6/group). (J) Percentage of Annexin V+ and PI− cells (as a measure of early and late apoptosis) by FACS after 48 hours (n = 3/group). (K) Representative western blot analysis of the expression of phosphorylated AKT, BAX, and b-ACTIN (control) in cell lysates of Mock, EGFL7 OE, and EGFL7 KD RPMI8226 cells. (L) Fold change in caspase 3/7 activity of EGFL7 OE or KD cells when compared with Mock RPMI8226 cells 48 hours after cell plating, as determined by Versa Max (n = 6/condition). (M-N) EGFL7 OE and wild-type (RPMI) cells were treated with various concentrations of the AKT1/2 inhibitor. (M) Proliferation was determined using the CCK-8 kit after 24 hours in culture. % Absorbance indicates the rate of viable cells (n = 6/condition). (N) Fold increase in EGFL7 expression after AKT1/2 inhibitor treatment when compared with EGFL7 expression in nontreated cells. (O-P) MM cells were cocultured with a confluent layer of GFPpos-EGFL7 Mock, EGFL7 OE, or EGFL7 KD ECs in direct contact, and the percentage of GFP-MM cells was determined after 24 hours of coculture (n = 3/condition). (O) Percentage of GFP− MM cells in the adherent fraction. (P) Absolute number of nonadherent suspension cells retrieved from the cocultures. As for RT-PCR data, transcripts were normalized to b-ACTIN. Graphs represent averages from 3 independently prepared templates per condition. Experiments were repeated twice with similar results. Data are represented as mean ± SEM. * P ≤ .05; ** P ≤ .01; *** P ≤ .001. P values were determined using a Student t test.
In contrast to the low expression of EGFL7 in MM cell lines (RPMI8226 cells were the only exception), CD138+ derived from patients with MM at stage 1/II of the disease and from a patient with MM at the refractory stage of the disease (patient #3) showed higher EGFL7 expression when compared with the total patient BMNCs on both the mRNA and protein levels (Figure 1E-F). These data suggested that EGFL7 is highly expressed in the CD138+ BM fraction of healthy donors, patients with MM at primary diagnosis, or refractory disease, as it was in MM cell line RPMI8226.
Although EGFL7 protein is detectable at varying protein levels in the MM cell lines U-266, RPMI8226, and MM.1S cells, we examined MM cell proliferation after EGFL7 KD or overexpression (Figure 1G-H). KD cells were generated using small hairpin RNA (shRNA; EGFL7 KD cells) or using control shRNA containing a GFP reporter gene (Mock cells). EGFL7 OE was achieved using a lentiviral construct containing the human EGFL7 and the GFP gene. EGFL7 KD or OE was confirmed in generated cells by RT-PCR (Figure 1G). EGFL7 OE enhanced, whereas EGFL7 KD inhibited, MM cell growth (Figure 1H). Increased cell debris was evident in Wright Giemsa–stained EGFL7 KD cells (data not shown) and prompted us to determine apoptosis in the RPMI8226 cell line (Figure 1I-J). Annexin V staining revealed decreases in the percentage of early Annexin V+ PI– and late Annexin V+PI+-apoptotic RPMI8226 EGFL7 OE cells and an increase in viable cells (71.3% of Annexin V−PI− cells), as determined by FACS (Figure 1I-J). In agreement, an increase in early and late apoptosis was induced in EGFL7 KD cells (Figure 1I-1J). The majority of Mock cells (61%) were viable and nonapoptotic (Annexin V−PI−). EGFL7 KD cells highly expressed the proapoptotic protein BAX1. Cells showed impaired phosphorylation of the survival-associated protein AKT (Figure 1K). Caspase 3 is known to act downstream of BAX/BCL-2 and enhances apoptosis. Correspondingly, Caspase 3 and Caspase 7 activity were increased compared with Mock controls in EGFL7 KD cells (Figure 1L). These results indicate that EGFL7 promotes MM cell survival and prevents MM cell apoptosis.
Selective AKT inhibition suppresses MM cell growth.26 We assessed cell proliferation in EGFL7 OE and KD cells after treatment with the AKT1/2 inhibitor MK2206. The inhibitor blocked EGFL7 OE and wild-type cell growth in a dose-dependent manner (Figure 1N). Recently, AKT phosphorylation has been linked to EGFL7 expression in various cancers.27,28 These results prompted us to examine EGFL7 expression after AKT1/2 inhibition in wild-type and EGFL7 OE cells. EGFL7 expression was increased by AKT inhibitor treatment, which was more pronounced in EGFL7 OE than in wild-type cells (Figure 1N).
BM ECs promote MM cell growth and contribute to MM progression. On the basis of our data that EGFL7 is produced by MM cells and ECs, we next tested MM cell growth when cocultured on GFP+ EGFL7 OE or EGFL7 KD EC cells (Figure 1O). When compared with cocultures with Mock-infected ECs, GFP− MM cells proliferated more when cocultured with EGFL7 OE EC and less when cocultured with EGFL7 KD EC (Figure 1O). These data demonstrate that MM cell– and EC-derived EGFL7 augments MM cell proliferation.
EGFL7 disruption reduces MM growth in an orthometastatic xenograft model
To investigate whether EGFL7 enhances MM growth in vivo, an orthometastatic xenograft model was used.23 NOD/SCID mice were injected s.c. with human RPMI8226 cells (Figure 2A). After 20 days, increased human EGFL7 plasma levels were found in RPMI8266 tumor-bearing mice when compared with nontumor-bearing mice (Figure 2B). These results indicate that tumor cell-derived EGFL7 (human origin) might be useful to monitor MM growth progression and serve as a biomarker to indicate MM progression.

EGFL7 augments MM growth in vivo. (A) Human RPMI8226 wild-type cells were injected s.c. into NOD/SCID mice (n = 6/group). (B) Human EGFL7 plasma levels were measured in murine plasma samples at indicated times by enzyme-linked immunosorbent assay in (n = 6). (C) Representative western blotting for EGFL7 and b-ACTIN in tumors extracted from tumors injected with Mock, EGFL7 OE, or KD RPMI8226 cells. (D-E) The size of tumors that formed after s.c. injection of Mock, EGFL7 OE, or KD cells after day 53. (D) Tumor weight was measured (left panel; n = 6/group). Representative macroscopic tumor images were taken on day 53 postinoculation (right panel). (E) Representative hematoxylin and eosin-stained tumor sections demonstrating increased necrotic areas (yellow lines) in tumors established with EGFL7 KD cells (scale bar, 200 µm). (F-G) RPMI8226 wild-type tumor-bearing NOD/SCID mice were injected with/without neutralizing Abs against EGFL7 (anti-EGFL7) starting after visible tumors had been established by day 25 (n = 6/group). (F) Tumor weight on day 53 after initial tumor inoculation (left panel). Representative macroscopic images of tumors (right panels). (G) Histological images of hematoxylin and eosin–stained tumor sections (scale bar of the insert, 100 µm). Graphs show mean ± SEM. Significance was calculated by Student t test, * P ≤ .05; ** P ≤ .01.
EGFL7 augments MM growth in vivo. (A) Human RPMI8226 wild-type cells were injected s.c. into NOD/SCID mice (n = 6/group). (B) Human EGFL7 plasma levels were measured in murine plasma samples at indicated times by enzyme-linked immunosorbent assay in (n = 6). (C) Representative western blotting for EGFL7 and b-ACTIN in tumors extracted from tumors injected with Mock, EGFL7 OE, or KD RPMI8226 cells. (D-E) The size of tumors that formed after s.c. injection of Mock, EGFL7 OE, or KD cells after day 53. (D) Tumor weight was measured (left panel; n = 6/group). Representative macroscopic tumor images were taken on day 53 postinoculation (right panel). (E) Representative hematoxylin and eosin-stained tumor sections demonstrating increased necrotic areas (yellow lines) in tumors established with EGFL7 KD cells (scale bar, 200 µm). (F-G) RPMI8226 wild-type tumor-bearing NOD/SCID mice were injected with/without neutralizing Abs against EGFL7 (anti-EGFL7) starting after visible tumors had been established by day 25 (n = 6/group). (F) Tumor weight on day 53 after initial tumor inoculation (left panel). Representative macroscopic images of tumors (right panels). (G) Histological images of hematoxylin and eosin–stained tumor sections (scale bar of the insert, 100 µm). Graphs show mean ± SEM. Significance was calculated by Student t test, * P ≤ .05; ** P ≤ .01.
EGFL7 OE, EGFL7 KD, or Mock cells were injected s.c. into NOD/SCID mice. We confirmed EGFL7 expression in tumor lysates extracted from mice injected with EGFL7 OE, EGFL7 KD, or Mock cells by western blotting (Figure 2C). Compared with controls, mice injected with EGFL7 KD cells developed smaller tumors showing more necrotic areas on tissue sections, whereas mice injected with EGFL7 OE cells showed larger tumors (Figure 2D-E). These data demonstrate that EGFL7 functions as an oncogene in MM, augmenting MM cell growth.
Next, we performed experiments with a commercially available Ab that binds to the EGFL7 protein and inhibits EGFL7-mediated downstream effects.25 Treatment with the neutralizing Ab targeting EGFL7 or with the IgG1 control Abs was started once visible tumors had been established. A total of 10 injections of anti-EGFL7 Abs at 1 mg/kg were given once every 2 to 3 days. Anti-EGFL7 Ab, but not IgG1 control Ab, treatment suppressed tumor growth in RPMI8226 xenografted mice (Figure 2F). Histological examination of resected tumors revealed vast necrotic areas (Figure 2F). These results indicate that the depletion of EGFL7 prevents MM tumor cell growth in vivo.
EGFL7 is found in the circulation of MM cell-bearing mice
The Vk*MYC model reproduces the transformation to a more aggressive disease phenotype that models end-stage drug-resistant MM.29 After transplantation of MACS-isolated CD138+ Vk*MYC BM cells (100% MM cells) into C57/BL6J recipients (Vk*MYC mice), grossly enlarged spleens and increases in spleen weight were found in Vk*MYC transplanted, but not in control, C57BL/6J mice that had not received Vk*MYC cells after 25 days (Figure 3A). Flow cytometry on BM and spleen demonstrated that terminally differentiated CD138+ MM cells accumulated in the BM and spleen of VK*MYC transplanted mice (Figure 3B). The percentage of B220+ cells did not change in the BM of Vk*MYC mice when compared with that in controls (Figure 3B).
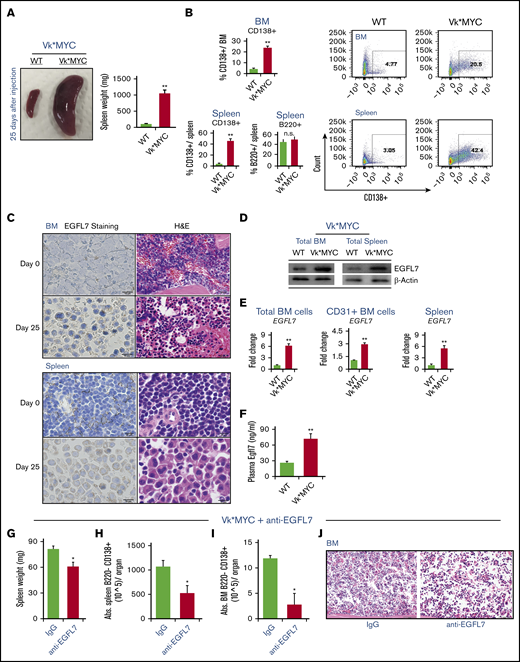
Increased circulating and tissue-bound EGFL7 in the murine Vk*MYC model of MM. (A-F) MACS-isolated CD138+ Vk*MYC BM and spleen cells were injected into C57BL/6J mice via the tail vein. C57BL/6J mice transplanted with Vk*MYC tumor cells (Vk*MYC mice) and control mice (WT) that did not receive tumor cells were analyzed 25 days after cell inoculation. (A) Representative macroscopic images of whole spleens (left panel) and total spleen weight (right panel; n = 6/group) of WT and Vk*MYC mice. (B) Spleen and BM cells from transplanted Vk*MYC recipient or WT mice were stained for the plasma cell marker CD138 and the B-cell marker B220. Percentage of CD138+ cells per total BM or spleen cells and percentage of B220+ cells per total BM cells are given in the left panels. Representative FACS blots of CD138+ cells in BM and spleen are shown in the right panels. (C) Immunohistochemistry analysis of EGFL7 in BM and spleen sections of WT and VK*MYC mice (scale bar of the insert, 10 µm). Hematoxylin and eosin–stained sections (H&E; scale bar of the insert, 20 µm) show massive infiltration of MM cells in the tissue section of Vk*MYC mice. (D) Representative western blot for EGFL7 and b-ACTIN in BM and spleen cell lysates of WT and Vk*MYC mice. Two independent experiments were performed. (E) Fold change of EGFL7 expression in total BMNCs, MACS-isolated CD31+ BM cells, and splenocytes of Vk*MYC mice when compared with the EGFL7 expression in spleen and BM of nontumor-bearing mice (n = 2/group). Transcripts normalized to β-ACTIN. Graphs represent averages from 3 independently prepared templates per condition. Experiments were repeated twice, with similar results. (F) Plasma mouse EGFL7 as determined by enzyme-linked immunosorbent assay (n = 6/group). (G-J) Vk*MYC BM and spleen cells of donor mice with a tumor load of 30% in the BM were injected into C57BL/6J mice via the tail vein. VK*MYC transplanted mice were left untreated for 21 days to ensure sufficient tumor load. Then, 3 mice were treated with neutralizing Abs against EGFL7 (anti-EGFL7) or with isotype (nonbinding) control Ab at 1.5 mg/kg IV. On day 42, mice were euthanized. (G) Spleen weight was determined. (H) Frequency of B220−CD138+ MM cells in splenocytes as determined by FACS. (J) Hematoxylin and eosin–stained sections (scale bar of the insert, 50 µm) showing mild infiltration of MM cells in the BM. (I) Frequency of B220−CD138+ MM cells in BM of Vk*MYC mice treated with anti-EGFL7 Ab or isotype controls (n = 3/group). The data represent the data of 1 experiment. A similar experiment was performed independently, showing similar results. Graphs show mean ± SEM. Significance was calculated by Student t test, * P ≤ .05; ** P ≤ .01.
Increased circulating and tissue-bound EGFL7 in the murine Vk*MYC model of MM. (A-F) MACS-isolated CD138+ Vk*MYC BM and spleen cells were injected into C57BL/6J mice via the tail vein. C57BL/6J mice transplanted with Vk*MYC tumor cells (Vk*MYC mice) and control mice (WT) that did not receive tumor cells were analyzed 25 days after cell inoculation. (A) Representative macroscopic images of whole spleens (left panel) and total spleen weight (right panel; n = 6/group) of WT and Vk*MYC mice. (B) Spleen and BM cells from transplanted Vk*MYC recipient or WT mice were stained for the plasma cell marker CD138 and the B-cell marker B220. Percentage of CD138+ cells per total BM or spleen cells and percentage of B220+ cells per total BM cells are given in the left panels. Representative FACS blots of CD138+ cells in BM and spleen are shown in the right panels. (C) Immunohistochemistry analysis of EGFL7 in BM and spleen sections of WT and VK*MYC mice (scale bar of the insert, 10 µm). Hematoxylin and eosin–stained sections (H&E; scale bar of the insert, 20 µm) show massive infiltration of MM cells in the tissue section of Vk*MYC mice. (D) Representative western blot for EGFL7 and b-ACTIN in BM and spleen cell lysates of WT and Vk*MYC mice. Two independent experiments were performed. (E) Fold change of EGFL7 expression in total BMNCs, MACS-isolated CD31+ BM cells, and splenocytes of Vk*MYC mice when compared with the EGFL7 expression in spleen and BM of nontumor-bearing mice (n = 2/group). Transcripts normalized to β-ACTIN. Graphs represent averages from 3 independently prepared templates per condition. Experiments were repeated twice, with similar results. (F) Plasma mouse EGFL7 as determined by enzyme-linked immunosorbent assay (n = 6/group). (G-J) Vk*MYC BM and spleen cells of donor mice with a tumor load of 30% in the BM were injected into C57BL/6J mice via the tail vein. VK*MYC transplanted mice were left untreated for 21 days to ensure sufficient tumor load. Then, 3 mice were treated with neutralizing Abs against EGFL7 (anti-EGFL7) or with isotype (nonbinding) control Ab at 1.5 mg/kg IV. On day 42, mice were euthanized. (G) Spleen weight was determined. (H) Frequency of B220−CD138+ MM cells in splenocytes as determined by FACS. (J) Hematoxylin and eosin–stained sections (scale bar of the insert, 50 µm) showing mild infiltration of MM cells in the BM. (I) Frequency of B220−CD138+ MM cells in BM of Vk*MYC mice treated with anti-EGFL7 Ab or isotype controls (n = 3/group). The data represent the data of 1 experiment. A similar experiment was performed independently, showing similar results. Graphs show mean ± SEM. Significance was calculated by Student t test, * P ≤ .05; ** P ≤ .01.
Immunoreactive murine EGFL7 was detected in BM and spleen sections of Vk*MYC, but not control, mice (Figure 3C). Western blotting (Figure 3D) and RT-PCR (Figure 3E) results confirmed augmented EGFL7 expression in total BMNCs and splenocytes of Vk*MYC mice when compared with in nontumor-bearing mice. To determine whether tumor ECs contribute to the increase in EGFL7 expression of Vk*MYC-bearing mice, EGFL7 expression was determined in MACS-isolated CD31+ BM cells from nontumor- and Vk*MYC-bearing mice (Figure 3E). Similar to reports in other malignancies, Vk*MYC-derived CD31+ BM cells showed higher EGFL7 expression than CD31+ BM cells isolated from nontumor-bearing control mice, as shown by RT-PCR (Figure 3E). Systemically, higher circulating murine EGFL7 plasma levels were observed in the Vk*MYC mice when compared with control mice (Figure 3F). These data suggest that EGFL7 upregulation was found in the Vk*MYC model.
Our data in the human RPMI8226 model implied Ab treatment reduces MM cell growth in vivo. Next, the efficacy of MM cell suppression using neutralizing Abs against EGFL7 was interrogated in the Vk*MYC mouse model. Mice were injected with total BM cells of Vk*MYC mice IV that contained around 30% of CD138+ cells. Mice were treated once every 2 to 3 days at 1 mg/kg for a total of 6 injections, and Ab treatment started on day 21. The anti-EGFL7 Ab delayed the increase in spleen weight (Figure 3G) and the infiltration of B220−CD138+ MM cells in the spleen (Figure 3H) by day 42 after tumor cell inoculation. We confirmed a lower infiltration of MM cells as detected on BM section (Figure 3I) and a lower percentage of B220−CD138+ MM cells by FACS (Figure 3J).
EGFL7 promotes MM cell adhesion via ITGB3
MM cells enhance MM cell adhesion and proliferation by interacting with FN via the integrin alphaV beta3 (ITGB3).30 Extracellular matrix (ECM)–bound EGFL7 binds to the integrin ITGB3 expressed on T cells.31 RPMI8226, U-266, and MM1.S cells showed augmented ITGB3 expression when compared with the HL60 leukemic cells by RT-PCR (Figure 4A) and FACS (Figure 4B).

ITGB3+ MM cells adhere to immobilized EGFL7 via its RGD region (A) Fold change in ITGB3 expression of HUVEC, HEL, RPMI8226, U-266, MM.1S, and HS-5 cells when compared with ITGB3 expression in HL60 cells using RT-PCR. Transcripts normalized to b-ACTIN. Graphs represent averages from 3 independently prepared templates per condition. Experiments were repeated twice with similar results. (B) Representative FACS plots showing gating for PI negative cells. Histogram showing ITGB3 levels on indicated MM cell lines. (C) Percentage of adhesion of RPMI8226 cells after 4 hours on precoated plates with deposited ECM from cells infected with AdNull (Mock), AdEGFL7 full-form (EGFL7), or Addeleted RGD (delRGD), or precoated with rec. murine EGFL7 (rec. EGFL7) or with rec. FN. The percentage of adherent cells was quantified after cellular staining with crystal violet and absorbance measurement at 550 nm. Cumulative data of 2 independent experiments are shown (n = 5/condition per experiment). (D) Representative FACS histogram of ITGB3 expression using RPMI8226 cells stably transduced with ITGB3 (ITGB3 OE) in the left panel. The right panel shows the percentage of ITGB3 expression on ITGB3 OE cells, as determined by FACS (n = 6/group). (E) Representative western blot image of Tyr747, FAK EGFL7, and b-ACTIN proteins in EGFL7 OE/KD, and ITGB3 OE/KD in RPMI8226 cells. Two independent experiments were performed. (F) Human ITGB3 OE or ITGB3 KD cells were cultured on EGFL7- and FN-coated plates for 4 hours with/without the ITGB3 inhibitor Cilengitide (Celin). Quantification of adherence using crystal violet absorbance of adherent cells (n = 5 wells/condition). (G) Cell proliferation rate was determined after 24 hours by counting Trypan blue-negative ITGB3 OE and Mock MM cells (n = 3/wells per condition). (H) EGFL7 OE or EGFL7 KD MM cells were coinfected with Mock vector (−ITGB3) or ITGB3 OE (+ITGB3) vectors. Cells were counted after 24 hours in culture (n = 6/condition). Experiments were repeated at least twice. Graphs show mean ± SEM. Significance was calculated by Student t test, * P ≤ .05; ** P ≤ .01.
ITGB3+ MM cells adhere to immobilized EGFL7 via its RGD region (A) Fold change in ITGB3 expression of HUVEC, HEL, RPMI8226, U-266, MM.1S, and HS-5 cells when compared with ITGB3 expression in HL60 cells using RT-PCR. Transcripts normalized to b-ACTIN. Graphs represent averages from 3 independently prepared templates per condition. Experiments were repeated twice with similar results. (B) Representative FACS plots showing gating for PI negative cells. Histogram showing ITGB3 levels on indicated MM cell lines. (C) Percentage of adhesion of RPMI8226 cells after 4 hours on precoated plates with deposited ECM from cells infected with AdNull (Mock), AdEGFL7 full-form (EGFL7), or Addeleted RGD (delRGD), or precoated with rec. murine EGFL7 (rec. EGFL7) or with rec. FN. The percentage of adherent cells was quantified after cellular staining with crystal violet and absorbance measurement at 550 nm. Cumulative data of 2 independent experiments are shown (n = 5/condition per experiment). (D) Representative FACS histogram of ITGB3 expression using RPMI8226 cells stably transduced with ITGB3 (ITGB3 OE) in the left panel. The right panel shows the percentage of ITGB3 expression on ITGB3 OE cells, as determined by FACS (n = 6/group). (E) Representative western blot image of Tyr747, FAK EGFL7, and b-ACTIN proteins in EGFL7 OE/KD, and ITGB3 OE/KD in RPMI8226 cells. Two independent experiments were performed. (F) Human ITGB3 OE or ITGB3 KD cells were cultured on EGFL7- and FN-coated plates for 4 hours with/without the ITGB3 inhibitor Cilengitide (Celin). Quantification of adherence using crystal violet absorbance of adherent cells (n = 5 wells/condition). (G) Cell proliferation rate was determined after 24 hours by counting Trypan blue-negative ITGB3 OE and Mock MM cells (n = 3/wells per condition). (H) EGFL7 OE or EGFL7 KD MM cells were coinfected with Mock vector (−ITGB3) or ITGB3 OE (+ITGB3) vectors. Cells were counted after 24 hours in culture (n = 6/condition). Experiments were repeated at least twice. Graphs show mean ± SEM. Significance was calculated by Student t test, * P ≤ .05; ** P ≤ .01.
To examine whether the RGD region in the EGFL7 protein was important for EGFL7-mediated adhesion, an RGD deletion form of EGFL7 was generated (EGFL7 delRGD). MM cells adhered to plates coated with the full-length form of EGFL7, rec. EGFL7, or FN (serving as a positive control for ITGB3), but not to plates coated with the EGFL7 delRGD form. Accordingly, MM cells treated with the RGD pentapeptide ανβ3 and ανβ5 integrin inhibitor Cilengitide (Cilen) or with neutralizing monoclonal EGFL7 Ab failed to adhere to the full form of EGFL7 (Figure 4C). These data show that ITGB3-expressing MM cells can adhere to EGFL7 via the RGD region of the protein.
Next, we determined how ITGB3 expression on MM alters integrin signaling (Figure 4D-E). OE of EGFL7 and ITGB3 in RPMI8226 cells increased ITGB3 phosphorylation and enhanced FAK protein expression, a protein upregulated after integrin engagement (Figure 4E). These data indicate that ITGB3 downstream signaling pathways are turned on after EGFL7 or ITGB3 OE in MM cells.
Functionally, ITGB3 OE, but not ITGB3 KD or Mock, MM cells adhered to immobilized rec. human EGFL7 and FN (Figure 4F). The adhesive effects of EGFL7 were fully prevented in ITGB3 KD cells and in ITGB3 OE cells treated with Cilengitide (Figure 4F), indicating that ITGB3 mediates MM cell adhesion to immobilized EGFL7. Because FN binding to ITGB3 enhances MM cell proliferation,30 we next determined MM cell growth in ITGB3 Mock or ITGB3 OE cells. ITGB3 OE, but not Mock, MM cells showed a stronger mitogenic response in culture (Figure 4G).
To explore the role of ITGB3 for EGFL7-mediated MM cell proliferation, RPMI8226 cells were cotransfected with plasmids for EGFL7 OE/KD or ITGB3 OE/KD (Figure 4H): EGFL7 KD reduced MM cell proliferation independent of ITGB3 (Figure 4H). The highest mitogenic response was found in EGFL7 OE cells coexpressing ITGB3. The ability of EGFL7 OE cells to proliferate even in the absence of ITGB3 indicates that in addition to ITGB3, EGFL7 can bind to other receptors present on MM cells that can mediate MM cell proliferation. Taken together, these data suggest that ITGB3 on MM cells can promote EGFL7-mediated cell adhesion and proliferation.
Bortezomib upregulates EGFL7 and ITGB3 expression on MM cells
Adherent cells are less sensitive to chemotherapeutic agents, and can contribute to drug resistance. We next assessed whether the standard-of-care MM drug BTZ altered EGFL7 and ITGB3 in MM cells. As assessed by RT-PCR, BTZ increased EGFL7 expression in a dose-dependent manner in RPMI8226, U-266, and MM.1S cells (Figure 5A), which inversely correlated to cell proliferation (Figure 5B). EGFL7 upregulation was BTZ-specific, as other anti-MM drugs such as thalidomide or the NF-kB inhibitor JSH-23 did not change EGFL7 expression in MM cells (data not shown), but reduced MM cell growth.
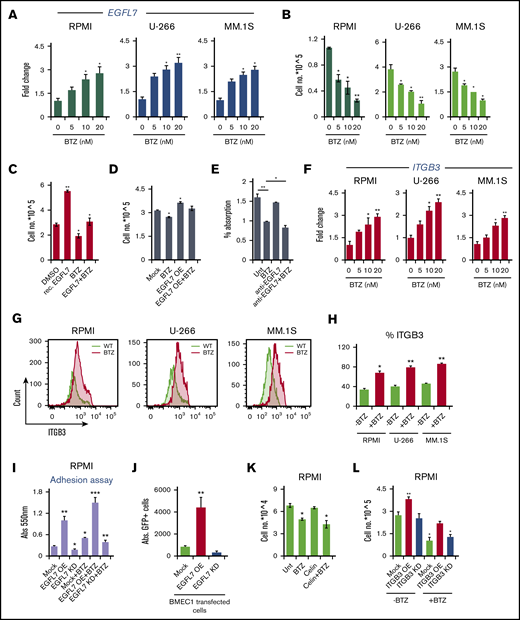

EGFL7 loss in MM cells overrides BTZ resistance (A-B) RPMI8226, U-266, and MM.1S cells were cultured for 24 hours in the presence of BTZ at indicated concentrations. (A) Fold change in EGFL7 gene expression of BTZ-treated MM cells when compared with non-BTZ-treated cultures, as determined by RT-PCR. Transcripts normalized to β-ACTIN. Graphs represent averages from independently prepared templates per condition. (B) Viable MM cells were counted 24 hours after BTZ treatment, using Trypan blue (n = 6/condition). (C) RPMI8226 cells were treated with rec. EGFL7 in the presence/absence of 5 nM BTZ. Cells were counted after 24 hours in culture (n = 6/group). (D) EGFL7 OE and Mock RPMI8226 cells were treated with/without BTZ. Cells were counted after 24 hours (n = 6/group). (E) RPMI Mock cells were cultured with/without neutralizing Abs against EGFL7 in the presence or absence of 10 nM BTZ. Cell proliferation was assessed using the CCK-8 kit after 24 hours in culture (n = 6/condition). (F-G) RPMI8226, U-266, and MM.1S cells were treated with/without BTZ for 24 hours. (F) Fold change in ITGB3 expression in BTZ-treated cells when compared with non-BTZ-treated cells after 24 hours determined by RT-PCR. Gene expression was normalized to β-ACTIN expression. Graphs represent averages from 3 independently prepared templates per condition. Experiments were repeated twice with similar results. (G) Representative FACS histograms showing ITGB3 expression in PI-negative gated cells after being cultured with or without BTZ for 24 hours. (H) Percentage of ITGB3-positive cells in BTZ or non-BTZ cultures, as determined by FACS (n = 6/condition). (I) Mock, EGFL7 KD, and EGFL7 OE RPMI cells were treated with/without BTZ for 24 hours in vitro. Washed RPMI8226 OE, Mock, or KD cells were allowed to adhere to plastic for 4 hours. Adherent cells were quantified using a fluorescence plate reader. Results are shown as percentage adhesion over the input. Experiment was run twice in triplicate (n = 6/condition). (J) Absolute number of GFP+ RPMI8226 cells per well after 4 hours of culture on EGFL7 OE or EGFL7 KD BMEC1 cells. (K) RPMI8226 cells were cultured in the presence or absence of BTZ with/without the integrin inhibitor Cilengitide (Celin; n = 6/group). The number of viable cells was counted after 24 hours. The experiment was run once in triplicate (n = 6/condition). (L) Mock, ITGB3 OE, and ITGB3 KD RPMI cells were treated with/without BTZ. Viable cells were counted using the Trypan exclusion assay (n = 6/group). The experiment was repeated twice. (M) Mock, EGFL7 OE, and EGFL7 KD RPMI cells concomitantly infected with ITGB3 OE or KD plasmids were treated for 24 hours with/without BTZ (n = 6/group). The number of viable cells was determined. The experiment was performed twice. (N) Study treatment scheme. Mock, EGFL7 OE, and EGFL7 KD RPMI MM cells concomitantly infected with/without ITGB3 OE or KD plasmids were injected s.c. into NOD/SCID mice, and tumors were established. Starting on the 25th day (treatment day 1), tumor-carrying mice were randomized according to tumor size. A total of 5 injections of PBS/dimethyl sulfoxide carrier, or BTZ (1 mg/kg) were given twice per week (n = 5 mice per group). Tumor weight was determined on day 36 (n = 5-7/group). Graphs show mean ± SEM. Significance was calculated by Student t test, * P ≤ .05; ** P ≤ .01.
EGFL7 loss in MM cells overrides BTZ resistance (A-B) RPMI8226, U-266, and MM.1S cells were cultured for 24 hours in the presence of BTZ at indicated concentrations. (A) Fold change in EGFL7 gene expression of BTZ-treated MM cells when compared with non-BTZ-treated cultures, as determined by RT-PCR. Transcripts normalized to β-ACTIN. Graphs represent averages from independently prepared templates per condition. (B) Viable MM cells were counted 24 hours after BTZ treatment, using Trypan blue (n = 6/condition). (C) RPMI8226 cells were treated with rec. EGFL7 in the presence/absence of 5 nM BTZ. Cells were counted after 24 hours in culture (n = 6/group). (D) EGFL7 OE and Mock RPMI8226 cells were treated with/without BTZ. Cells were counted after 24 hours (n = 6/group). (E) RPMI Mock cells were cultured with/without neutralizing Abs against EGFL7 in the presence or absence of 10 nM BTZ. Cell proliferation was assessed using the CCK-8 kit after 24 hours in culture (n = 6/condition). (F-G) RPMI8226, U-266, and MM.1S cells were treated with/without BTZ for 24 hours. (F) Fold change in ITGB3 expression in BTZ-treated cells when compared with non-BTZ-treated cells after 24 hours determined by RT-PCR. Gene expression was normalized to β-ACTIN expression. Graphs represent averages from 3 independently prepared templates per condition. Experiments were repeated twice with similar results. (G) Representative FACS histograms showing ITGB3 expression in PI-negative gated cells after being cultured with or without BTZ for 24 hours. (H) Percentage of ITGB3-positive cells in BTZ or non-BTZ cultures, as determined by FACS (n = 6/condition). (I) Mock, EGFL7 KD, and EGFL7 OE RPMI cells were treated with/without BTZ for 24 hours in vitro. Washed RPMI8226 OE, Mock, or KD cells were allowed to adhere to plastic for 4 hours. Adherent cells were quantified using a fluorescence plate reader. Results are shown as percentage adhesion over the input. Experiment was run twice in triplicate (n = 6/condition). (J) Absolute number of GFP+ RPMI8226 cells per well after 4 hours of culture on EGFL7 OE or EGFL7 KD BMEC1 cells. (K) RPMI8226 cells were cultured in the presence or absence of BTZ with/without the integrin inhibitor Cilengitide (Celin; n = 6/group). The number of viable cells was counted after 24 hours. The experiment was run once in triplicate (n = 6/condition). (L) Mock, ITGB3 OE, and ITGB3 KD RPMI cells were treated with/without BTZ. Viable cells were counted using the Trypan exclusion assay (n = 6/group). The experiment was repeated twice. (M) Mock, EGFL7 OE, and EGFL7 KD RPMI cells concomitantly infected with ITGB3 OE or KD plasmids were treated for 24 hours with/without BTZ (n = 6/group). The number of viable cells was determined. The experiment was performed twice. (N) Study treatment scheme. Mock, EGFL7 OE, and EGFL7 KD RPMI MM cells concomitantly infected with/without ITGB3 OE or KD plasmids were injected s.c. into NOD/SCID mice, and tumors were established. Starting on the 25th day (treatment day 1), tumor-carrying mice were randomized according to tumor size. A total of 5 injections of PBS/dimethyl sulfoxide carrier, or BTZ (1 mg/kg) were given twice per week (n = 5 mice per group). Tumor weight was determined on day 36 (n = 5-7/group). Graphs show mean ± SEM. Significance was calculated by Student t test, * P ≤ .05; ** P ≤ .01.
EGFL7-induced MM cell proliferation was inhibited by the addition of BTZ (Figure 5C). Similarly, BTZ suppressed cell proliferation in EGFL7 OE MM cells (Figure 5D). These data indicate that BTZ can induce EGFL7 upregulation in MM cells without losing its anti-MM activity. Although anti-EGFL7 Ab treatment alone did not significantly change MM cell proliferation, as determined using a proliferation assay CCK-8 kit, combined treatment of cells in vitro with BTZ and neutralizing anti-EGFL7 Abs synergistically suppressed MM cell proliferation when compared with BTZ treatment alone (Figure 5E). These data implied strategies combining BTZ with anti-EGFL7 might improve the anti-MM activity.
Because depletion of ITGB3 in cancer cells sensitized cancer cells to conventional drugs by modulating the NF-kB pathway,32 we proceeded to determine ITGB3 expression after BTZ treatment in the 3 above-mentioned MM cell lines. ITGB3 was upregulated in a dose-dependent manner in all MM cell lines by RT-PCR and FACS after BTZ treatment (Figure 5G-H). Next, we investigated how EGFL7 OE and BTZ affect MM cell adhesion to plastic and to EGFL7 OE or KD BMEC-1 cells. EGFL7 OE, but not Mock or EGFL7 KD, MM cells (RPMI8226) adhered better to plastic (Figure 5I). RPMI cells (GFP+) adhered better to EGFL7 OE BMEC1 cells than to control BMEC1 cells (Figure 5J). These data indicate that EGFL7 OE in BMEC1 cells enhanced the adhesion of RPMI8226 cells.
BTZ pretreatment enhanced adhesion independent of the EGFL7 status of the cells (Figure 5I). These data imply that EGFL7 expressing MM cells ameliorate adhesive properties, which can be further amplified after BTZ treatment.
Because cell adhesion is linked to cell proliferation, we examined the role of ITGB3 for MM cell proliferation after BTZ treatment. ITGB3 inhibitor Cilengitide (Celin) treatment alone had no effect on MM cell proliferation, but in combination with BTZ, a trend toward better MM cell growth suppression was observed (Figure 5K). Synergy calculations between both drugs showed indifference, suggesting that neither drug contributes to the action of the other. ITGB3 KD blocked MM cell proliferation that was further suppressed when cells were cotreated with BTZ (Figure 5L). Our data set forth the idea that the BTZ sensitivity of MM cells can be improved by a combined treatment of ITGB3-targeting drugs.
To confirm whether blockade of the EGFL7-ITGB3 axis in MM cells improves BTZ tumor cell growth suppression, RPMI8226 cells were cotransfected with EGFL7 KD and/or ITGB3 KD plasmids. Although ITGB3 KD did not change the BTZ sensitivity of Mock cells or EGFL7 OE cells, ITGB3 KD in combination with EGFL7 KD suppressed MM cell growth in vitro, and in combination with BTZ, completely blocked MM cell growth in vitro (Figure 5M). Indeed, BTZ reduced tumor growth in vitro by around 50% in both EGFL7 OE and EGFL7 KD cells, indicating that targeting EGFL7 in combination with BTZ improves drug efficacy (Figure 5M).
Next, we tested whether EGFL7and ITGB3 KD in MM cells in combination with BTZ synergistically inhibits MM growth in vivo. Wild-type and EGFL7 and/or ITGB3 KD cells were injected s.c. into NOD/SCID mice. Before BTZ treatment started, mice were randomly assigned on day 25 to form groups of mice with a similar tumor size. Groups of mice were treated with or without BTZ intraperitoneally; BTZ treatment reduced tumor growth by 50% in mice injected with wild-type RPMI8226 cells (Figure 5N). Similarly, a 50% tumor weight reduction was observed for EGFL7 KD tumors when compared with wild-type tumors. When EGFL7 KD cell-carrying mice were cotreated with BTZ, EGFL7 deficiency and BTZ in synergy prevented MM cell growth. When not only EGFL7 but also ITGB3 was knocked down in MM cells, no further tumor-reducing effects were observed after BTZ treatment (Figure 5N). These data indicate that BTZ induces apoptosis and that it can, in synergy with EGFL7 and ITGB3, suppress tumor growth in vivo. BTZ treatment resulted in smaller EGFL7 KD tumors, and virtually no tumor was detected in mice injected with EGFL7 KD ITGB3 KD cells (Figure 5N). These data suggest that pharmacological blockade of the EGFL7-ITGB3 axis increases the tumor sensitivity to BTZ treatment.
KLF2 overexpression enhances EGFL7 expression
We were interested in further understanding the mechanism by which the EGFL7-ITGB3 axis mediates BTZ sensitivity in MM cells. Studies have shown that tumor cells escape myelosuppression by upregulating survival-linked proteins such as the transcription factor Krueppel-like factor 2 (KLF2).33 KLF2 has been shown to control MM cell survival.34 Recent studies demonstrated that KLF2 induces EGFL7 expression in ECs via b1 integrin.35 This finding raised the question of whether ITGB3 activation could modulate KLF2 and EGFL7 expression. Indeed, OE of ITGB3 in MM cells upregulated KLF2 and EGFL7 expression when compared with Mock cells (Figure 6A).
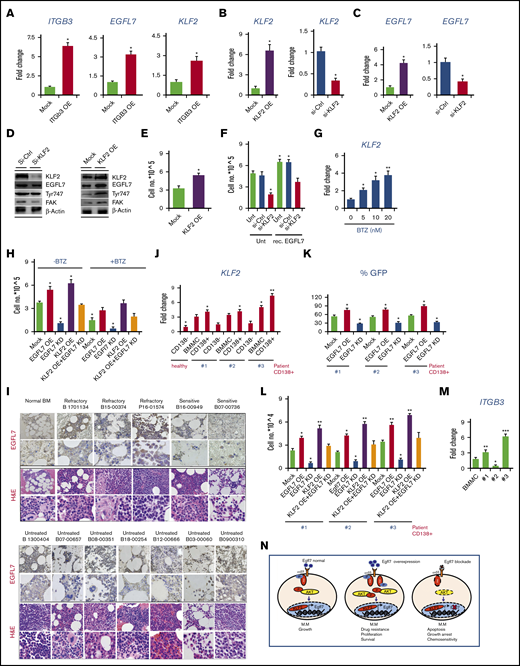
EGFL7, a KLF2 downstream target, promotes primary MM survival. (A) Fold change in ITGB3, EGFL7, and KLF2 expression in ITGB3 OE RPMI cells when compared with Mock cells, as determined by RT-PCR (n = 3/group). (B) Fold change in KLF2 expression in Mock, si-KLF2, and KLF2 OE RPMI cells as determined by RT-PCR (n = 3/group). (C) Fold change in EGFL7 expression in KLF2 OE or si-KLF2 RPMI cells when compared with KLF2 Mock or si-KLF2 cells, respectively, as determined by RT-PCR. (D) Representative western blot for indicated proteins from lysates of si-Ctrl, si-KLF2, Mock, and KLF2 OE cells. (E) Viable cell quantification of KLF2 OE and Mock cells after 24 hours in culture (n = 6/group). (F) KLF2 OE, Mock, si-Ctrl, and si-KLF2 cells were cultured in the presence or absence of rec. EGFL7. Cells were counted after 24 hours (n = 6/group). (G) Fold change in KLF2 expression in BTZ-treated MM cells at the indicated concentration for 24 hours when compared with non-BTZ-treated controls, as evaluated by RT-PCR. (H) MM cells (EGFL7 OE/EGFL7 KD, KLF2 OE, KLF2 KD, or KLF2 OE + EGFL7 KD) were cultured with/without 10 µM BTZ. After 24 hours, viable cells were enumerated (n = 3/group). (I) Immunohistochemical staining for EGFL7 (background panel; scale bars, 50 µm) and hematoxylin and eosin (insert; scale bars, 10 µm) in BM sections of patients with MM. For patient details, see supplemental Figure 1. (J) KLF2 expression determined by RT-PCR in total BMMCs, MACS-isolated BM CD138+ and CD138− cells derived from MM patients #1, #2, and #3. KLF2 expression was given as a fold change to the expression found in MACS-isolated CD138− cells from a healthy donor as the comparator. (K) EGFL7 KD or OE was achieved in human primary MACS-isolated CD138+ MM cells using a lentiviral virus–containing GFP. Cell proliferation was monitored by GFP positivity using FACS after 24 hours (n = 3/group). (L) EGFL7 OE, KD, KLF2 OE or KD was achieved in primary PCR in CD138+ MM patient cell samples (#1-#3). Cell proliferation of transduced cells was determined after 24 hours (n = 6/group). (M) Fold change in ITGB3 expression, as determined by RT-PCR. For all RT-PCR results, transcripts normalized to b-ACTIN. Experiments were repeated twice with similar results. (N) Model of the EGFL7-ITGB3-KLF2-EGFL7 axis in MM cells. EGFL7 partially through binding to ITGB3 on MM cells upregulates the transcription factor KLF2. In turn, KLF2 augments EGFL7 expression. This leads to a positive forward amplification loop that promotes MM survival, a mechanism that seems especially active under the pressure of chemotherapeutic drugs such as BTZ. We propose that EGFL7 contributes to BTZ-induced drug resistance. Data are represented as mean ± SEM. * P ≤ .05; ** P ≤ .01; *** P ≤ .001. P values were determined using a Student t test.
EGFL7, a KLF2 downstream target, promotes primary MM survival. (A) Fold change in ITGB3, EGFL7, and KLF2 expression in ITGB3 OE RPMI cells when compared with Mock cells, as determined by RT-PCR (n = 3/group). (B) Fold change in KLF2 expression in Mock, si-KLF2, and KLF2 OE RPMI cells as determined by RT-PCR (n = 3/group). (C) Fold change in EGFL7 expression in KLF2 OE or si-KLF2 RPMI cells when compared with KLF2 Mock or si-KLF2 cells, respectively, as determined by RT-PCR. (D) Representative western blot for indicated proteins from lysates of si-Ctrl, si-KLF2, Mock, and KLF2 OE cells. (E) Viable cell quantification of KLF2 OE and Mock cells after 24 hours in culture (n = 6/group). (F) KLF2 OE, Mock, si-Ctrl, and si-KLF2 cells were cultured in the presence or absence of rec. EGFL7. Cells were counted after 24 hours (n = 6/group). (G) Fold change in KLF2 expression in BTZ-treated MM cells at the indicated concentration for 24 hours when compared with non-BTZ-treated controls, as evaluated by RT-PCR. (H) MM cells (EGFL7 OE/EGFL7 KD, KLF2 OE, KLF2 KD, or KLF2 OE + EGFL7 KD) were cultured with/without 10 µM BTZ. After 24 hours, viable cells were enumerated (n = 3/group). (I) Immunohistochemical staining for EGFL7 (background panel; scale bars, 50 µm) and hematoxylin and eosin (insert; scale bars, 10 µm) in BM sections of patients with MM. For patient details, see supplemental Figure 1. (J) KLF2 expression determined by RT-PCR in total BMMCs, MACS-isolated BM CD138+ and CD138− cells derived from MM patients #1, #2, and #3. KLF2 expression was given as a fold change to the expression found in MACS-isolated CD138− cells from a healthy donor as the comparator. (K) EGFL7 KD or OE was achieved in human primary MACS-isolated CD138+ MM cells using a lentiviral virus–containing GFP. Cell proliferation was monitored by GFP positivity using FACS after 24 hours (n = 3/group). (L) EGFL7 OE, KD, KLF2 OE or KD was achieved in primary PCR in CD138+ MM patient cell samples (#1-#3). Cell proliferation of transduced cells was determined after 24 hours (n = 6/group). (M) Fold change in ITGB3 expression, as determined by RT-PCR. For all RT-PCR results, transcripts normalized to b-ACTIN. Experiments were repeated twice with similar results. (N) Model of the EGFL7-ITGB3-KLF2-EGFL7 axis in MM cells. EGFL7 partially through binding to ITGB3 on MM cells upregulates the transcription factor KLF2. In turn, KLF2 augments EGFL7 expression. This leads to a positive forward amplification loop that promotes MM survival, a mechanism that seems especially active under the pressure of chemotherapeutic drugs such as BTZ. We propose that EGFL7 contributes to BTZ-induced drug resistance. Data are represented as mean ± SEM. * P ≤ .05; ** P ≤ .01; *** P ≤ .001. P values were determined using a Student t test.
To evaluate whether KLF2 directly upregulates EGFL7 expression in RPMI MM cells, KLF2 OE and KLF2 silencing (si-KLF2) RPMI8226 cells were generated and KLF2 expression was confirmed (Figure 6B). KLF2 OE increased and si-KLF2 decreased EGFL7 expression in MM cells (Figure 6C-D), suggesting that EGFL7 is regulated downstream of KLF2 in MM cells. Furthermore, KLF2 activates the ITGB3 pathway, as evidenced in KLF2 OE cells that showed augmented ITGB3 phosphorylation and FAK protein expression (Figure 6D). KLF2 OE enhanced MM cell proliferation (Figure 6E). EGFL7-driven MM cell proliferation must be mediated through KLF2 (Figure 6F), as rec. EGFL7 did not increase MM cell proliferation in KLF2 KD cells. These findings imply that ITGB3 activation can upregulate EGFL7 through KLF2 in MM cells.
We next tested whether KLF2 also was changed after BTZ treatment was dependent on KLF2. BTZ treatment upregulated KLF2 mRNA in a dose-dependent manner in MM cells (Figure 6G).
To test the mechanism by which BTZ involving EGFL7 and KLF2 controls MM cell proliferation, EGFL7OE, KD, KLF2 KD, and KLF2 KD + EGFL7 KD MM cells were generated. KLF2 OE-mediated MM growth was abolished when EGFL7 was simultaneously knocked down, suggesting that KLF2-mediated proliferation was dependent on endogenous EGFL7 (Figure 6H). Although BTZ caused a 30% reduction in MM cell growth in wild-type/Mock cells, modifications of the EGFL7 and KLF2 pathway reduced MM cell growth by 50%. BTZ treatment was able to reduce MM growth in KLF2 OE and EGFL7 OE or KD MM cells (Figure 6H), indicating that BTZ and treatment strategies that target the EGFL7-ITGB3-KLF2 axis in synergy suppress MM cell growth.
Our data indicate that BTZ treatment upregulates all factors contributing to the EGFL7-ITGB3-KLF2 axis in surviving cells as shown in MM cell lines. MM cell lines might not reflect the actual situation in patients.
To understand whether EGFL7 and KLF2 expression in MM cells correlate to the patients’ disease status, EGFL7 expression was determined by immunohistochemistry, using BM tissue sections from 6 patients with newly diagnosed, untreated MM; 3 patients with treatment-refractory myeloma; and 2 patients responsive to BTZ and control BM from a patient without MM (see supplemental Figure 1 for patient characteristics). Immunoreactive EGFL7 was high in MM cells of human BM tissues derived from patients with MM with refractory disease (Figure 6I). EGFL7 expression varied in BM tissues derived from patients with MM at primary diagnosis (Figure 6I). Similar to BM sections from normal non-MM donors, low immunoreactive EGFL7 was found in BM sections of patients with BTZ/drug-sensitive disease (Figure 6I). Interestingly, the highest EGFL7 expression was found in BM tissue from patients with MM with refractory disease. These data suggest that EGFL7 is expressed in primary MM cells, especially at the stage of the refractory disease, but its expression varies in patient samples at primary diagnosis without treatment.
Because our data indicated that KLF2 regulates EGFL7 expression in MM cell lines, we sought to examine KLF2 expression in primary patient samples. Similar to EGFL7 expression data (as shown in Figure 1E-F) the highest KLF2 expression was found in the CD138+ BM subfraction from patient samples, medium expression was found in total BMMCs, and lowest expression was seen in the CD138− BM subfractions, which seemed to be independent of the disease status (Figure 6J). Highest KLF2 expression was seen in CD138+ cells of a patient with refractory disease (patient #3), whereas KLF2 expression in CD138+ cells of patient #1 and patient #2 with MM stage I/II at primary diagnosis without treatment showed lower KLF2 expression.
To further elucidate whether EGFL7 induces primary MM cell proliferation, EGFL7 was overexpressed or knocked down in primary CD138+ cells of patients with MM (Figure 6K). EGFL7 KD prevented (Figure 6K-L), whereas EGFL7 OE enhanced, the proliferation of CD138+ cells in all 3 samples from patients with MM. To determine whether KLF2-mediated proliferation requires EGFL7, KLF2 was overexpressed in patient CD138+ cells using lentivirus carrying the KLF2 gene. KLF2 OE enhanced cell proliferation in all 3 patient samples, but required the presence of endogenous EGFL7, as shown in cells cotransfected with an EGFL7 KD plasmid (Figure 6L), suggesting that KLF2-mediated MM growth depends on endogenous EGFL7. Given that EGFL7 enhanced MM growth in ITGB3 OE cells, we reasoned that the ITGB3 status might be different in the 3 patient samples. Indeed, the highest ITGB3 expression was found in CD138+ cells isolated from a patient with refractory disease when compared with the CD138+ cells of patients at diagnosis (Figure 6M).
Collectively, our data describe a novel mechanism whereby KLF2-induced EGFL7 enhances MM cell proliferation in part through binding to ITGB3. Binding of the angiogenic factor EGFL7 to ITGB3 expressed on MM cells activates the transcription factor KLF2, which further enhances EGFL7 expression, establishing a self-sustaining autocrine amplification loop in MM cells. This EGFL7-ITGB3-KLF2 axis is upregulated after BTZ treatment, and therefore might contribute to impaired drug sensitivity (Figure 6N). These results highlight the potential of anti-EGFL7 modifying strategies to synergistically augment BTZ anti-MM effects.
Discussion
In the present study, we provide functional evidence that the EGFL7-ITGB3-KLF2 axis regulates MM cell growth. We demonstrate that the angiogenic factor EGFL7 and ITGB3 are expressed in MM cells, where they convey signals similar to those on ECs, such as proliferation and adhesion. EGFL7 knockdown approaches in vitro inhibited MM cell proliferation. Administration of neutralizing Abs against EGFL7 efficiently suppressed MM cell growth in an orthometastatic murine and human xenograft MM model in vivo, and in MM cell lines and primary human CD138+ cells from patients with MM in vitro. Mechanistically, ITGB3 induced the expression of the transcription factor KLF2, which is a critical regulator for MM cell survival.34 KLF2 upregulated EGFL7 expression in MM cells, a mechanism described in ECs.35 Our data suggest the existence of an autocrine EGFL7-ITGB3-KLF2-EGFL7 amplification loop and vicious cycle in MM cells that enables MM cell expansion.
Integrins such as the integrin αvβ3 mediate cancer cell adhesion to the extracellular matrix, thereby enhancing cancer invasiveness, protumor angiogenesis, and skeleton invasion.35 We showed that MM cells adhere to EGFL7 via its RGD domain. It has been reported that the integrin αvβ3 is expressed by MM cells isolated from patients with skeleton involvement and controls MM cell osteotropism with the release of proteases.36 Previous studies showed that ITGB3 signaling in MM cells increases protease production.15,37 It will be interesting to see whether EGFL7 alters the release of proteolytic enzymes and can enhance MM or other cancer cell osteotropism.
We demonstrated that EGFL7 treatment augmented ITGB3 phosphorylation and FAK, typical indicators of cell proliferation and adhesion, and caused AKT phosphorylation. AKT inhibition suppresses the phosphorylation of downstream AKT substrates, the transcription factors forkhead box O transcription factors (FOXO1, FOXO3, and GSK3) in MM cells.26 In renal cancer cells, long noncoding RNA-URRCC upregulated AKT signaling by directly targeting EGFL7 and downregulated FOXO3. In our study, we observed that AKT inhibition upregulated EGFL7 expression in MM cells. Our data suggest that targeting AKT and the EGFL7 axis might be a promising treatment approach. However, adequate controlled studies will be necessary to give us an answer to this question.
Increased EGFL7 plasma levels correlated with MM cell proliferation in a human xenograft and the murine Vk*MYC MM model, suggesting that EGFL7 plasma levels might be useful as a biomarker to monitor tumor progression in patients with MM. However, further studies, especially in patients with MM, are necessary to validate EGFL7 as a biomarker in MM.
BM angiogenesis is a hallmark of MM. Here, we found higher EGFL7 expression in ECs of MM cell-containing, but not in non-MM-containing, BM cells. Higher EGFL7 expression has been reported in tumor endothelium of solid tumors, where it prompts changes in the expression of adhesion molecules that help tumor cells evade the immune system.38,39 Consistent with a report by Laganà et al,11 we found high expression of EGFL7 in the CCND2 upregulated cell lines (RPMI8226 and MM.1S), and in MM cells from patients with MM with refractory disease. It will be interesting in follow-up studies to examine the effects of EGFL7 on tumor angiogenesis in MM, and how it might contribute to MM cell evasion from the immune system. Given that the proteasome inhibitor BTZ upregulated EGFL7 on MM cells, one could also speculate that it can do so on ECs, which might contribute to EC-mediated drug resistance.
Finally, we provide data demonstrating that the EGFL7-ITGB3-KLF2 axis is activated in MM cells after treatment with BTZ, which might contribute to MM cell drug resistance. We found that BTZ treatment upregulated ITGB3 and EGFL7 expression in MM cells. Inhibition of EGFL7 or ITGB3 blocks MM cell growth, suggesting that the EGFL7-ITGB3-KLF2-EGFL7 autoregulatory loop contributes to MM cell survival. We used the Vk*MYC BTZ-insensitive syngeneic murine MM model, where BTZ treatment is not sufficient to control MM growth. Here, the administration of neutralizing Abs against EGFL7 was able to prevent MM growth both in the BM and spleen. We show that combined targeting of EGFL7 or KLF2 together with BTZ suppresses MM cell growth in an additive manner.
In this study, we identify EGFL7 as one of these ECM-bound molecules that mediate MM cell adhesion, proliferation, and drug resistance. We unravel a mechanism whereby EGFL7, partially through interaction with ITGB3-expressing MM cells, induces expression of the transcription factor KLF2. This study can lay the foundation for novel therapy approaches using a combination of anti-EGFL7 treatment strategies with anti-MM drugs such as BTZ in a still often untreatable, deadly disease.
Acknowledgments
The authors thank Robert Whittier and Kengo Shibata for proofreading the manuscript. They thank members of the Laboratory of Morphology and Image Analysis, members of the Laboratory of Molecular and Biochemical Research Research Support Center, and members of the FACS core facility at Juntendo University Graduate School of Medicine for their technical assistance.
This work was supported by grants from the Japan Society for the Promotion of Science (Kiban C grant no. 16K09821 [B.H.]; grant nos. 16K09866, 17K09941, and 26461415 [K.H.]), Health and Labour Sciences Research Grants (grant no. 24008) (K.H.), the Uehara Memorial Foundation (B.H.), the Uehara Memorial Foundation (B.H.), and the collaborative research fund program for women researchers from the Tokyo Medical and Dental University, funded by the Initiative for Realizing Diversity in the Research Environment from MEXT, Japan.
Authorship
Contribution: Y.S. and B.H. designed and performed the experiments, analyzed the data, and wrote the manuscript; A.H.H. performed certain experiments; K.Y. provided critical clinical material for the study (including H929 and KMS11 cell lines); and S.T. and K.H. provided vital reagents.
Conflict-of-interest disclosure: The authors declare no competing financial interests.
Correspondence: Beate Heissig, Department of Immunological Diagnosis, Juntendo University School of Medicine, 2-1-1, Hongo, Bunkyo-ku, Tokyo 113-8421, Japan; e-mail: heissig@juntendo.ac.jp.

