

Key Points
High levels of Ikaros and PSMD10 and low levels of IRF4 proteins are associated with shorter survival in patients treated with VRD.

Abstract
The search for biomarkers based on the mechanism of drug action has not been thoroughly addressed in the therapeutic approaches to multiple myeloma (MM), mainly because of the difficulty in analyzing proteins obtained from purified plasma cells. Here, we investigated the prognostic impact of the expression of 12 proteins involved in the mechanism of action of bortezomib, lenalidomide, and dexamethasone (VRD), quantified by capillary nanoimmunoassay, in CD138-purified samples from 174 patients with newly diagnosed MM treated according to the PETHEMA/GEM2012 study. A high level of expression of 3 out of 5 proteasome components tested (PSMD1, PSMD4, and PSMD10) negatively influenced survival. The 5 analyzed proteins involved in lenalidomide’s mode of action were associated with time to progression (TTP); low levels of cereblon and IRF4 protein and high levels of Ikaros, AGO2, and Aiolos were significantly associated with shorter TTP. Although the glucocorticoid receptor (GCR) level by itself had no significant impact on MM prognosis, a high XPO1 (exportin 1)/GCR ratio was associated with shorter TTP and progression-free survival (PFS). The multivariate Cox model identified high levels of PSMD10 (hazard ratio [HR] TTP, 3.49; P = .036; HR PFS, 5.33; P = .004) and Ikaros (HR TTP, 3.01, P = .014; HR PFS, 2.57; P = .028), and low levels of IRF4 protein expression (HR TTP, 0.33; P = .004; HR PFS, 0.35; P = .004) along with high-risk cytogenetics (HR TTP, 3.13; P < .001; HR PFS, 2.69; P = .002), as independently associated with shorter TTP and PFS. These results highlight the value of assessing proteins related to the mechanism of action of drugs used in MM for predicting treatment outcome.
Introduction
The life expectancy of patients with multiple myeloma (MM) has been greatly improved in the past several years by the introduction of new therapeutic agents with different mechanisms of action. Despite this, repeated relapses and increasingly shorter remissions represent the natural history of MM.1
MM is a heterogeneous disease, as evidenced by its variable clinical presentation and therapeutic outcome, that may arise from an underlying genetic clonal heterogeneity. Surprisingly, although the treatment armamentarium is continuously expanding and the genetic landscape of MM is very well known, treatment options are still mostly driven by age and performance status without personalized strategies defined with respect to MM biology. Thus, a biologically heterogeneous disease is treated as a single entity. Initial therapy for patients who are eligible for autologous stem cell transplantation is based on non–melphalan-containing regimens. Three-drug combinations, such as VRD (bortezomib, lenalidomide, and dexamethasone), VTD (bortezomib, thalidomide, and dexamethasone), and VCD (bortezomib, cyclophosphamide and dexamethasone), are the most commonly used. Moreover, based on available clinical data, VRD or VTD are the preferred regimens for upfront therapy in transplant-eligible patients.2 Although response rates are high, 15% of patients still do not respond to these schemes.
Unfortunately, there are no biomarkers capable of identifying early-relapsing patients and those who are refractory to VRD/VTD in order to avoid administering an ineffective line and thereby avoid the side effects associated with VRD. A step forward in this respect would be to establish whether there are differences among patients in the signaling pathways modulated by these drugs that could explain the lack of response. Bortezomib is a proteasome inhibitor (PI) that binds directly and reversibly to the chymotrypsin-like β5 subunit of the catalytic chamber of the 20S proteasome.3,4 A proteomic approach has identified proteins belonging to 19S and 11S regulatory subunits that have potential as predictive biomarkers of PI treatment.5,6 Lenalidomide belongs to the group of immunomodulatory drugs (IMiDs) and binds directly to cereblon, a substrate receptor protein of the CRL4 E3 ubiquitin ligase. The binding results in ubiquitination and degradation of downstream proteins, such as Ikaros and Aiolos, which are essential transcription factors for plasma cells. Levels of cereblon, Ikaros, and Aiolos have been reported to be associated with MM response to lenalidomide.7-9 On the other hand, virtually all MM patients receive synthetic glucocorticoids (GCs) such as dexamethasone or prednisone, and no biomarker has been applied to evaluate its possible benefit or risk. For these drugs to be effective, the GC receptor (GCR), encoded by NR3C110 in target MM cells, must be present. CRM1, also known as exportin 1 (XPO1), is another protein that plays a critical role as a proto-oncogene in regulating GCR activity.11
The possibility of analyzing the levels of proteins mentioned above in samples from patients with MM has been very limited by the low concentration of protein that can be obtained from purified plasma cells. We have recently reported a novel approach based on a capillary nanoimmunoassay (CNIA) for the accurate and robust quantification of the expression of multiple proteins extracted from CD138-purified MM samples that is ready to use in the clinical setting.7 Taking advantage of the implementation of this platform, we have quantified in a large series of patients homogeneously treated with VRD regimen a set of putative biomarkers involved in the mechanism of action of these drugs.
Materials and methods
Patient samples
Samples from 174 patients with newly diagnosed MM enrolled in the Spanish Myeloma Group clinical trial GEM2012 (NCT01916252) between June 2013 and November 2015 were included in the study. All patients were <65 years of age and treated with 6 cycles of VRD induction followed by autologous stem cell transplantation with melphalan 200 vs busulfan-melphalan and consolidation treatment with 2 cycles of VRD. Patients who did not progress or relapse during this time were provided with maintenance therapy with lenalidomide/dexamethasone vs lenalidomide/dexamethasone/MLN9708 (ixazomib) for 2 years according to GEM2014 (NCT02406144). All patients gave written informed consent in accordance with the declaration of Helsinki. CD138+ plasma cells were isolated from bone marrow samples using the AutoMACS separation system (Miltenyi-Biotec, Bergisch Gladbach, Germany). Plasma cell purity was >80% in all the samples (median, 87%; range, 80% to 98%). Fluorescence in situ hybridization (FISH) analysis to detect IGH rearrangements, 17p deletions, 1q gains, and 1p loss was possible for all patients. The cells were frozen at −80°C in RLT+ buffer (Qiagen, Hilden, Germany).
Protein extraction and capillary electrophoresis immunoassay
Proteins were extracted simultaneously with DNA/RNA by ice-cold acetone precipitation, as previously described,7 and total protein content was evaluated (supplemental Figure 1) CNIA analysis, also called Simple Western, was performed using the WES machine (ProteinSimple, San Jose, CA) in accordance with the manufacturer’s protocols and as previously described.7,12
In brief, 3 μL protein was loaded on the plate, separated by size, and labeled with 8 µL biotin reagent (for the total protein assay) or primary and secondary antibodies (for evaluation of particular proteins). Further, the signal was detected by chemiluminescence using 15 µL streptavidin-horseradish peroxidase. The total protein assay (ProteinSimple) was used to quantify protein concentration. The primary antibodies used in the study, under optimized conditions, are listed in supplemental Table 1. Data were analyzed using Compass Software (ProteinSimple).
Statistical analysis and clinical end points
Statistical analysis was performed using SPSS (IBM SPSS Statistics for Windows, Version 23.0; IBM, Armonk, NY) and R working packages. To compare the 2 MM cohorts, Pearson’s χ2 test or Fisher’s exact test was used, as appropriate, to analyze categorical variables, and the Mann-Whitney U test was used to analyze for continuous variables. Associations between protein levels were estimated with Spearman’s ρ correlation coefficient.
For survival analysis, patients who were not enrolled in the GEM2014 maintenance protocol after completing GEM2012 and who had not progressed, relapsed, or died were excluded. Time to progression (TTP) and progression-free survival (PFS) were assessed for each protein using Cox-type cause-specific hazard (CSH) models to deal with competing risks.13 We considered MM progression/relapse and MM death due to disease progression as the events of interest. Cutoff Finder software (http://molpath.charite.de/cutoff) was used to determine the optimal cutoff of protein expression, which was defined as that providing the most significant split discriminating between long and short survival when testing all the possible cutoffs using the log-rank test. The impact on TTP or PFS of the competing event, the MM-unrelated death, was not statistically significant (P > .05) (supplemental Table 2). Overall survival was not evaluated because of the low number of events (15.5% of deaths) at the time of analysis.
Full multivariate CSH models were adjusted for potential covariates that included conventional variables such as high-risk cytogenetics, age analyzed as a continuous variable, International Staging System (ISS) stage III vs I/II, elevated lactate dehydrogenase (LDH), plasmacytoma occurrence, and protein level dichotomized by the Cutoff Finder R package, with a minimum of 10 samples per group. The cutoff established for TTP was used for all proteins throughout all tests and comparisons. Reduced multivariate CSH clinical models were adjusted only for the aforementioned conventional variables, without considering the protein levels. The performance of the Cox multivariate models was assessed by the Akaike information Criterion (AIC).14 The relative contribution of the covariates to the Cox models was assessed by calculating the proportion of the χ2 statistic accruing from each covariate. The higher the proportion, the greater the contribution of the covariate in the Cox model.
Results
Patient characteristics
Proteins were quantified in a subset of 174 MM patients (protein cohort) representative of the full data set from the GEM2012 trial (n = 458). No statistically significant differences in any clinical and laboratory features were found between the protein cohort and the whole series. Similarly, the distribution of cytogenetic abnormalities between the 2 sets of patients was comparable, also considering the presence of t(4;14), t(14;16), or del(17p) grouped in the high-risk cytogenetic category (supplemental Table 3). Moreover, the incidence of genetic abnormalities was similar to that previously reported in MM.13
After a median follow-up of 52 months (range, 24-68 months), 62 out of 174 patients (36%) had progressed and 27 (15.5%) had died.
Protein expression by CNIA
Protein expression was evaluated in 174 out of the 176 MM samples (98.8%) that fulfilled the quantity and quality requirements, as evaluated by total protein assay. Twelve proteins involved in the mechanism of action of the drugs used in the induction and consolidation therapies of GEM2012 trial were examined in the analysis, including cereblon (CRBN),14 Ikaros (IKZF1), Aiolos (IKZF3),15 argonaute 2 (EIF2C2),16 and IRF417 for lenalidomide; the proteasome components PSMA3 (proteasome 20S subunit α 3), PSME1 (part of the regulatory 11S cap of immunoproteasome), PSMD1, PSMD4 (components of the 19S regulatory lid), and PSMD10-gankyrin (part of the 26S regulatory subunit)5,6,18 for bortezomib; and the GCR encoded by the NR3C1 gene10 and exportin 1 (XPO1)11 for dexamethasone. Levels of expression for each protein are shown in Figure 1A. The levels of expression of several proteins were correlated (Figure 1B); cereblon and Aiolos, 2 proteins involved in lenalidomide activity, were highly correlated (ρ = 0.69, P < .001), and some proteasome component pairs were also correlated, such as PSME1 and PSMD10 (ρ = 0.75, P < .01), PSMD1 and PSMA3 (ρ = 0.76, P < .001), and PSMD1 and PSMD4 (ρ = 0.74, P < .001). Likewise, the levels of expression of the 2 proteins involved in dexamethasone activity, GCR and XPO1, were also significantly correlated (ρ = 0.71, P < .001) (Figure 1B).
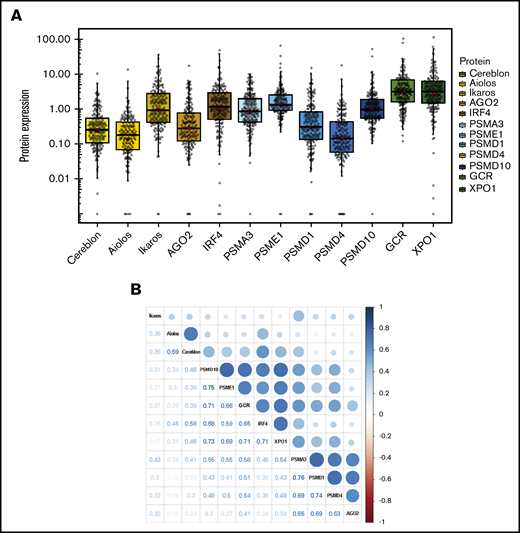
Protein expression in MM samples. (A) The abundance of each protein was assessed by CNIA and normalized with respect to GAPDH abundance in each case. (B) Correlogram of protein expression data. The size of the dots corresponds to the correlation coefficient between the pair of proteins indicated in the lower part of the graph.
Protein expression in MM samples. (A) The abundance of each protein was assessed by CNIA and normalized with respect to GAPDH abundance in each case. (B) Correlogram of protein expression data. The size of the dots corresponds to the correlation coefficient between the pair of proteins indicated in the lower part of the graph.
Impact of protein expression on patient survival
Of the proteins involved in the mechanism of action of PI, the expression of 3 of the 5 proteasome components tested significantly influenced survival (Table 1 and Figure 2). High levels of PSMD1, PSMD4, and PSMD10-gankyrin were associated with adverse prognosis, leading to shorter TTP (median, 40, 48, and 52 months, respectively) compared with patients with lower levels of those proteins who had not reached the median TTP. The survival analysis based on the PFS end point confirmed most of the statistically significant results obtained using TTP (supplemental Table 4 and Figure 2).
Univariate CSH analysis of TTP
| Protein | Cutoff | Group | n | TTP | ||
|---|---|---|---|---|---|---|
| HR (95% CI) | Median TTP (range), mo | P | ||||
| Cereblon | 0.045 | H | 142 | 0.33 (0.15-0.75) | NR (55-NR) | .008 |
| L | 10 | 36 (8-NR) | ||||
| Aiolos | 0.351 | H | 43 | 1.74 (1.02-2.98) | 51 (31-NR) | .044 |
| L | 109 | NR (55-NR) | ||||
| Ikaros | 4.647 | H | 24 | 2.05 (1.12-3.74) | 42 (26-NR) | .020 |
| L | 128 | NR (55-NR) | ||||
| AGO2 | 3.510 | H | 12 | 2.60 (1.32-5.14) | 42 (25-52) | .006 |
| L | 156 | NR (59-NR) | ||||
| IRF4 | 0.539 | H | 113 | 0.57 (0.34-0.97) | NR (55-NR) | .039 |
| L | 41 | 49 (36-NR) | ||||
| PSMA3 | 3.985 | H | 17 | 1.78 (0.90-3.53) | 48 (55-NR) | .096 |
| L | 141 | NR (54.87-NR) | ||||
| PSME1 | 0.981 | H | 107 | 1.48 (0.81-2.69) | 55 (51-NR) | .2 |
| L | 45 | NR (51-NR) | ||||
| PSMD1 | 3.458 | H | 10 | 3.43 (1.67-7.02) | 40 (8-51) | <.001 |
| L | 148 | NR (59-NR) | ||||
| PSMD4 | 0.507 | H | 34 | 1.86 (1.08-3.21) | 48 (35-NR) | .026 |
| L | 124 | NR (59-NR) | ||||
| PSMD10 | 0.548 | H | 115 | 2.46 (1.17-5.19) | 53 (48-NR) | .018 |
| L | 37 | NR (55-NR) | ||||
| GCR | 0.655 | H | 139 | 2.96 (0.72-12.12) | 59 (51-NR) | .131 |
| L | 13 | NR (NR-NR) | ||||
| XPO1 | 2.453 | H | 91 | 1.47 (0.86-2.52) | 53 (48-NR) | .156 |
| L | 63 | NR (59-NR) | ||||
Bold indicates statistically significant P values (P < .05).
CI, confidence interval; NR, not reached.

TTP according to levels of protein expression. (A) TTP in patients with low and high levels of proteins connected to lenalidomide activity, including cereblon, Aiolos, Ikaros, IRF4, and AGO2. (B) TTP in patients with high and low levels of proteins connected to bortezomib activity, including gankyrin, PSMD1, and PSMD4. CSH models were fitted for each protein. The TTP of MM patients is represented depending on protein status. Cutoff Finder (http://molpath.charite.de/cutoff) was used to obtain the optimal cutoff, which was defined as that producing the most significant split discriminating between good and poor survival by examining all the possible cutoffs using the log-rank test. (C) TTP according to the GCR/XPO1 ratio. The log-rank test was performed for GCR/XPO1 ratio. A CSH model was fitted for GCR/XPO1 ratio using dichotomized values based on the optimal cutoff estimated with Cutoff Finder, which was defined as that producing the most significant split discriminating between good and poor survival by examining all the possible cutoffs using the log-rank test.
TTP according to levels of protein expression. (A) TTP in patients with low and high levels of proteins connected to lenalidomide activity, including cereblon, Aiolos, Ikaros, IRF4, and AGO2. (B) TTP in patients with high and low levels of proteins connected to bortezomib activity, including gankyrin, PSMD1, and PSMD4. CSH models were fitted for each protein. The TTP of MM patients is represented depending on protein status. Cutoff Finder (http://molpath.charite.de/cutoff) was used to obtain the optimal cutoff, which was defined as that producing the most significant split discriminating between good and poor survival by examining all the possible cutoffs using the log-rank test. (C) TTP according to the GCR/XPO1 ratio. The log-rank test was performed for GCR/XPO1 ratio. A CSH model was fitted for GCR/XPO1 ratio using dichotomized values based on the optimal cutoff estimated with Cutoff Finder, which was defined as that producing the most significant split discriminating between good and poor survival by examining all the possible cutoffs using the log-rank test.
The levels of the 5 proteins involved in the mechanism of action of lenalidomide were associated with TTP (Table 1 and Figure 2). TTP was significantly shorter for MM patients with low levels of cereblon (median, 36 months) than in those with high levels of expression (median, not reached). Likewise, low IRF4 protein levels were associated with a negative impact on TTP. Conversely, high level of Ikaros, AGO2, and Aiolos were significantly associated with shorter TTP.
In contrast, neither GCR nor XPO1 protein expression levels significantly affected survival. Since GCR handles the transmission of the activation signal by GCs to the nucleus while XPO1 is involved in the extrusion of the activated GCR, thereby abrogating the signals, we evaluated the impact of the ratio between them. We found that the patients with higher GCR/XPO1 ratio had longer TTP (median, 50.8 vs not reached; P = .005) (Figure 2D) and PFS (median, 50.8 vs not reached; P = .004).
In the full multivariate CSH model, including all the considered conventional variables and protein levels for both TTP and PFS, high-risk cytogenetics and expression levels of Ikaros, PSMD10, and IRF4 proteins remained independent prognostic factors. High levels of expression of Ikaros and PSMD10 had a significant negative effect on TTP (hazard ratio [HR], 3.01, P = .014; and HR, 3.49, P = .036, respectively) and PFS (HR, 2.57, P = .028; HR 5.33, P = .004), while high IRF4 levels had a favorable impact (HR, 0.33, P = .004 for TTP; HR, 0.35, P = .004 for PFS). The analysis of the contribution of the variables showed that high-risk cytogenetics explained 26% and 22% of the variation in TTP and PFS, respectively. Interestingly, PSMD10 and IRF4 accounted for 19% and 18% of the variation in PFS, respectively (Figure 3B). A multivariate CSH model adjusted only with the conventional variables revealed that high-risk cytogenetics and the presence of plasmacytomas retained their independent value in predicting adverse TTP and PFS (Figure 3C). The introduction of the 12 proteins in the Cox model substantially improved the model performance, as measured by the AIC, concordance index, and likelihood ratio χ2 test (Table 2).

Multivariate analysis of TTP and PFS. (A) Forest plot of multivariate CSH models with probabilities for each factor associated with TTP and PFS of MM based on age, ISS III vs I/II, LDH high level, plasmacytoma, FISH risk (high cytogenetic risk, including del17p, t(4;14) and/or t(14;16), vs standard risk), and the expression level of the studied proteins (n = 125); samples with missing values were removed from the model. (B) Forest plot of multivariate CSH models with probabilities for each factor associated with TTP and PFS of MM based on clinical variables, including age, ISS III vs I/II, LDH high level, plasmacytoma, and FISH risk (high cytogenetic risk, including del17p, t(4;14), and t(14;16) vs standard risk). (C) Contribution of variables to explaining the model adjustment calculated by the relative proportion of χ2.
Multivariate analysis of TTP and PFS. (A) Forest plot of multivariate CSH models with probabilities for each factor associated with TTP and PFS of MM based on age, ISS III vs I/II, LDH high level, plasmacytoma, FISH risk (high cytogenetic risk, including del17p, t(4;14) and/or t(14;16), vs standard risk), and the expression level of the studied proteins (n = 125); samples with missing values were removed from the model. (B) Forest plot of multivariate CSH models with probabilities for each factor associated with TTP and PFS of MM based on clinical variables, including age, ISS III vs I/II, LDH high level, plasmacytoma, and FISH risk (high cytogenetic risk, including del17p, t(4;14), and t(14;16) vs standard risk). (C) Contribution of variables to explaining the model adjustment calculated by the relative proportion of χ2.
Multivariate Cox model performance
| TTP | PFS | |||
|---|---|---|---|---|
| Clinical model | Full model | Clinical model | Full model | |
| AIC | 453.82 | 443.44 | 491.87 | 482.65 |
| Concordance index | 0.65 | 0.77 | 0.64 | 0.76 |
| χ2 likelihood ratio | 34.389 | 33.22 | ||
| P (likelihood ratio test) | .000586 | .000894 | ||
| TTP | PFS | |||
|---|---|---|---|---|
| Clinical model | Full model | Clinical model | Full model | |
| AIC | 453.82 | 443.44 | 491.87 | 482.65 |
| Concordance index | 0.65 | 0.77 | 0.64 | 0.76 |
| χ2 likelihood ratio | 34.389 | 33.22 | ||
| P (likelihood ratio test) | .000586 | .000894 | ||
The lower the AIC value, the better the model performs. The concordance index value is set between 0 and 1; the closer the value to 1, the higher the concordance of the model
Relationship between protein levels and disease characteristics
We analyzed the association between disease features and protein expression using the cutoff levels established for TTP. PSMD10 and GCR expression were significantly higher in older patients than in younger patients (Figure 4A), and high levels of the IRF4 and PSME1 proteins were associated with more marked anemia (Figure 4B). Interestingly, patients with low levels of expression of cereblon had a significantly higher incidence of plasmacytomas (Figure 4C). There was no association between ISS stage and any of the proteins tested. The proportion of high-risk cytogenetics was higher in the group of patients with lower IRF4 and PSMD4 expression (Figure 4D).

MM characteristics depending on the protein level. (A) Age of the MM patients at diagnosis depending on the level of PSDM10-gankyrin and GCR proteins. The P value is that corresponding to a Mann-Whitney U test. (B) AGO2 level association with LDH. The P value indicates the level of significance of the χ2 statistic. (C) Cereblon protein level at diagnosis and association with plasmacytoma occurrence. The P value indicates the level of significance of the χ2 statistic. (D) Association between IRF4 and PSMD4 protein levels with cytogenetic risk group. The P value indicates the level of significance of the χ2 statistic. (E) Hemoglobin level at diagnosis in MM with high and low levels of IRF4 and PSME1 protein expression. The P value is that corresponding to a Mann-Whitney U test.
MM characteristics depending on the protein level. (A) Age of the MM patients at diagnosis depending on the level of PSDM10-gankyrin and GCR proteins. The P value is that corresponding to a Mann-Whitney U test. (B) AGO2 level association with LDH. The P value indicates the level of significance of the χ2 statistic. (C) Cereblon protein level at diagnosis and association with plasmacytoma occurrence. The P value indicates the level of significance of the χ2 statistic. (D) Association between IRF4 and PSMD4 protein levels with cytogenetic risk group. The P value indicates the level of significance of the χ2 statistic. (E) Hemoglobin level at diagnosis in MM with high and low levels of IRF4 and PSME1 protein expression. The P value is that corresponding to a Mann-Whitney U test.
Discussion
Currently, one of the main goals in treating patients with newly diagnosed MM is to achieve long-term remissions with upfront treatment. The combination of PIs, IMiDs, and GCs, such as VRD or VTD regimens, enables the average time to relapse to be significantly prolonged, particularly in patients who are consolidated with high-dose melphalan plus stem cell transplantation.19,20 However, more than one-third of patients still relapse within 24 months of the transplant,21 indicating that this strategy is clearly suboptimal. The identification of this subset of patients would avoid not only the frustration of an inefficient initial treatment but also unnecessary toxicities that may hamper further treatments. Unfortunately, the current knowledge of the landscape of genetic abnormalities does not always explain the poor prognosis of some of these patients. Another issue is that in a proportion of patients, the balance between toxicity and therapeutic benefit is tipped toward the former for some of the drugs in the combination. However, it remains a challenge to determine whether a particular agent would have been dispensable.19,22
Our goal here was to evaluate the potential of several proteins involved in the mechanism of action of the drugs included in the VRD regimen, as biomarkers that distinguish those MM patients benefited most from this treatment.
We quantified the levels of a component of the 20S core proteasome (PSMA3) and of other components of 19S (PSMD1 and PSMD4) and 11S (PSME1) regulatory complexes together with 26S regulator (PSMD10), whose deregulation is known to be associated with resistance to PI or prognosis of MM patients.3-6
We found that patients that strongly expressed PSMD1, PSMD4, and PSMD10 had shorter survival. PSMD10, which is a component of the 26S proteasome non-ATPase regulatory subunit, codes for the oncoprotein gankyrin,23 which has been inexplicably ignored for the most part in studies of hematological malignancies, although its overexpression, described in a variety of solid tumors compared with normal tissues, has been related to unfavorable prognosis.24-26 Gankyrin is involved in the negative regulation of the tumor suppressors RB1 and P5323,27-29 and plays an essential role in Ras-initiated tumorigenesis.30,31 We have previously described that miR-214 downregulates the level of gankyrin by directly targeting the PSMD10 3′ untranslated region, which induces apoptosis of MM cells.32 More recently, small-molecule inhibitors of gankyrin were described as effectively reducing degradation of RB and p53 and improving the efficacy of anticancer chemical drugs.33,34 Thus, based on this information, it would be interesting to evaluate the anti-MM effect of the chemical inhibitors of gankyrin in MM patients with high levels of expression of this oncoprotein.
High levels of expression of the 19S components PSMD1 and PSMD4 were associated with shorter survival in our study. This result appears inconsistent with a previous report that showed that the in vitro genetic knockout of 19S proteasomal subunits resulted in strong resistance of MM cell lines to carfilzomib.5 Nevertheless, it has to be borne in mind that the prognostic effect of the proteins analyzed in this study is influenced by the combination of several therapeutic agents. No effect on survival was observed for the proteins that form 11S and 20S.
Although different molecular mechanisms of action of lenalidomide have been described, we mainly selected proteins directly involved in the cereblon signaling pathway. We recently reported that a high level of cereblon protein is associated with a good prognosis in MM patients treated with IMiDs,7 consistent with a previous study.8 Interestingly, extremely low levels of cereblon (8.5-fold less than the median level) were the ones that distinguished a group of patients with a median TTP and PFS of only 36 months. This finding suggests that minimal expression of cereblon could be sufficient for the anti-MM activity of lenalidomide. In our study, low levels of cereblon were associated with a higher incidence of plasmacytoma. It has been described that cereblon promotes the activation of CD147,35 which is involved in bone marrow homing of plasma cells. The blockade of CD147 activity impairs MM cell homing and promotes extramedullary disease in mice.36 In line with these findings, it can be speculated that CD147 would be decreased in samples with low levels of cereblon, which could promote extramedullary disease.
High levels of Ikaros and Aiolos protein expression were associated with poor prognosis. These results are consistent with previous studies in which high messenger RNA levels of IKZF1 and IKZF3 were also associated with an adverse prognosis, and, in the case of IKZF1, were an independent prognostic factor in newly diagnosed MM.9 More recently, Ikaros and Aiolos proteins were evaluated in a large cohort of MM patients by flow cytometry, and similarly to our data, showed considerable variability in their expression.37
One of the downstream targets of Ikaros and Aiolos in MM is the transcription factor IRF4, which plays a central role in plasma cell differentiation and is an essential factor for myeloma cell survival.38,39 We found that the group of patients with low levels of IRF4 expression exhibited shorter TTP and PFS and a higher frequency of high-risk cytogenetics. Our data confirm the findings of a previous report concerning the beneficial effect of high IRF4 levels on survival of MM patients treated with lenalidomide-containing regimens.38 However, these results are in contrast to the in vitro data, which showed that the downregulation of IRF4 induced myeloma cell death39 and that a high level of IRF4 expression protected MM cells from bortezomib-induced apoptosis.40 On the other hand, our results should be interpreted in the context of a combination therapy that contains drugs with opposite effects on IRF4 expression. Thus, lenalidomide and bortezomib decrease and dexamethasone increases IRF4 levels.38,41 MM with t(4;14) has been associated with an immature phenotype, while MM with t(11;14) exhibits a more mature phenotype.42 Taking into account that low IRF4 levels have been associated with low CD138 expression and an immature phenotype,43 our findings showing an enrichment of patients with low levels of IRF4 in the high-risk MM group might be linked to the predominance of samples with immature plasma cells in this cytogenetic category.
The AGO2 protein, which is required for microRNA maturation, was also selected for analysis in our study because it has been identified as another target for cereblon in MM.16 We observed that AGO2 overexpression had a negative effect on the survival of MM patients treated with the VRD regimen. A previous report found high AGO2 messenger RNA levels in MM with high-risk gene expression profiles.44
GCs are also a backbone of the therapeutic schemes for treating MM. Although the molecular basis of sensitivity and resistance to them are poorly understood,22 it is well known that the presence of the GCR on the target cells is required for GC cytotoxicity. Despite the severe side effects derived from prolonged treatment with GCs, little effort has been made to find biomarkers of response and resistance that indicate that this medication should be discontinued in the event of limited effectiveness. We found that the GCR protein level by itself had no significant impact on MM prognosis, although a high XPO1/GCR ratio was associated with shorter TTP and PFS. Exportin 1 (XPO1, CRM1)11 is responsible for slow GCR export from nucleus45 as well as the nuclear export of other proteins such as RB,46 p53,47,48 and IκB.49 Increased expression of CRM1 plays a key role in the proliferation and survival of several tumors.50-52 A higher level of CRM1 (XPO1) expression was found in MM compared with normal plasma cells and monoclonal gammopathy of undetermined significance.11 The specific inhibitor of XPO1, selinexor, has shown anti-MM activity,53 and interestingly, the effect of XPO1 was enhanced in combination with dexamethasone.54
Finally, the multivariate model that incorporated the expression of the 12 proteins performed significantly better than the model adjusted only for the variables typically included in survival studies of MM patients. In particular, the independent prognostic value of IRF4, Ikaros, and PSMD10 protein levels for survival of patients with MM treated with VRD encourages further independent studies to validate these results.
The data set is available by e-mail request to normagu@usal.es and irenamk@usal.es.
Acknowledgments
The authors thank Teresa Prieto and Vanesa Gutierrez for their technical assistance with MM cell purification, FISH analysis, and CNIA and Phil Mason for his help in reviewing the English language of the manuscript.
I.M.-K. was supported by a fellowship from the Fundación Española de Hematología y Hemoterapia and a Black Swan Research Initiative grant from the International Myeloma Foundation. L.A.C. was supported by a fellowship from the Fundación Española de Hematología y Hemoterapia. C.d.R. was supported by the Associación Española Contra el Cancer. E.A.R. was supported by the Consejería de Educación de Castilla y León and FEDER funds. This study was funded by the Instituto de Salud Carlos III, cofinanced by FEDER grant PI16/01074; the Gerencia Regional de Salud, Junta de Castilla y León grants GRS1654/A/17, GRS1849/A/18, and GRS2058/A/19; and a Brian D. Novis, Black Swan Research Initiative research grant from the International Myeloma Foundation. The WES platform was acquired thanks to the INNOCAMPUS program (CEI10-1-0010).
Authorship
Contribution: I.M.-K. conceived the idea and designed the study, developed the protein assays, optimized the quantification technology, performed some of the experiments, analyzed data, prepared the figures, and wrote the manuscript; C.d.R. analyzed the clinical data and participated in other data analysis and manuscript preparation; L.A.C. carried out statistical analyses and helped prepare the figures and the manuscript; P.K. helped design the study, interpret the data, and prepare the manuscript; E.A.R. was responsible for extracting material from samples; I.I. helped develop the assays and performed experiments; R.G.-S., J.M.-L., A.O., J.B., J.-J.L., J.S.M., L.R., M.-V.M., and N.C.G. provided patient samples and clinical data and were responsible for obtaining informed consent from the patients; N.C.G. supervised the whole study, conceived the idea, and provided funding; and all authors critically reviewed and approved the manuscript.
Conflict-of-interest disclosure: R.G.-S. received honoraria and travel accommodation from Janssen and Takeda, honoraria from Pharmacyclics, research funding from Hospira, and travel accommodation from Celgene. J.M.-L. has a consulting or advisory role with Novartis, Celgene, Janssen, and Bristol-Myers Squibb; receives speakers’ bureau compensation from Novartis, Celgene, Janssen, and Bristol-Myers Squibb; and receives research funding from Novartis, Celgene, Janssen, Bristol-Myers Squibb (institutional). A.O. has a consulting or advisory role with Amgen and Janssen-Cilag Amgen and receives research funding from Janssen (institutional). J.B. receives honoraria from Celgene, Janssen, and Amgen. J.-J.L. has a consulting or advisory role with Janssen-Cilag and Celgene. J.S.M. has a consulting or advisory role: Amgen, Bristol-Myers Squibb, Celgene, Janssen, MSD, Novartis, Takeda, Roche. L.R. receives honoraria from Janssen, Celgene, Amgen, and Takeda. M.-V.M. receives honoraria and speakers’ bureau compensation from Janssen and Celgene. N.C.G. receives honoraria from Janssen. The remaining authors declare no competing financial interests.
A list of the members of the Grupo Español de Mieloma/Programa para el Estudio de la Terapeutica en Hemopatías Malignas Cooperative Study Groups appears in "Appendix."
Correspondence: Norma C. Gutierrez, Department of Hematology, University Hospital of Salamanca, Paseo San Vicente, 58-182, 37007 Salamanca, Spain; e-mail: normagu@usal.es.
Appendix: study group members
The members of the Grupo Español de Mieloma/Programa para el Estudio de la Terapéutica en Hemopatías Malignas Cooperative Study Groups are: R.G.S., J.M.-L., A.O., J.B., J.S.M., L.R., M.-V.M., and N.C.G.

