

Key Points
Combining pretransplant Deauville score with sIPI and B symptoms stratifies patients according to the risk of post-ASCT treatment failure.
The outcomes of patients with a pretransplant Deauville score of 4 are heterogeneous and modulated by the presence of clinical risk factors.

Abstract
There are limited data regarding the combined value of the pretransplant Deauville score (DS) from a positron emission tomography scan and clinical risk factors in patients with relapsed/refractory aggressive non-Hodgkin lymphoma (NHL). We performed a retrospective analysis to assess the prognostic role of pretransplant DS in patients with relapsed/refractory aggressive NHL who underwent salvage chemotherapy and autologous stem cell transplantation (ASCT). We identified 174 eligible patients between January 2013 and March 2019. In multivariable analysis, pretransplant DS, B symptoms, and secondary International Prognostic Index (sIPI) were independent risk factors for event-free survival (EFS). These variables were used to derive an integrated risk score that categorized 166 patients with available information for all risk factors into 3 groups: low (n = 92; 55.4%), intermediate (n = 48; 28.9%), and high (n = 26; 15.7%). The new prognostic index showed a strong association with EFS (low-risk vs intermediate-risk hazard ratio [HR], 3.94; 95% confidence interval [CI], 2.16-7.17; P < .001; low-risk vs high-risk HR, 10.83; 95% CI, 5.81-20.19; P < .001) and outperformed models based on clinical risk factors or DS alone. These results were validated in 60 patients from an independent external cohort (low-risk vs intermediate-risk HR, 4.04; 95% CI, 1.51-10.82; P = .005; low-risk vs high-risk HR, 10.49; 95% CI, 4.11-26.73; P < .001). We propose and validate a new prognostic index that risk-stratifies patients undergoing salvage chemotherapy followed by ASCT, thereby identifying patients at high risk for posttransplant treatment failure.
Introduction
High-dose chemotherapy followed by autologous stem cell transplantation (ASCT) remains a standard of care in patients with chemoresponsive relapsed or refractory (R/R) aggressive non-Hodgkin lymphoma (NHL).1 However, this treatment approach is still unsuccessful in a significant percentage of patients because of disease progression or relapse.1-3 Previous studies have reported the prognostic relevance of individual clinical risk factors or combinations of factors at the time of relapse, including bulky disease, increased lactate dehydrogenase (LDH) level, time from diagnosis to relapse, B symptoms, secondary (ie, at relapse) International Prognostic Index (sIPI), and its derivative, the age-adjusted IPI.3-8
18F-fluorodeoxyglucose (FDG) positron emission tomography (PET) scan is a functional imaging modality used to assess metabolic response in lymphoma.9 As a marker of metabolic response, the Deauville score (DS), based on a 5-point scale, has been established as a standard method for response assessment that compares the 18F-FDG uptake of the lesions with that of the mediastinum and liver.10 Although the association between PET response and posttransplant outcomes has previously been recognized,11-16 the data regarding the prognostic value of pretransplant DS are limited. Sauter et al17 recently evaluated the prognostic significance of pretransplant DS in patients with R/R diffuse large B-cell lymphoma (DLBCL). Their study demonstrated that patients undergoing salvage ASCT with a DS of 1 to 3 on pretransplant PET scan had significantly better survival outcomes than those with a DS of 4.17 A DS of 4 or 5 on posttreatment PET scan may represent metabolically active lesions, suggesting remnant and viable lymphoma after treatment.10 However, ∼50% of the patients with a DS of 4 had prolonged survival in remission despite having a positive pretransplant PET scan, suggesting the need for improved prognostication in this group of patients.17 In addition, no studies have evaluated the relationship between pretransplant DS and other clinical risk factors. Therefore, we aimed to assess the prognostic role of pretransplant DS and its relationship with other clinical factors in patients with R/R aggressive NHL who are undergoing ASCT. Herein, we describe a risk stratification model we developed that integrates pretransplant DS and clinical risk factors. The new prognostic index was validated in an independent cohort from Samsung Medical Center (SMC) in Seoul, South Korea.
Methods
Study design and patients
The training cohort for this study included patients from Princess Margaret Cancer Centre (PM) in Toronto, Ontario, Canada, who were identified by using the Lymphoma database of the PM Cancer Registry and an ASCT database. The Lymphoma database contains information on consecutive lymphoma patients who received primary treatment at PM. A separate ASCT database includes information on all patients referred to PM with the intention to proceed to transplantation, including patient characteristics at time of first relapse and posttransplant outcomes.
Patients were eligible for this study if they were age 18 years or older, had been diagnosed with R/R aggressive B-cell (including transformed indolent B-cell lymphoma) or nodal T-cell lymphoma between January 2013 and March 2019, had lymphoma that was responsive to salvage chemotherapy, had a pretransplant PET-computed tomography (PET-CT) scan performed before final clearance for ASCT, and subsequently underwent salvage ASCT. Chemoresponsiveness required that patients achieve at least a partial response to salvage therapy using CT criteria in order to proceed to ASCT.18 Patients were excluded if their histologic subtype was uncertain or if they had a diagnosis of follicular lymphoma grade 3A or 3B, Burkitt lymphoma, extranodal mature T-cell or natural killer/T-cell neoplasm, primary central nervous system (CNS) lymphoma, or secondary CNS involvement at first relapse.
We retrospectively collected clinical data at relapse from electronic patient records, which included demographic and baseline disease characteristics, laboratory results that included serum LDH, pathologic findings, salvage treatment, ASCT-related procedures, and treatment outcomes. The sIPI was determined by using clinical variables at the time of disease progression or relapse.7 Refractory disease was defined as progressive disease on primary therapy or within 3 months of completion of primary therapy. Bulky disease was defined as a maximum diameter of mass >10 cm.
After establishing a risk stratification model from the PM data, we validated the new prognostic index in an independent external cohort of patients from the SMC. Eligible patients in the validation cohort were retrieved from 2 ongoing lymphoma patient registries: (1) SMC Lymphoma Cohort II (NCT01877109) between January 2014 and February 2017, and (2) SMC Lymphoma Cohort III (NCT03117036) between March 2017 and December 2018. The Research Ethics Board of the PM reviewed and approved this study and waived the need for obtaining written informed consent. This study was also approved by the Institutional Review Board of the SMC.
PET-CT procedures and interpretation
Details of the PET-CT procedure are described in the supplemental Materials and methods. All available pretransplant PET-CT scans were retrospectively re-assessed using the DS, which was determined independently by 2 nuclear medicine physicians in each hospital (PM: Y.E. and U.M.; SMC: C.-H.L. and K.-H.L). If a discrepancy was noted in the DS assigned by the 2 independent readers at each hospital, a third review was performed and a consensus between the 2 readers was obtained. All nuclear medicine physicians were blinded to clinical information and outcome data.
Statistical analysis
The primary end point was event-free survival (EFS) and was calculated from the date of ASCT to the date of disease progression, any new lymphoma treatment, any cause of death, or last follow-up, as appropriate. The secondary end point was overall survival (OS), which was calculated from the date of ASCT to the date of death from any cause or last follow-up. EFS and OS were estimated by using the Kaplan-Meier method and were compared by using a log-rank test. We first performed univariable analysis using a log-rank test to assess the association between survival outcomes and individual clinical variables. Clinical variables with P < .05 in univariable analysis were included in the multivariable analysis, which used the Cox proportional hazard regression model, and the results were reported as a hazard ratio (HR) with 95% confidence intervals (CIs). Covariates that remained significant after multivariable adjustment were selected to derive a linear predictor, using the weighted sums of covariates (encoded as 0 for reference and 1 if a risk factor was present). The weights were the respective β coefficients (natural logarithm of the HR) from the multivariable Cox regression model.19 To define categorical risk groups, tertiles were defined within the distribution of the risk score. The predictive ability of the integrated risk model was compared with models relying on either PET response or clinic risk factors alone using the concordance index (C-index). The proportional hazards assumption was assessed for each model using scaled Schoenfeld residuals. Model calibration was assessed with the calibration slope, which was calculated by regressing on the risk score in the validation cohort using a Cox model. Model specification was examined by fitting a Cox model in the validation set containing the final selected prognostic factors along with the risk score with its coefficient fixed to 1.19
Descriptive statistics were reported as percentages for categorical variables and as median and interquartile ranges (IQRs) for continuous variables. Demographic and individual baseline clinical characteristics of the training and validation cohorts were compared by using Fisher’s exact test for categorical variables and the Mann-Whitney U test for continuous variables. A two-sided P < .05 was regarded as significant. The R software environment was used to calculate statistics and generate figures. An alluvial plot was drawn using the ggalluvial package (version 0.11.1).
Results
Cohort characteristics
A total of 261 potentially eligible patients were identified from the 2 databases at PM, 87 of whom were excluded from this study because they did not have a pretransplant PET scan (n = 53), they had CNS involvement (n = 32), or the evidence of histologic transformation to aggressive NHL (n = 2) was uncertain. Hence, the PM cohort consisted of 174 patients for whom DS and clinical risk factors were examined (Figure 1A). Although more patients with a missing pretransplant PET-CT scan had B-cell NHL, baseline characteristics did not otherwise differ significantly according to the PET scan availability (supplemental Table 1). The cohort from which the multiparameter prognostic index was derived included 166 patients, because 8 patients (4.6%) had missing serum LDH and/or sIPI information. Seventy patients from the SMC lymphoma cohorts were available for the validation cohort, 10 of whom were not eligible because of missing pretransplant PET-CT scan (n = 5), isolated or concurrent CNS relapse (n = 3), or ineligible histologic subtype (n = 2). Thus, 60 patients were identified as the independent validation cohort (Figure 1B).
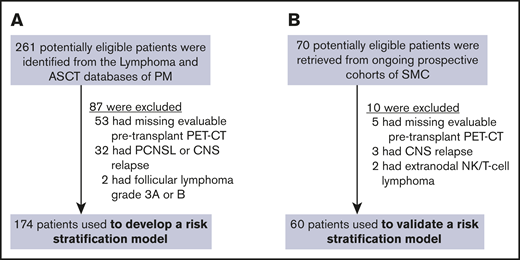
Study flow. Training (A) and validation (B) cohorts. PCNSL, primary central nervous system lymphoma; NK, natural killer.
Study flow. Training (A) and validation (B) cohorts. PCNSL, primary central nervous system lymphoma; NK, natural killer.
Demographic and individual clinical characteristics of 174 patients in the training cohort and of 60 patients in the validation cohort are summarized in Table 1. Many clinical variables were distributed equally between the 2 cohorts, but there were several differences. Patients in the training cohort were, on average, older (median age, 55.5 vs 52.5 years) and more frequently had lymphoma that had transformed from indolent B-cell histology (21.8% vs 0%). Conversely, patients included in the validation cohort more commonly had T-cell phenotype lymphoma (17.8% vs 30.0%), particularly peripheral T-cell lymphoma-not otherwise specified, longer interval between PET-CT scan and ASCT (median, 20 vs 54 days), and longer follow-up (median, 25.1 vs 38.8 months). Salvage treatment profiles of the training cohort also differed from those of the validation cohort. Most patients in the training cohort were treated with a gemcitabine, dexamethasone, and cisplatin (GDP; 86.2% vs 23.3%) regimen as a salvage chemotherapy, but more patients in the validation cohort received ifosfamide, carboplatin, and etoposide (ICE; 0% vs 56.7%) and ≥2 salvage chemotherapy regimens before ASCT (4.6% vs 16.7%). CD20 monoclonal antibodies (mAbs) such as rituximab and obinutuzumab were more frequently used in the training cohort (33.9% vs 21.7%). Other clinical variables did not differ significantly.
Clinical characteristics of patients in training and validation cohorts
| Characteristic | Training cohort (n = 174) | Validation cohort (n = 60) |
|---|---|---|
| Age, y | ||
| Median (range) | 55.5 (19-70) | 52.5 (20-65) |
| ≤60 | 111 (63.8) | 45 (75.0) |
| >60 | 63 (36.2) | 15 (25.0) |
| Sex | ||
| Male | 101 (58.0) | 34 (56.7) |
| Female | 73 (42.0) | 26 (43.3) |
| Immunologic phenotype | ||
| B-cell | 143 (82.2) | 42 (70.0) |
| T-cell | 31 (17.8) | 18 (30.0) |
| Lymphoma histology | ||
| Diffuse large B-cell | 98 (56.3) | 41 (68.3) |
| Transformed indolent | 38 (21.8) | 0 (0) |
| Anaplastic large cell (ALK-positive or negative) | 13 (7.5) | 4 (6.7) |
| Peripheral T-cell | 9 (5.2) | 11 (18.3) |
| Angioimmunoblastic T-cell | 9 (5.2) | 3 (5.0) |
| Primary mediastinal | 7 (4.0) | 1 (1.7) |
| Ann Arbor stage | ||
| I-II | 58 (33.3) | 28 (46.7) |
| III-IV | 116 (66.7) | 32 (53.3) |
| ECOG performance status | ||
| 0 or 1 | 149 (85.6) | 50 (83.3) |
| ≥2 | 25 (14.4) | 10 (16.7) |
| B symptoms | ||
| Absence | 137 (78.7) | 47 (78.3) |
| Presence | 37 (21.3) | 13 (21.7) |
| Bulky disease | ||
| No | 144 (82.8) | 53 (88.3) |
| Yes | 30 (17.2) | 7 (11.7) |
| Bone marrow involvement | ||
| No | 153 (87.9) | 53 (88.3) |
| Yes | 21 (12.1) | 7 (11.7) |
| Serum LDH level | ||
| Normal | 80 (46.0) | 30 (50.0) |
| Increased | 86 (49.4) | 30 (50.0) |
| Unknown | 8 (4.6) | 0 (0) |
| sIPI | ||
| Low | 66 (37.9) | 25 (41.7) |
| Low-intermediate | 48 (27.6) | 19 (31.7) |
| High-intermediate or high | 52 (29.9) | 16 (26.7) |
| Unknown | 8 (4.6) | 0 (0) |
| Response to primary therapy | ||
| ≥1 y | 57 (32.8) | 19 (31.7) |
| <1 y or refractory disease | 117 (67.2) | 41 (68.3) |
| Specific primary treatment | ||
| Previous rituximab | 135 (77.6) | 42 (70.0) |
| Previous radiotherapy | 30 (17.2) | 6 (10.0) |
| Salvage chemotherapy before ASCT | ||
| GDP | 150 (86.2) | 14 (23.3) |
| CHOP | 10 (5.7) | 0 (0) |
| DHAP | 4 (2.3) | 2 (3.3) |
| DICEP | 2 (1.1) | 0 (0) |
| ICE | 0 (0) | 34 (56.7) |
| 2 or more salvage regimens | 8 (4.6) | 10 (16.7) |
| CD20 mAb during salvage therapy | ||
| Not used | 115 (66.1) | 47 (78.3) |
| Used | 59 (33.9) | 13 (21.7) |
| Rituximab | 39 (22.4) | 13 (21.7) |
| Obinutuzumab | 20 (11.5) | 0 (0) |
| Median interval in days between PET and ASCT (range) | 20 (2-66) | 54 (6-122) |
| Median duration of follow-up (IQR), mo | 25.1 (13.9-39.4) | 38.8 (23.6-53.1) |
All data are no. (%) unless otherwise stated.
ALK, anaplastic lymphoma kinase; CHOP, cyclophosphamide, doxorubicin, vincristine, and prednisone; DHAP, dexamethasone, high-dose cytarabine, and cisplatin; DICEP, dose-intensive cyclophosphamide, etoposide, and cisplatin; ECOG, Eastern Cooperative Oncology Group; GDP, gemcitabine, dexamethasone, and cisplatin; ICE, ifosfamide, carboplatin, and etoposide.
Pretransplant DS and survival outcomes in the training cohort
At the time of analysis, 63 patients (36.2%) experienced a documented disease progression or relapse after ASCT, and 58 deaths (33.3%) were reported. Most deaths were secondary to lymphoma progression or relapse, but additional causes of death were infectious complications without evidence of disease progression in 3 patients, treatment-related toxicities in 2 patients, and unknown in 6 patients. Thus, we documented a total of 74 events suitable for estimating EFS. With a median follow-up of 25.1 months (IQR, 13.9-39.4 months), the 2-year EFS rate was 54.7% (95% CI, 47.2%-63.4%) and the OS rate was 64.1% (95% CI, 56.6%-72.6%). Pretransplant DS was available for all 174 patients and was determined as 1 (n = 30; 17.2%), 2 (n = 41; 23.6%), 3 (n = 20; 11.5%), 4 (n = 71; 40.8%), or 5 (n = 12; 6.9%; supplemental Table 2). Patients with a DS of 4 had significantly worse EFS and OS than those with a DS of 1 to 3 but had better EFS and OS than those with a DS of 5 (Figure 2A-B). Hence, the pretransplant DS allowed us to identify patients with divergent posttransplant outcomes.
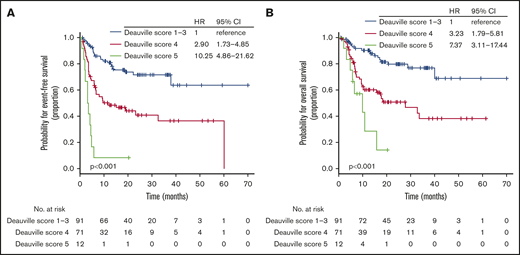
EFS and OS according to pretransplant DS. EFS (A) and OS (B) based on DS on pretransplant PET-CT scan in the training cohort.
EFS and OS according to pretransplant DS. EFS (A) and OS (B) based on DS on pretransplant PET-CT scan in the training cohort.
Development of the risk stratification model
Next, we asked whether outcome prediction could be improved by integrating pretransplant DS and clinical risk factors determined at the time of relapse. Univariable analysis showed that all variables except age, sex, and histologic immunophenotype were significantly associated with EFS and OS (supplemental Table 3). Because of the small number of patients with high sIPI and similar survival outcomes between high-intermediate and high sIPI, we merged these categories into a single group (supplemental Figure 1). By using a multivariable Cox proportional hazard model that included significant variables in the univariable analysis, we found that sIPI, B symptoms, and pretransplant DS were independent prognostic factors for both EFS and OS (Table 2). To obtain a parsimonious model, the Cox proportional hazard model was re-fit with only sIPI, B symptoms, and pretransplant DS (supplemental Table 4). The C-index was only slightly lowered in the reduced model (0.758 vs 0.762), and the χ2 test showed no difference in the log-likelihood statistic of the model (χ2 = 0.43; P = .805). Thus, the final model consisted of sIPI, B symptoms, and pretransplant DS. The proportional hazards assumption held for all prognostic factors in the model. The β coefficients in each indicator variable were determined from the final Cox model (supplemental Table 4), and the risk score was then calculated for each combination of risk factors (Table 3). Patients were stratified into 3 groups according to the risk score: low-risk (<33rd percentile), intermediate-risk (>33rd percentile and ≤66th percentile), and high-risk (>66th percentile) groups, with 1-year EFS of 84.8% (95% CI, 77.5%-92.8%), 49.4% (95% CI, 36.8%-66.4%), and 11.5% (95% CI, 4.0%-33.5%), respectively (supplemental Table 5). The proposed risk model showed a strong association with both EFS (low-risk vs intermediate-risk HR, 3.94; 95% CI, 2.16-7.17; P < .001; low-risk vs high-risk HR, 10.83; 95% CI, 5.81-20.19; P < .001; Figure 3A) and OS (low-risk vs intermediate-risk HR, 4.19; 95% CI, 2.06-8.53; P < .001; low-risk vs high-risk HR, 12.84; 95% CI, 6.25-26.36; P < .001; Figure 3B) and had the highest predictive ability (C-index, 0.758) among the various combinations of risk factors (supplemental Table 6). The curves were well separated, confirming that the model has good discriminatory ability in the training data set. This model was also significantly associated with EFS and OS in the 3 main histologic entities: DLBCL, transformed indolent lymphoma, and T-cell NHL (supplemental Figure 2).
Multivariable analysis for EFS and OS in the training cohort
| Covariate | HR | 95% CI | P |
|---|---|---|---|
| EFS | |||
| sIPI | .001 | ||
| Low | 1 | ||
| Low-intermediate | 2.52 | 1.26-5.04 | |
| High-intermediate or high | 3.62 | 1.79-7.32 | |
| Pretransplant DS | <.001 | ||
| 1-3 | 1 | ||
| 4 | 3.01 | 1.71-5.31 | |
| 5 | 13.46 | 5.99-30.22 | |
| B symptoms | .021 | ||
| Absence | 1 | ||
| Presence | 1.97 | 1.11-3.52 | |
| Bulky disease | .730 | ||
| No | 1 | ||
| Yes | 0.90 | 0.50-1.64 | |
| Response to previous therapy | .570 | ||
| ≥1 y | 1 | ||
| <1 y or refractory disease | 1.18 | 0.66-2.10 | |
| OS | |||
| sIPI | <.001 | ||
| Low | 1 | ||
| Low-intermediate | 2.34 | 0.99-5.53 | |
| High-intermediate or high | 5.22 | 2.28-11.96 | |
| Pretransplant DS | <.001 | ||
| 1-3 | 1 | ||
| 4 | 3.35 | 1.76-6.38 | |
| 5 | 9.63 | 3.78-24.52 | |
| B symptoms | .019 | ||
| Absence | 1 | ||
| Presence | 2.12 | 1.13-3.97 | |
| Bulky disease | .700 | ||
| No | 1 | ||
| Yes | 0.88 | 0.46-1.68 | |
| Response to previous therapy | .640 | ||
| ≥1 y | 1 | ||
| <1 y or refractory disease | 1.16 | 0.62-2.19 |
Risk scores in each potential risk group and categorization
| Indicator variables | Calculated risk score | Risk groups by tertiles | No. of patients designated | |||
|---|---|---|---|---|---|---|
| sIPI | B symptoms | Pretransplant DS | PM | SMC | ||
| Low | Absence | 1-3 | 0.000 | Low | 34 | 15 |
| Low | Presence | 1-3 | 0.658 | Low | 3 | 1 |
| Low-intermediate | Absence | 1-3 | 0.951 | Low | 19 | 7 |
| Low | Absence | 4 | 1.087 | Low | 21 | 7 |
| High-intermediate or high | Absence | 1-3 | 1.312 | Low | 15 | 7 |
| Low-intermediate | Presence | 1-3 | 1.609 | Intermediate | 5 | 5 |
| Low | Presence | 4 | 1.745 | Intermediate | 4 | 0 |
| High-intermediate or high | Presence | 1-3 | 1.970 | Intermediate | 10 | 1 |
| Low-intermediate | Absence | 4 | 2.039 | Intermediate | 17 | 2 |
| High-intermediate or high | Absence | 4 | 2.400 | Intermediate | 12 | 3 |
| Low | Absence | 5 | 2.611 | High | 4 | 2 |
| Low-intermediate | Presence | 4 | 2.696 | High | 3 | 2 |
| High-intermediate or high | Presence | 4 | 3.057 | High | 11 | 2 |
| Low-intermediate | Absence | 5 | 3.562 | High | 4 | 3 |
| High-intermediate or high | Absence | 5 | 3.923 | High | 4 | 1 |
| High-intermediate or high | Presence | 5 | 4.581 | High | 0 | 2 |
A linear predictor was calculated using the weighted sums of the indicator variables and their β coefficients and was categorized into tertiles.
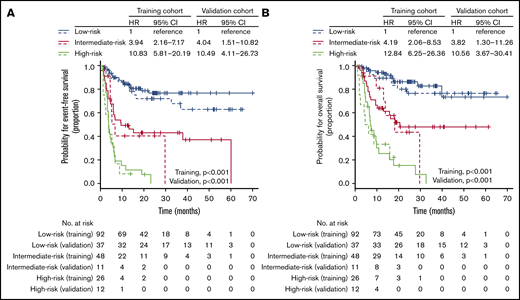
EFS and OS according to the proposed risk stratification model. EFS (solid line, training cohort; dotted line, validation cohort) (A) and OS (solid line, training cohort; dotted line, validation cohort) (B) based on the proposed risk stratification model.
EFS and OS according to the proposed risk stratification model. EFS (solid line, training cohort; dotted line, validation cohort) (A) and OS (solid line, training cohort; dotted line, validation cohort) (B) based on the proposed risk stratification model.
The relationship between pretransplant DS and other clinical risk factors in the training cohort was visually represented using an alluvial plot (Figure 4A). A high-risk group consisted of patients with pretransplant DS of 5 and those with DS of 4 and >1 clinical risk factors (ie, both B symptoms and low-intermediate, high-intermediate, or high sIPI). However, patients with a pretransplant DS of 4 who did not have any other clinical risk factors were categorized into a low-risk group. A majority of patients with a DS of 1 to 3 were classified in the low-risk group unless they had more than 1 clinical risk factors. As a result, 21 (30.9%) and 14 (20.6%) of 68 patients with a DS of 4 were categorized into the low- and high-risk groups, respectively, and 15 (17.4%) of 86 patients with a DS of 1 to 3 were re-classified into the intermediate-risk group (Figure 4B). Taken together, the new multiparameter prognostic index allowed us to improve risk stratification when compared with risk models that considered DS or clinical risk factors alone.
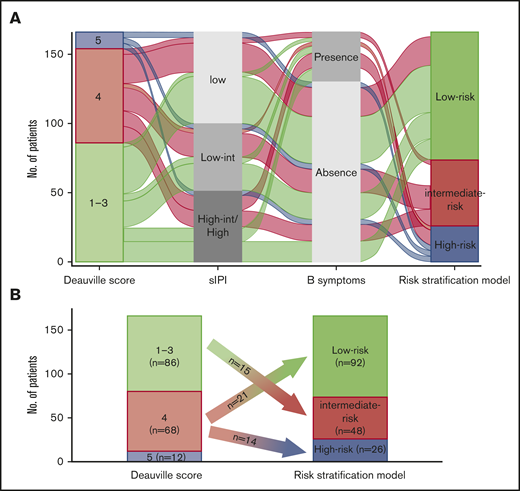
Association of risk stratification model with other risk factors. (A) An alluvial plot shows the frequency and relationship between the proposed risk stratification model and clinical risk factors in patients with R/R aggressive NHL who were included in the training cohort. The width of the ribbons corresponds to the percentage of patients who had the same sIPI, B symptom status, pretransplant DS, and risk group assigned. (B) Plot showing the re-classification of risk group from the pretransplant DS. int/INT, intermediate.
Association of risk stratification model with other risk factors. (A) An alluvial plot shows the frequency and relationship between the proposed risk stratification model and clinical risk factors in patients with R/R aggressive NHL who were included in the training cohort. The width of the ribbons corresponds to the percentage of patients who had the same sIPI, B symptom status, pretransplant DS, and risk group assigned. (B) Plot showing the re-classification of risk group from the pretransplant DS. int/INT, intermediate.
Validation of the risk stratification model
To assess the generalizability of the findings from this study, we attempted to validate the new risk model by using the data for 60 patients from an independent lymphoma cohort at SMC. With a median follow-up of 38.8 months (IQR, 23.6-53.1 months), the 2-year EFS rate of the validation cohort was 53.5% (95% CI, 42.0%-68.2%) and the OS rate was 60.1% (95% CI, 48.2%-74.9%), which did not differ significantly from those of the training cohort (P = .680 and P = .970, respectively). Pretransplant DS was determined as 1 to 3 (n = 36; 60.0%), 4 (n = 16; 26.7%), or 5 (n = 8; 13.3%; supplemental Table 2) and was significantly associated with EFS and OS (supplemental Figure 3). In both univariable and multivariable analysis, the risk factors identified from the training cohort (ie, pretransplant DS, B symptoms, and sIPI) were significantly associated with EFS and OS (supplemental Table 7).
We then applied the proposed risk model to the validation cohort and found that the EFS rates in each risk group of the validation cohort were remarkably similar to those of the training cohort (low-risk vs intermediate-risk HR, 4.04; 95% CI, 1.51-10.82; P = .005; low-risk vs high-risk HR, 10.49; 95% CI, 4.11-26.73; P < .001; Figure 3A). The risk stratification model was significantly associated with OS in the validation cohort (low-risk vs intermediate-risk HR, 3.82; 95% CI, 1.30-11.26; P = .015; low-risk vs high-risk HR, 10.56; 95% CI, 3.67-30.41; P < .001; Figure 3B). It had higher predictive ability than models based on 1 or 2 risk factors (supplemental Table 6). In addition, the proportional assumption held in the model (P = .690). The calibration slope in the validation cohort was 0.896 (standard error = 0.173), which was slightly but statistically significantly less than 1 (P < .001), indicating that some overfitting may be present. The joint test of all predictors with the risk score offset was nonsignificant (χ2 = 7.22; P = .204), indicating no overall evidence of lack of fit of the risk score. In summary, the new prognostic index had similar prognostic power in the SMC validation cohort when compared with the training cohort.
Discussion
The prognostic relevance of DS on pretransplant PET scan has recently been reported in patients with R/R aggressive B-cell NHL who have chemoresponsive disease.17 However, a substantial proportion of patients with positive pretransplant PET scans may have a favorable prognosis after salvage ASCT,17,20 which highlights the need for more accurate prognostication in this group of patients. Previous data have suggested that combining PET response with other clinical or PET variables provides a promising advance on improving prognostication in patients with newly diagnosed21-23 and R/R13-15 lymphoma. However, no study so far has specifically addressed the added prognostic value of pretransplant DS, the current standard functional imaging response assessment criterion, to clinical risk factors. In our training cohort of 174 patients, we found that pretransplant PET assessment using Deauville criteria predicts posttransplant outcomes. In addition, we identified 3 relevant risk factors (pretransplant DS, sIPI, and B symptoms) that were independently prognostic for EFS and OS. The combination of these 3 covariates into a combined prognostic index had better predictive ability than models relying on either clinical risk factors or functional imaging alone. Notwithstanding the apparent differences in baseline clinical characteristics, salvage chemotherapy, and the practice pattern of ASCT, the risk model established from the PM cohort was successfully validated in the SMC cohort.
Our risk model showed several important findings in the interpretation of the pretransplant PET scan. As expected, all patients with a pretransplant DS of 5 were categorized into the high-risk group, irrespective of any other combined clinical risk factors. However, the outcomes of patients with a pretransplant DS of 4 differed on the basis of clinical risk factors. Approximately 20% of patients with a DS of 4 had >1 clinical risk factors (ie, B symptoms and low-intermediate, high-intermediate, or high sIPI). These patients showed treatment outcomes similar to those with a DS of 5, with a 1-year EFS rate of around 10%—strong evidence that salvage ASCT might not be an optimal treatment option for these patients. Notably, because about half the patients assigned to the high-risk group had a pretransplant DS of 4, our risk model may serve to robustly identify the group of patients with an established need for novel treatment approaches. Conversely, ∼30% of patients with a DS of 4 who did not have any unfavorable clinical factors could be categorized into a low-risk group. This latter observation emphasizes the underlying heterogeneity of this group of patients with respect to outcome. And finally, although most patients with a pretransplant DS of 1 to 3 were categorized in the low-risk group, we found that ∼17% of these patients who had more than 1 clinical risk factor could be re-categorized into the intermediate-risk group. Based on these findings, our results show that integrating both functional imaging studies and clinical risk factors into a combined prognostic index allows appropriate interpretation of the impact of pretransplant DS on posttransplant outcomes.
Despite a strong association between the new risk model and survival outcomes, our study has several limitations. First, our data are retrospective in nature, and the possibility of selection bias might be present. In addition, because chemoresponsiveness before ASCT was determined by the treating physicians, it was subject to additional selection bias. Therefore, our risk model should be investigated in prospective studies. Second, we included patients diagnosed with various histologic subtypes who received various salvage treatment regimens. Previous data have demonstrated that T-cell NHL has inferior survival outcomes after salvage ASCT compared with B-cell NHL.24,25 In our training cohort, patients with B-cell and T-cell NHL had similar outcomes, but caution is needed to interpret these data because of the small number of patients with T-cell NHL. In addition, in contrast to other studies,26,27 anaplastic large-cell lymphoma was the most common T-cell histologic subtype in our training cohort, but it has more favorable outcomes compared with other T-cell NHLs.26 Thus, although our study has shown that the risk stratification model can be generalized to patients with either B-cell or T-cell NHL, further validation is needed, especially for T-cell NHL. The patients we included also received heterogeneous regimens for salvage treatment. Although it has been well established that most salvage regimens show similar outcomes in R/R aggressive NHL, recent data have suggested that the CD20 mAb rituximab should be included in the salvage treatment if it was not previously used or if disease relapsed after a reasonably long duration of remission.3,28 However, a substantial proportion of patients with CD20+ aggressive B-cell NHL in our training and validation cohorts did not receive CD20 mAb as a part of the salvage regimen, which might affect posttransplant outcomes. Third, the present risk stratification model was developed by using clinical and functional imaging variables, but other biological features that might affect the prognosis were not considered. The data on cell-of-origin29 and double-expressor and double-hit/triple-hit status30 that have shown the prognostic influence in R/R DLBCL were not consistently available in this study. Thus, further studies are needed to evaluate the impact of these biological features on posttransplant outcomes when applying our risk model.
A comparison of data from the FDG-PET scan, notably quantitative variables, are still associated with various obstacles that come from the difficulties in standardization while obtaining and interpreting imaging data. However, recent data have shown that the visually assessed DS has high reproducibility in lymphoma patients because it compares FDG uptake in the lesions with that in the mediastinum and liver of each patient.31,32 Thus, 2 independent readers in each training and validation cohort visually re-assessed all available pretransplant PET scans using the Deauville criteria, which ensures that the application of our model in real clinical practice is robust.
In conclusion, pretransplant DS and other clinical risk factors (B symptoms and sIPI) predicted treatment outcomes after ASCT in patients with R/R aggressive NHL. By combining these factors, we established a risk stratification model that provides better prognostication compared with the pretransplant DS alone. This new risk model identified a large subgroup with excellent outcomes categorized into a low-risk group. The management of these patients is convincingly straightforward: ASCT is still the standard of care in these patients. Alternatively, the risk stratification model expands the number of patients who are expected to have extremely poor posttransplant outcomes. These patients should be preferentially selected for novel treatment strategy (eg, chimeric antigen receptor–modified T-cell therapy in R/R DLBCL) instead of proceeding to conventional ASCT. The new risk stratification model, therefore, can serve as a valuable clinical tool to help identify patients at high risk for posttransplant treatment failure who may be candidates for emerging novel treatment strategies. A freely accessible website is being made available to ascertain risk group by using the novel prognostic index (https://lymphoma.shinyapps.io/NHL-ASCT-PI/).
Requests for data sharing should be e-mailed to the corresponding authors: Robert Kridel at robert.kridel@uhn.ca or John Kuruvilla at john.kuruvilla@uhn.ca.
Acknowledgments
The authors thank our late colleague Krystyna Tybinkowski for her tremendous support in maintaining the lymphoma database of the Princess Margaret Cancer Registry.
This study was supported by Genome Canada, the Ontario Research Fund, Princess Margaret Cancer Centre, and The Princess Margaret Cancer Foundation.
Authorship
Contribution: H.-Y.Y., Y.E., U.M., C.-H.L., J.K., and R.K. designed the research; H.-Y.Y. and R.K. wrote the primary report; H.-Y.Y., M.C., A.P., V.K., S.B., N.L., D.H., R.T., S.E.Y., S.J.K., W.S.K., M.C., J.K., and R.K. assessed patients for eligibility and collected and interpreted clinical data; Y.E., U.M., K.-H.L., and C.-H.L. analyzed the PET-CT results; K.L. and W.X. performed statistical analyses; K.I. contributed to computational work; and all authors critically revised the manuscript and approved the final version for submission.
Conflict-of-interest disclosure: R.K. reports research funding from Gilead Sciences and Roche. The remaining authors declare no competing financial interests.
Correspondence: Robert Kridel, Division of Medical Oncology and Hematology, Princess Margaret Cancer Centre–University Health Network, Princess Margaret Cancer Research Tower, 101 College St, Room 12-311, Toronto, ON M5G 1L7, Canada; e-mail: robert.kridel@uhn.ca; and John Kuruvilla, Division of Medical Oncology and Hematology, Princess Margaret Cancer Centre–University Health Network, Princess Margaret Cancer Centre, 610 University Ave, OPG Room 6-424, Toronto, ON M5G 1Z5, Canada; e-mail: john.kuruvilla@uhn.ca.

